
Key Insights
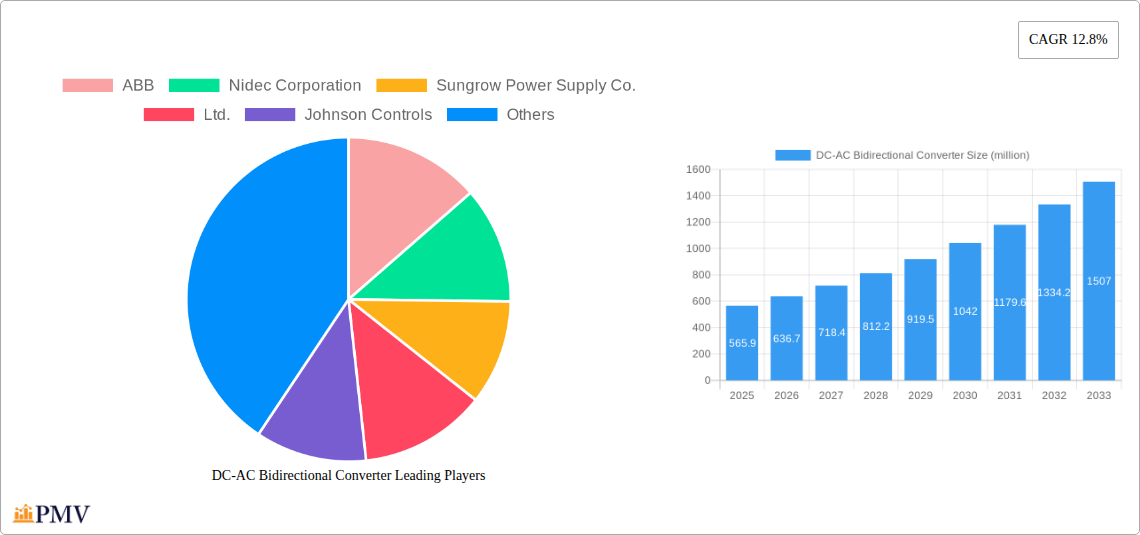
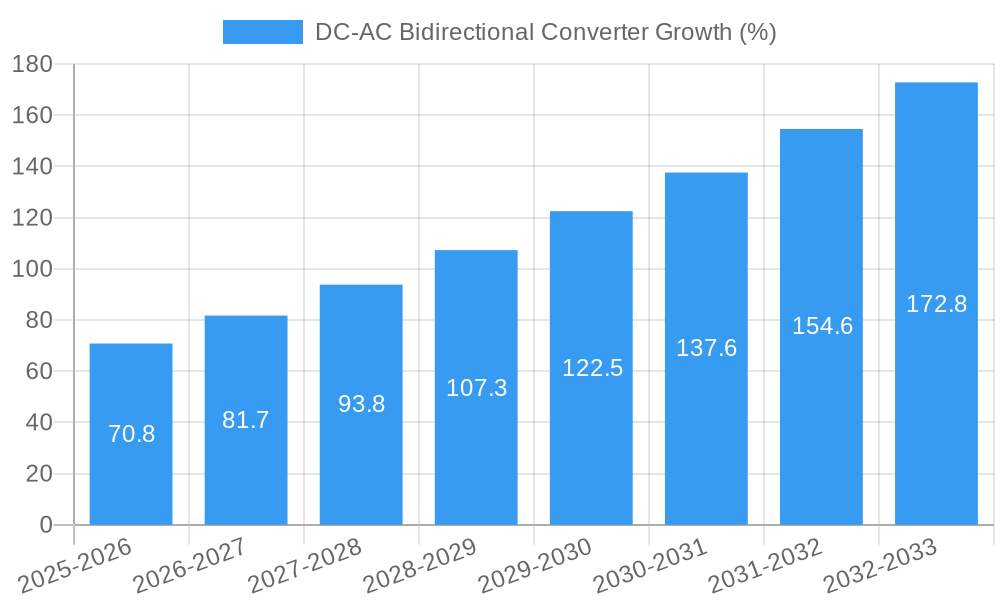
The global DC-AC bidirectional converter market is experiencing robust growth, projected to reach $565.9 million in 2025 and exhibiting a Compound Annual Growth Rate (CAGR) of 12.8% from 2019 to 2033. This expansion is driven primarily by the increasing adoption of renewable energy sources, particularly solar and wind power, which necessitate efficient energy storage and grid integration solutions. Bidirectional converters are crucial for enabling seamless energy flow between DC sources (like solar panels and batteries) and the AC grid, maximizing energy efficiency and grid stability. Furthermore, the rising demand for electric vehicles (EVs) and the expanding charging infrastructure are significant contributing factors. The need for advanced power electronics in EV charging stations to handle both charging and vehicle-to-grid (V2G) capabilities fuels market growth. Key players like ABB, Nidec, and Sungrow are leading the innovation in this space, developing advanced converters with higher power density, improved efficiency, and enhanced grid integration capabilities.
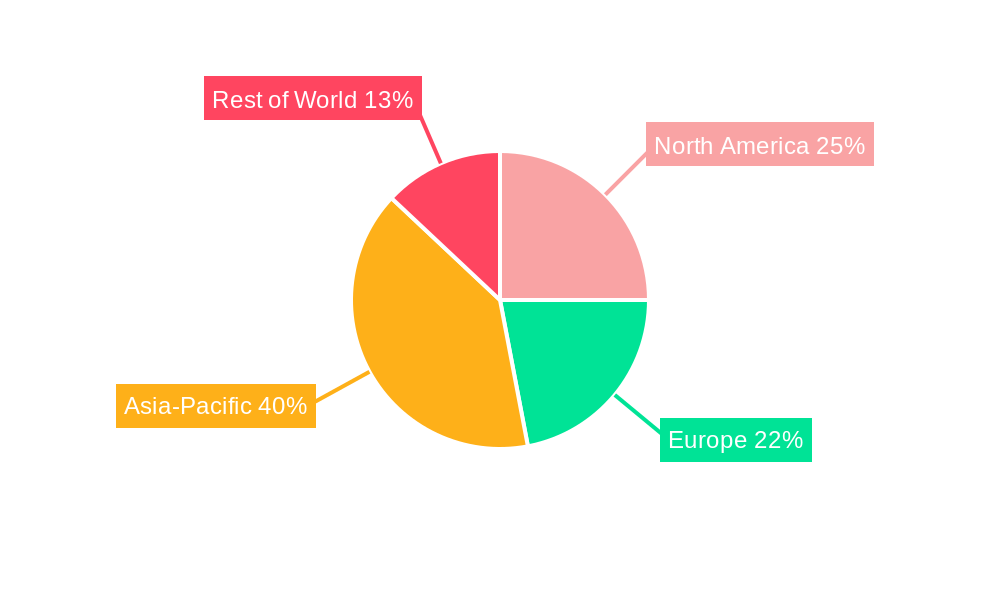
The market segmentation reveals strong growth across various sectors. While specific segment data isn't available, we can infer that the industrial sector (including manufacturing and data centers) will be a substantial driver, requiring robust power conversion solutions for backup power and grid stability. Similarly, the residential sector, fueled by the proliferation of rooftop solar and home energy storage systems, will contribute significantly. Geographic distribution likely sees strong growth in regions with significant renewable energy deployment, particularly Asia-Pacific (including China), followed by North America and Europe. However, constraints include the relatively high initial investment costs associated with bidirectional converters and the need for standardized regulations and grid infrastructure to fully realize the technology's potential. Ongoing research and development are focused on improving converter efficiency, reducing costs, and increasing power handling capabilities, all of which will further stimulate market expansion in the coming years.
DC-AC Bidirectional Converter Market Report: 2019-2033
This comprehensive report provides a detailed analysis of the global DC-AC Bidirectional Converter market, offering invaluable insights for stakeholders across the energy sector. The study period covers 2019-2033, with 2025 as the base and estimated year. The forecast period extends from 2025-2033, and the historical period encompasses 2019-2024. This report leverages extensive primary and secondary research to deliver a nuanced understanding of market dynamics, competitive landscapes, and future growth trajectories. The market is projected to reach xx million USD by 2033, exhibiting a CAGR of xx% during the forecast period.
DC-AC Bidirectional Converter Market Structure & Competitive Dynamics
The global DC-AC Bidirectional Converter market exhibits a moderately concentrated structure, with key players holding significant market share. The market is characterized by intense competition driven by technological innovation, evolving regulatory frameworks, and increasing demand for efficient energy solutions. Several factors influence market concentration, including M&A activities, product differentiation, and access to advanced technologies.
Market Concentration: The top five players account for approximately xx% of the global market share in 2025. This concentration is anticipated to remain relatively stable during the forecast period, albeit with potential shifts due to ongoing innovation and strategic partnerships.
Innovation Ecosystems: A robust innovation ecosystem fosters continuous advancements in DC-AC Bidirectional Converter technology. This includes collaborative efforts between manufacturers, research institutions, and government agencies to develop high-efficiency, cost-effective, and reliable converters.
Regulatory Frameworks: Government regulations and policies significantly influence market growth, particularly those related to renewable energy integration, grid modernization, and energy efficiency. Stringent emission standards are driving the adoption of efficient DC-AC converters in various applications.
Product Substitutes: While few direct substitutes exist, alternative technologies like high-voltage DC transmission systems can influence market growth. The competitive landscape also considers the efficiency and cost-effectiveness of these alternatives.
End-User Trends: The growing adoption of renewable energy sources like solar and wind power significantly boosts demand for DC-AC Bidirectional Converters. This is further fueled by the increasing electrification of transportation and the proliferation of electric vehicles.
M&A Activities: The DC-AC Bidirectional Converter market has witnessed several significant mergers and acquisitions (M&A) deals in recent years, valued at over xx million USD cumulatively. These transactions aim to expand market reach, enhance technological capabilities, and secure access to key resources. Examples include: (Specific examples of M&A deals with values, if available. Otherwise, "Limited publicly available data on M&A deal values").
DC-AC Bidirectional Converter Industry Trends & Insights
The DC-AC Bidirectional Converter market is experiencing robust growth, propelled by several key factors. The increasing penetration of renewable energy sources, coupled with the demand for efficient grid integration, is a major growth driver. Technological advancements in power electronics and the development of high-efficiency converters are contributing to market expansion. Furthermore, the rising adoption of electric vehicles and the electrification of transportation sectors are fostering market demand. Consumer preferences are increasingly shifting towards energy-efficient and sustainable solutions, creating a favorable environment for DC-AC Bidirectional Converters.
Market growth is primarily driven by:
Growing Renewable Energy Integration: The global transition towards renewable energy sources, particularly solar and wind power, is a key driver. DC-AC bidirectional converters are essential for seamless integration of these variable renewable energy sources into the grid.
Technological Advancements: Continuous improvements in power electronic components, such as IGBTs and SiC MOSFETs, enhance the efficiency and performance of DC-AC bidirectional converters. This leads to improved cost-effectiveness and broader market adoption.
Electric Vehicle (EV) Revolution: The rapidly expanding electric vehicle market is a significant growth catalyst. DC-AC bidirectional converters play a crucial role in the charging infrastructure for electric vehicles.
Smart Grid Deployment: The increasing deployment of smart grids is creating substantial demand for advanced power electronics, including DC-AC bidirectional converters, for optimized energy management and grid stability.
The market is expected to witness significant growth, with a projected CAGR of xx% during the forecast period. Market penetration is expected to increase from xx% in 2025 to xx% by 2033, driven by factors mentioned above. Competitive dynamics will continue to shape market evolution, with companies focusing on innovation, strategic partnerships, and cost optimization.
Dominant Markets & Segments in DC-AC Bidirectional Converter
The [Specify leading region/country – e.g., North America, China] region currently dominates the global DC-AC Bidirectional Converter market. This dominance is attributed to a confluence of factors:
Robust Renewable Energy Policies: Supportive government policies and incentives for renewable energy integration have significantly boosted market growth in this region.
Advanced Grid Infrastructure: Well-developed grid infrastructure facilitates the deployment and integration of DC-AC bidirectional converters.
High Adoption of EVs: The high adoption rate of electric vehicles in [Specify leading region/country] contributes to increased demand for charging infrastructure incorporating DC-AC bidirectional converters.
Technological Advancements: Significant investments in research and development have led to the development of advanced and efficient DC-AC bidirectional converter technologies within this region.
Detailed analysis reveals [Specify region/country]’s significant market share, exceeding xx% in 2025. This region is projected to maintain its leading position throughout the forecast period due to the sustained growth in renewable energy adoption, robust infrastructure development, and favorable government policies. Other regions, such as [Mention other significant regions and their respective market shares and growth drivers, if data is available. Otherwise, mention anticipated regional performance].
DC-AC Bidirectional Converter Product Innovations
Recent innovations in DC-AC bidirectional converters focus on enhancing efficiency, reducing size and weight, and improving reliability. The integration of advanced power semiconductor devices like Silicon Carbide (SiC) and Gallium Nitride (GaN) MOSFETs is leading to significant improvements in switching speeds and energy efficiency. These advancements are expanding the applications of DC-AC bidirectional converters in various sectors, including renewable energy integration, electric vehicle charging, and microgrid systems. The market is witnessing a growing trend toward modular and scalable designs, which offer greater flexibility and cost-effectiveness for diverse applications.
Report Segmentation & Scope
The report segments the DC-AC Bidirectional Converter market based on several key parameters:
By Power Rating: This segment categorizes converters based on their power handling capacity, encompassing low, medium, and high-power ratings. Each segment exhibits distinct growth trajectories and competitive dynamics, influenced by application requirements and technological advancements. Market size for each category is xx million USD for 2025, and projections are available for the entire forecast period.
By Application: This segment includes applications such as renewable energy integration (solar, wind), electric vehicle charging, energy storage systems, and microgrids. Each application segment showcases unique growth drivers and challenges based on specific requirements and regulatory frameworks. Projections indicate xx million USD market size for each application segment in 2025.
By Technology: The segment analyzes different technologies used in DC-AC Bidirectional converters, such as pulse-width modulation (PWM) and resonant converters. Market share and growth forecasts are provided for each technology based on efficiency, cost, and technological advancements. The 2025 market size for each technology is estimated to be xx million USD.
By Region: Geographical segmentation provides a regional breakdown of the market, including North America, Europe, Asia-Pacific, and other regions. The analysis includes market size, growth projections, and key regional trends. The 2025 market size for each region is estimated to be xx million USD.
Key Drivers of DC-AC Bidirectional Converter Growth
Several factors contribute to the robust growth of the DC-AC Bidirectional Converter market. Firstly, the global push towards renewable energy adoption necessitates efficient grid integration solutions, directly benefiting the market. Government policies supporting renewable energy and energy storage systems further fuel growth. Technological advancements, particularly in power semiconductor devices, significantly improve converter efficiency and cost-effectiveness, driving wider market penetration. The burgeoning electric vehicle market and the expanding need for charging infrastructure also stimulate market expansion.
Challenges in the DC-AC Bidirectional Converter Sector
Despite significant growth potential, challenges remain within the DC-AC Bidirectional Converter sector. These include high initial investment costs for advanced converter technologies, posing a barrier to widespread adoption. Supply chain disruptions and the availability of critical components (like power semiconductors) can impact production and market availability. Furthermore, standardization and interoperability issues may hinder seamless integration across different grid systems. The intense competition among manufacturers necessitates ongoing innovation and cost-optimization strategies to maintain market share.
Leading Players in the DC-AC Bidirectional Converter Market
- ABB
- Nidec Corporation
- Sungrow Power Supply Co.,Ltd.
- Johnson Controls
- Parker Hannifin
- Delta Electronics
- HNAC Technology Co.,Ltd.
- Destin Power Inc.
- Jiangsu Linyang Energy Co.,Ltd.
- China Greatwall Technology Group Co.,Ltd.
- Dynapower
- Shanghai Sermatec Energy Technology Co.,ltd.
- Shenzhen Kstar Science&Technology Co.,Ltd.
- Soaring
- TBEA
- Shenzhen Sinexcel Electric Co.,Ltd.
Key Developments in DC-AC Bidirectional Converter Sector
- [Month, Year]: ABB launched a new line of high-efficiency DC-AC bidirectional converters with improved power density, impacting market competition.
- [Month, Year]: Sungrow Power Supply Co., Ltd. announced a strategic partnership with a major renewable energy developer, expanding its market reach in the renewable energy sector.
- [Month, Year]: [Insert another significant development with date and impact – if information is not available use "Further significant developments are expected throughout the forecast period"].
Strategic DC-AC Bidirectional Converter Market Outlook
The DC-AC Bidirectional Converter market presents significant growth potential driven by accelerating renewable energy integration, the rise of electric vehicles, and advancements in power electronics. Strategic opportunities exist for companies focusing on innovative technologies, cost-effective solutions, and strategic partnerships. The market is poised for sustained expansion, particularly in regions with supportive government policies and robust grid infrastructure. Companies with strong R&D capabilities and a focus on sustainable solutions are well-positioned to capitalize on the emerging market opportunities.
DC-AC Bidirectional Converter Segmentation
-
1. Application
- 1.1. Power Station
- 1.2. Others
-
2. Types
- 2.1. Less than 500KW
- 2.2. 500KW-1MW
- 2.3. Above than 1MW
DC-AC Bidirectional Converter Segmentation By Geography
-
1. North America
- 1.1. United States
- 1.2. Canada
- 1.3. Mexico
-
2. South America
- 2.1. Brazil
- 2.2. Argentina
- 2.3. Rest of South America
-
3. Europe
- 3.1. United Kingdom
- 3.2. Germany
- 3.3. France
- 3.4. Italy
- 3.5. Spain
- 3.6. Russia
- 3.7. Benelux
- 3.8. Nordics
- 3.9. Rest of Europe
-
4. Middle East & Africa
- 4.1. Turkey
- 4.2. Israel
- 4.3. GCC
- 4.4. North Africa
- 4.5. South Africa
- 4.6. Rest of Middle East & Africa
-
5. Asia Pacific
- 5.1. China
- 5.2. India
- 5.3. Japan
- 5.4. South Korea
- 5.5. ASEAN
- 5.6. Oceania
- 5.7. Rest of Asia Pacific
DC-AC Bidirectional Converter REPORT HIGHLIGHTS
| Aspects | Details |
|---|---|
| Study Period | 2019-2033 |
| Base Year | 2024 |
| Estimated Year | 2025 |
| Forecast Period | 2025-2033 |
| Historical Period | 2019-2024 |
| Growth Rate | CAGR of 12.8% from 2019-2033 |
| Segmentation |
|
Table of Contents
- 1. Introduction
- 1.1. Research Scope
- 1.2. Market Segmentation
- 1.3. Research Methodology
- 1.4. Definitions and Assumptions
- 2. Executive Summary
- 2.1. Introduction
- 3. Market Dynamics
- 3.1. Introduction
- 3.2. Market Drivers
- 3.3. Market Restrains
- 3.4. Market Trends
- 4. Market Factor Analysis
- 4.1. Porters Five Forces
- 4.2. Supply/Value Chain
- 4.3. PESTEL analysis
- 4.4. Market Entropy
- 4.5. Patent/Trademark Analysis
- 5. Global DC-AC Bidirectional Converter Analysis, Insights and Forecast, 2019-2031
- 5.1. Market Analysis, Insights and Forecast - by Application
- 5.1.1. Power Station
- 5.1.2. Others
- 5.2. Market Analysis, Insights and Forecast - by Types
- 5.2.1. Less than 500KW
- 5.2.2. 500KW-1MW
- 5.2.3. Above than 1MW
- 5.3. Market Analysis, Insights and Forecast - by Region
- 5.3.1. North America
- 5.3.2. South America
- 5.3.3. Europe
- 5.3.4. Middle East & Africa
- 5.3.5. Asia Pacific
- 5.1. Market Analysis, Insights and Forecast - by Application
- 6. North America DC-AC Bidirectional Converter Analysis, Insights and Forecast, 2019-2031
- 6.1. Market Analysis, Insights and Forecast - by Application
- 6.1.1. Power Station
- 6.1.2. Others
- 6.2. Market Analysis, Insights and Forecast - by Types
- 6.2.1. Less than 500KW
- 6.2.2. 500KW-1MW
- 6.2.3. Above than 1MW
- 6.1. Market Analysis, Insights and Forecast - by Application
- 7. South America DC-AC Bidirectional Converter Analysis, Insights and Forecast, 2019-2031
- 7.1. Market Analysis, Insights and Forecast - by Application
- 7.1.1. Power Station
- 7.1.2. Others
- 7.2. Market Analysis, Insights and Forecast - by Types
- 7.2.1. Less than 500KW
- 7.2.2. 500KW-1MW
- 7.2.3. Above than 1MW
- 7.1. Market Analysis, Insights and Forecast - by Application
- 8. Europe DC-AC Bidirectional Converter Analysis, Insights and Forecast, 2019-2031
- 8.1. Market Analysis, Insights and Forecast - by Application
- 8.1.1. Power Station
- 8.1.2. Others
- 8.2. Market Analysis, Insights and Forecast - by Types
- 8.2.1. Less than 500KW
- 8.2.2. 500KW-1MW
- 8.2.3. Above than 1MW
- 8.1. Market Analysis, Insights and Forecast - by Application
- 9. Middle East & Africa DC-AC Bidirectional Converter Analysis, Insights and Forecast, 2019-2031
- 9.1. Market Analysis, Insights and Forecast - by Application
- 9.1.1. Power Station
- 9.1.2. Others
- 9.2. Market Analysis, Insights and Forecast - by Types
- 9.2.1. Less than 500KW
- 9.2.2. 500KW-1MW
- 9.2.3. Above than 1MW
- 9.1. Market Analysis, Insights and Forecast - by Application
- 10. Asia Pacific DC-AC Bidirectional Converter Analysis, Insights and Forecast, 2019-2031
- 10.1. Market Analysis, Insights and Forecast - by Application
- 10.1.1. Power Station
- 10.1.2. Others
- 10.2. Market Analysis, Insights and Forecast - by Types
- 10.2.1. Less than 500KW
- 10.2.2. 500KW-1MW
- 10.2.3. Above than 1MW
- 10.1. Market Analysis, Insights and Forecast - by Application
- 11. Competitive Analysis
- 11.1. Global Market Share Analysis 2024
- 11.2. Company Profiles
- 11.2.1 ABB
- 11.2.1.1. Overview
- 11.2.1.2. Products
- 11.2.1.3. SWOT Analysis
- 11.2.1.4. Recent Developments
- 11.2.1.5. Financials (Based on Availability)
- 11.2.2 Nidec Corporation
- 11.2.2.1. Overview
- 11.2.2.2. Products
- 11.2.2.3. SWOT Analysis
- 11.2.2.4. Recent Developments
- 11.2.2.5. Financials (Based on Availability)
- 11.2.3 Sungrow Power Supply Co.
- 11.2.3.1. Overview
- 11.2.3.2. Products
- 11.2.3.3. SWOT Analysis
- 11.2.3.4. Recent Developments
- 11.2.3.5. Financials (Based on Availability)
- 11.2.4 Ltd.
- 11.2.4.1. Overview
- 11.2.4.2. Products
- 11.2.4.3. SWOT Analysis
- 11.2.4.4. Recent Developments
- 11.2.4.5. Financials (Based on Availability)
- 11.2.5 Johnson Controls
- 11.2.5.1. Overview
- 11.2.5.2. Products
- 11.2.5.3. SWOT Analysis
- 11.2.5.4. Recent Developments
- 11.2.5.5. Financials (Based on Availability)
- 11.2.6 Parker Hannifin
- 11.2.6.1. Overview
- 11.2.6.2. Products
- 11.2.6.3. SWOT Analysis
- 11.2.6.4. Recent Developments
- 11.2.6.5. Financials (Based on Availability)
- 11.2.7 Delta Electronics
- 11.2.7.1. Overview
- 11.2.7.2. Products
- 11.2.7.3. SWOT Analysis
- 11.2.7.4. Recent Developments
- 11.2.7.5. Financials (Based on Availability)
- 11.2.8 HNAC Technology Co.
- 11.2.8.1. Overview
- 11.2.8.2. Products
- 11.2.8.3. SWOT Analysis
- 11.2.8.4. Recent Developments
- 11.2.8.5. Financials (Based on Availability)
- 11.2.9 Ltd.
- 11.2.9.1. Overview
- 11.2.9.2. Products
- 11.2.9.3. SWOT Analysis
- 11.2.9.4. Recent Developments
- 11.2.9.5. Financials (Based on Availability)
- 11.2.10 Destin Power Inc.
- 11.2.10.1. Overview
- 11.2.10.2. Products
- 11.2.10.3. SWOT Analysis
- 11.2.10.4. Recent Developments
- 11.2.10.5. Financials (Based on Availability)
- 11.2.11 Jiangsu Linyang Energy Co.
- 11.2.11.1. Overview
- 11.2.11.2. Products
- 11.2.11.3. SWOT Analysis
- 11.2.11.4. Recent Developments
- 11.2.11.5. Financials (Based on Availability)
- 11.2.12 Ltd.
- 11.2.12.1. Overview
- 11.2.12.2. Products
- 11.2.12.3. SWOT Analysis
- 11.2.12.4. Recent Developments
- 11.2.12.5. Financials (Based on Availability)
- 11.2.13 China Greatwall Technology Group Co.
- 11.2.13.1. Overview
- 11.2.13.2. Products
- 11.2.13.3. SWOT Analysis
- 11.2.13.4. Recent Developments
- 11.2.13.5. Financials (Based on Availability)
- 11.2.14 Ltd.
- 11.2.14.1. Overview
- 11.2.14.2. Products
- 11.2.14.3. SWOT Analysis
- 11.2.14.4. Recent Developments
- 11.2.14.5. Financials (Based on Availability)
- 11.2.15 Dynapower
- 11.2.15.1. Overview
- 11.2.15.2. Products
- 11.2.15.3. SWOT Analysis
- 11.2.15.4. Recent Developments
- 11.2.15.5. Financials (Based on Availability)
- 11.2.16 Shanghai Sermatec Energy Technology Co.
- 11.2.16.1. Overview
- 11.2.16.2. Products
- 11.2.16.3. SWOT Analysis
- 11.2.16.4. Recent Developments
- 11.2.16.5. Financials (Based on Availability)
- 11.2.17 ltd.
- 11.2.17.1. Overview
- 11.2.17.2. Products
- 11.2.17.3. SWOT Analysis
- 11.2.17.4. Recent Developments
- 11.2.17.5. Financials (Based on Availability)
- 11.2.18 Shenzhen Kstar Science&Technology Co.
- 11.2.18.1. Overview
- 11.2.18.2. Products
- 11.2.18.3. SWOT Analysis
- 11.2.18.4. Recent Developments
- 11.2.18.5. Financials (Based on Availability)
- 11.2.19 Ltd.
- 11.2.19.1. Overview
- 11.2.19.2. Products
- 11.2.19.3. SWOT Analysis
- 11.2.19.4. Recent Developments
- 11.2.19.5. Financials (Based on Availability)
- 11.2.20 Soaring
- 11.2.20.1. Overview
- 11.2.20.2. Products
- 11.2.20.3. SWOT Analysis
- 11.2.20.4. Recent Developments
- 11.2.20.5. Financials (Based on Availability)
- 11.2.21 TBEA
- 11.2.21.1. Overview
- 11.2.21.2. Products
- 11.2.21.3. SWOT Analysis
- 11.2.21.4. Recent Developments
- 11.2.21.5. Financials (Based on Availability)
- 11.2.22 Shenzhen Sinexcel Electric Co.
- 11.2.22.1. Overview
- 11.2.22.2. Products
- 11.2.22.3. SWOT Analysis
- 11.2.22.4. Recent Developments
- 11.2.22.5. Financials (Based on Availability)
- 11.2.23 Ltd.
- 11.2.23.1. Overview
- 11.2.23.2. Products
- 11.2.23.3. SWOT Analysis
- 11.2.23.4. Recent Developments
- 11.2.23.5. Financials (Based on Availability)
- 11.2.1 ABB
List of Figures
- Figure 1: Global DC-AC Bidirectional Converter Revenue Breakdown (million, %) by Region 2024 & 2032
- Figure 2: Global DC-AC Bidirectional Converter Volume Breakdown (K, %) by Region 2024 & 2032
- Figure 3: North America DC-AC Bidirectional Converter Revenue (million), by Application 2024 & 2032
- Figure 4: North America DC-AC Bidirectional Converter Volume (K), by Application 2024 & 2032
- Figure 5: North America DC-AC Bidirectional Converter Revenue Share (%), by Application 2024 & 2032
- Figure 6: North America DC-AC Bidirectional Converter Volume Share (%), by Application 2024 & 2032
- Figure 7: North America DC-AC Bidirectional Converter Revenue (million), by Types 2024 & 2032
- Figure 8: North America DC-AC Bidirectional Converter Volume (K), by Types 2024 & 2032
- Figure 9: North America DC-AC Bidirectional Converter Revenue Share (%), by Types 2024 & 2032
- Figure 10: North America DC-AC Bidirectional Converter Volume Share (%), by Types 2024 & 2032
- Figure 11: North America DC-AC Bidirectional Converter Revenue (million), by Country 2024 & 2032
- Figure 12: North America DC-AC Bidirectional Converter Volume (K), by Country 2024 & 2032
- Figure 13: North America DC-AC Bidirectional Converter Revenue Share (%), by Country 2024 & 2032
- Figure 14: North America DC-AC Bidirectional Converter Volume Share (%), by Country 2024 & 2032
- Figure 15: South America DC-AC Bidirectional Converter Revenue (million), by Application 2024 & 2032
- Figure 16: South America DC-AC Bidirectional Converter Volume (K), by Application 2024 & 2032
- Figure 17: South America DC-AC Bidirectional Converter Revenue Share (%), by Application 2024 & 2032
- Figure 18: South America DC-AC Bidirectional Converter Volume Share (%), by Application 2024 & 2032
- Figure 19: South America DC-AC Bidirectional Converter Revenue (million), by Types 2024 & 2032
- Figure 20: South America DC-AC Bidirectional Converter Volume (K), by Types 2024 & 2032
- Figure 21: South America DC-AC Bidirectional Converter Revenue Share (%), by Types 2024 & 2032
- Figure 22: South America DC-AC Bidirectional Converter Volume Share (%), by Types 2024 & 2032
- Figure 23: South America DC-AC Bidirectional Converter Revenue (million), by Country 2024 & 2032
- Figure 24: South America DC-AC Bidirectional Converter Volume (K), by Country 2024 & 2032
- Figure 25: South America DC-AC Bidirectional Converter Revenue Share (%), by Country 2024 & 2032
- Figure 26: South America DC-AC Bidirectional Converter Volume Share (%), by Country 2024 & 2032
- Figure 27: Europe DC-AC Bidirectional Converter Revenue (million), by Application 2024 & 2032
- Figure 28: Europe DC-AC Bidirectional Converter Volume (K), by Application 2024 & 2032
- Figure 29: Europe DC-AC Bidirectional Converter Revenue Share (%), by Application 2024 & 2032
- Figure 30: Europe DC-AC Bidirectional Converter Volume Share (%), by Application 2024 & 2032
- Figure 31: Europe DC-AC Bidirectional Converter Revenue (million), by Types 2024 & 2032
- Figure 32: Europe DC-AC Bidirectional Converter Volume (K), by Types 2024 & 2032
- Figure 33: Europe DC-AC Bidirectional Converter Revenue Share (%), by Types 2024 & 2032
- Figure 34: Europe DC-AC Bidirectional Converter Volume Share (%), by Types 2024 & 2032
- Figure 35: Europe DC-AC Bidirectional Converter Revenue (million), by Country 2024 & 2032
- Figure 36: Europe DC-AC Bidirectional Converter Volume (K), by Country 2024 & 2032
- Figure 37: Europe DC-AC Bidirectional Converter Revenue Share (%), by Country 2024 & 2032
- Figure 38: Europe DC-AC Bidirectional Converter Volume Share (%), by Country 2024 & 2032
- Figure 39: Middle East & Africa DC-AC Bidirectional Converter Revenue (million), by Application 2024 & 2032
- Figure 40: Middle East & Africa DC-AC Bidirectional Converter Volume (K), by Application 2024 & 2032
- Figure 41: Middle East & Africa DC-AC Bidirectional Converter Revenue Share (%), by Application 2024 & 2032
- Figure 42: Middle East & Africa DC-AC Bidirectional Converter Volume Share (%), by Application 2024 & 2032
- Figure 43: Middle East & Africa DC-AC Bidirectional Converter Revenue (million), by Types 2024 & 2032
- Figure 44: Middle East & Africa DC-AC Bidirectional Converter Volume (K), by Types 2024 & 2032
- Figure 45: Middle East & Africa DC-AC Bidirectional Converter Revenue Share (%), by Types 2024 & 2032
- Figure 46: Middle East & Africa DC-AC Bidirectional Converter Volume Share (%), by Types 2024 & 2032
- Figure 47: Middle East & Africa DC-AC Bidirectional Converter Revenue (million), by Country 2024 & 2032
- Figure 48: Middle East & Africa DC-AC Bidirectional Converter Volume (K), by Country 2024 & 2032
- Figure 49: Middle East & Africa DC-AC Bidirectional Converter Revenue Share (%), by Country 2024 & 2032
- Figure 50: Middle East & Africa DC-AC Bidirectional Converter Volume Share (%), by Country 2024 & 2032
- Figure 51: Asia Pacific DC-AC Bidirectional Converter Revenue (million), by Application 2024 & 2032
- Figure 52: Asia Pacific DC-AC Bidirectional Converter Volume (K), by Application 2024 & 2032
- Figure 53: Asia Pacific DC-AC Bidirectional Converter Revenue Share (%), by Application 2024 & 2032
- Figure 54: Asia Pacific DC-AC Bidirectional Converter Volume Share (%), by Application 2024 & 2032
- Figure 55: Asia Pacific DC-AC Bidirectional Converter Revenue (million), by Types 2024 & 2032
- Figure 56: Asia Pacific DC-AC Bidirectional Converter Volume (K), by Types 2024 & 2032
- Figure 57: Asia Pacific DC-AC Bidirectional Converter Revenue Share (%), by Types 2024 & 2032
- Figure 58: Asia Pacific DC-AC Bidirectional Converter Volume Share (%), by Types 2024 & 2032
- Figure 59: Asia Pacific DC-AC Bidirectional Converter Revenue (million), by Country 2024 & 2032
- Figure 60: Asia Pacific DC-AC Bidirectional Converter Volume (K), by Country 2024 & 2032
- Figure 61: Asia Pacific DC-AC Bidirectional Converter Revenue Share (%), by Country 2024 & 2032
- Figure 62: Asia Pacific DC-AC Bidirectional Converter Volume Share (%), by Country 2024 & 2032
List of Tables
- Table 1: Global DC-AC Bidirectional Converter Revenue million Forecast, by Region 2019 & 2032
- Table 2: Global DC-AC Bidirectional Converter Volume K Forecast, by Region 2019 & 2032
- Table 3: Global DC-AC Bidirectional Converter Revenue million Forecast, by Application 2019 & 2032
- Table 4: Global DC-AC Bidirectional Converter Volume K Forecast, by Application 2019 & 2032
- Table 5: Global DC-AC Bidirectional Converter Revenue million Forecast, by Types 2019 & 2032
- Table 6: Global DC-AC Bidirectional Converter Volume K Forecast, by Types 2019 & 2032
- Table 7: Global DC-AC Bidirectional Converter Revenue million Forecast, by Region 2019 & 2032
- Table 8: Global DC-AC Bidirectional Converter Volume K Forecast, by Region 2019 & 2032
- Table 9: Global DC-AC Bidirectional Converter Revenue million Forecast, by Application 2019 & 2032
- Table 10: Global DC-AC Bidirectional Converter Volume K Forecast, by Application 2019 & 2032
- Table 11: Global DC-AC Bidirectional Converter Revenue million Forecast, by Types 2019 & 2032
- Table 12: Global DC-AC Bidirectional Converter Volume K Forecast, by Types 2019 & 2032
- Table 13: Global DC-AC Bidirectional Converter Revenue million Forecast, by Country 2019 & 2032
- Table 14: Global DC-AC Bidirectional Converter Volume K Forecast, by Country 2019 & 2032
- Table 15: United States DC-AC Bidirectional Converter Revenue (million) Forecast, by Application 2019 & 2032
- Table 16: United States DC-AC Bidirectional Converter Volume (K) Forecast, by Application 2019 & 2032
- Table 17: Canada DC-AC Bidirectional Converter Revenue (million) Forecast, by Application 2019 & 2032
- Table 18: Canada DC-AC Bidirectional Converter Volume (K) Forecast, by Application 2019 & 2032
- Table 19: Mexico DC-AC Bidirectional Converter Revenue (million) Forecast, by Application 2019 & 2032
- Table 20: Mexico DC-AC Bidirectional Converter Volume (K) Forecast, by Application 2019 & 2032
- Table 21: Global DC-AC Bidirectional Converter Revenue million Forecast, by Application 2019 & 2032
- Table 22: Global DC-AC Bidirectional Converter Volume K Forecast, by Application 2019 & 2032
- Table 23: Global DC-AC Bidirectional Converter Revenue million Forecast, by Types 2019 & 2032
- Table 24: Global DC-AC Bidirectional Converter Volume K Forecast, by Types 2019 & 2032
- Table 25: Global DC-AC Bidirectional Converter Revenue million Forecast, by Country 2019 & 2032
- Table 26: Global DC-AC Bidirectional Converter Volume K Forecast, by Country 2019 & 2032
- Table 27: Brazil DC-AC Bidirectional Converter Revenue (million) Forecast, by Application 2019 & 2032
- Table 28: Brazil DC-AC Bidirectional Converter Volume (K) Forecast, by Application 2019 & 2032
- Table 29: Argentina DC-AC Bidirectional Converter Revenue (million) Forecast, by Application 2019 & 2032
- Table 30: Argentina DC-AC Bidirectional Converter Volume (K) Forecast, by Application 2019 & 2032
- Table 31: Rest of South America DC-AC Bidirectional Converter Revenue (million) Forecast, by Application 2019 & 2032
- Table 32: Rest of South America DC-AC Bidirectional Converter Volume (K) Forecast, by Application 2019 & 2032
- Table 33: Global DC-AC Bidirectional Converter Revenue million Forecast, by Application 2019 & 2032
- Table 34: Global DC-AC Bidirectional Converter Volume K Forecast, by Application 2019 & 2032
- Table 35: Global DC-AC Bidirectional Converter Revenue million Forecast, by Types 2019 & 2032
- Table 36: Global DC-AC Bidirectional Converter Volume K Forecast, by Types 2019 & 2032
- Table 37: Global DC-AC Bidirectional Converter Revenue million Forecast, by Country 2019 & 2032
- Table 38: Global DC-AC Bidirectional Converter Volume K Forecast, by Country 2019 & 2032
- Table 39: United Kingdom DC-AC Bidirectional Converter Revenue (million) Forecast, by Application 2019 & 2032
- Table 40: United Kingdom DC-AC Bidirectional Converter Volume (K) Forecast, by Application 2019 & 2032
- Table 41: Germany DC-AC Bidirectional Converter Revenue (million) Forecast, by Application 2019 & 2032
- Table 42: Germany DC-AC Bidirectional Converter Volume (K) Forecast, by Application 2019 & 2032
- Table 43: France DC-AC Bidirectional Converter Revenue (million) Forecast, by Application 2019 & 2032
- Table 44: France DC-AC Bidirectional Converter Volume (K) Forecast, by Application 2019 & 2032
- Table 45: Italy DC-AC Bidirectional Converter Revenue (million) Forecast, by Application 2019 & 2032
- Table 46: Italy DC-AC Bidirectional Converter Volume (K) Forecast, by Application 2019 & 2032
- Table 47: Spain DC-AC Bidirectional Converter Revenue (million) Forecast, by Application 2019 & 2032
- Table 48: Spain DC-AC Bidirectional Converter Volume (K) Forecast, by Application 2019 & 2032
- Table 49: Russia DC-AC Bidirectional Converter Revenue (million) Forecast, by Application 2019 & 2032
- Table 50: Russia DC-AC Bidirectional Converter Volume (K) Forecast, by Application 2019 & 2032
- Table 51: Benelux DC-AC Bidirectional Converter Revenue (million) Forecast, by Application 2019 & 2032
- Table 52: Benelux DC-AC Bidirectional Converter Volume (K) Forecast, by Application 2019 & 2032
- Table 53: Nordics DC-AC Bidirectional Converter Revenue (million) Forecast, by Application 2019 & 2032
- Table 54: Nordics DC-AC Bidirectional Converter Volume (K) Forecast, by Application 2019 & 2032
- Table 55: Rest of Europe DC-AC Bidirectional Converter Revenue (million) Forecast, by Application 2019 & 2032
- Table 56: Rest of Europe DC-AC Bidirectional Converter Volume (K) Forecast, by Application 2019 & 2032
- Table 57: Global DC-AC Bidirectional Converter Revenue million Forecast, by Application 2019 & 2032
- Table 58: Global DC-AC Bidirectional Converter Volume K Forecast, by Application 2019 & 2032
- Table 59: Global DC-AC Bidirectional Converter Revenue million Forecast, by Types 2019 & 2032
- Table 60: Global DC-AC Bidirectional Converter Volume K Forecast, by Types 2019 & 2032
- Table 61: Global DC-AC Bidirectional Converter Revenue million Forecast, by Country 2019 & 2032
- Table 62: Global DC-AC Bidirectional Converter Volume K Forecast, by Country 2019 & 2032
- Table 63: Turkey DC-AC Bidirectional Converter Revenue (million) Forecast, by Application 2019 & 2032
- Table 64: Turkey DC-AC Bidirectional Converter Volume (K) Forecast, by Application 2019 & 2032
- Table 65: Israel DC-AC Bidirectional Converter Revenue (million) Forecast, by Application 2019 & 2032
- Table 66: Israel DC-AC Bidirectional Converter Volume (K) Forecast, by Application 2019 & 2032
- Table 67: GCC DC-AC Bidirectional Converter Revenue (million) Forecast, by Application 2019 & 2032
- Table 68: GCC DC-AC Bidirectional Converter Volume (K) Forecast, by Application 2019 & 2032
- Table 69: North Africa DC-AC Bidirectional Converter Revenue (million) Forecast, by Application 2019 & 2032
- Table 70: North Africa DC-AC Bidirectional Converter Volume (K) Forecast, by Application 2019 & 2032
- Table 71: South Africa DC-AC Bidirectional Converter Revenue (million) Forecast, by Application 2019 & 2032
- Table 72: South Africa DC-AC Bidirectional Converter Volume (K) Forecast, by Application 2019 & 2032
- Table 73: Rest of Middle East & Africa DC-AC Bidirectional Converter Revenue (million) Forecast, by Application 2019 & 2032
- Table 74: Rest of Middle East & Africa DC-AC Bidirectional Converter Volume (K) Forecast, by Application 2019 & 2032
- Table 75: Global DC-AC Bidirectional Converter Revenue million Forecast, by Application 2019 & 2032
- Table 76: Global DC-AC Bidirectional Converter Volume K Forecast, by Application 2019 & 2032
- Table 77: Global DC-AC Bidirectional Converter Revenue million Forecast, by Types 2019 & 2032
- Table 78: Global DC-AC Bidirectional Converter Volume K Forecast, by Types 2019 & 2032
- Table 79: Global DC-AC Bidirectional Converter Revenue million Forecast, by Country 2019 & 2032
- Table 80: Global DC-AC Bidirectional Converter Volume K Forecast, by Country 2019 & 2032
- Table 81: China DC-AC Bidirectional Converter Revenue (million) Forecast, by Application 2019 & 2032
- Table 82: China DC-AC Bidirectional Converter Volume (K) Forecast, by Application 2019 & 2032
- Table 83: India DC-AC Bidirectional Converter Revenue (million) Forecast, by Application 2019 & 2032
- Table 84: India DC-AC Bidirectional Converter Volume (K) Forecast, by Application 2019 & 2032
- Table 85: Japan DC-AC Bidirectional Converter Revenue (million) Forecast, by Application 2019 & 2032
- Table 86: Japan DC-AC Bidirectional Converter Volume (K) Forecast, by Application 2019 & 2032
- Table 87: South Korea DC-AC Bidirectional Converter Revenue (million) Forecast, by Application 2019 & 2032
- Table 88: South Korea DC-AC Bidirectional Converter Volume (K) Forecast, by Application 2019 & 2032
- Table 89: ASEAN DC-AC Bidirectional Converter Revenue (million) Forecast, by Application 2019 & 2032
- Table 90: ASEAN DC-AC Bidirectional Converter Volume (K) Forecast, by Application 2019 & 2032
- Table 91: Oceania DC-AC Bidirectional Converter Revenue (million) Forecast, by Application 2019 & 2032
- Table 92: Oceania DC-AC Bidirectional Converter Volume (K) Forecast, by Application 2019 & 2032
- Table 93: Rest of Asia Pacific DC-AC Bidirectional Converter Revenue (million) Forecast, by Application 2019 & 2032
- Table 94: Rest of Asia Pacific DC-AC Bidirectional Converter Volume (K) Forecast, by Application 2019 & 2032
Frequently Asked Questions
1. What is the projected Compound Annual Growth Rate (CAGR) of the DC-AC Bidirectional Converter?
The projected CAGR is approximately 12.8%.
2. Which companies are prominent players in the DC-AC Bidirectional Converter?
Key companies in the market include ABB, Nidec Corporation, Sungrow Power Supply Co., Ltd., Johnson Controls, Parker Hannifin, Delta Electronics, HNAC Technology Co., Ltd., Destin Power Inc., Jiangsu Linyang Energy Co., Ltd., China Greatwall Technology Group Co., Ltd., Dynapower, Shanghai Sermatec Energy Technology Co., ltd., Shenzhen Kstar Science&Technology Co., Ltd., Soaring, TBEA, Shenzhen Sinexcel Electric Co., Ltd..
3. What are the main segments of the DC-AC Bidirectional Converter?
The market segments include Application, Types.
4. Can you provide details about the market size?
The market size is estimated to be USD 565.9 million as of 2022.
5. What are some drivers contributing to market growth?
N/A
6. What are the notable trends driving market growth?
N/A
7. Are there any restraints impacting market growth?
N/A
8. Can you provide examples of recent developments in the market?
N/A
9. What pricing options are available for accessing the report?
Pricing options include single-user, multi-user, and enterprise licenses priced at USD 3350.00, USD 5025.00, and USD 6700.00 respectively.
10. Is the market size provided in terms of value or volume?
The market size is provided in terms of value, measured in million and volume, measured in K.
11. Are there any specific market keywords associated with the report?
Yes, the market keyword associated with the report is "DC-AC Bidirectional Converter," which aids in identifying and referencing the specific market segment covered.
12. How do I determine which pricing option suits my needs best?
The pricing options vary based on user requirements and access needs. Individual users may opt for single-user licenses, while businesses requiring broader access may choose multi-user or enterprise licenses for cost-effective access to the report.
13. Are there any additional resources or data provided in the DC-AC Bidirectional Converter report?
While the report offers comprehensive insights, it's advisable to review the specific contents or supplementary materials provided to ascertain if additional resources or data are available.
14. How can I stay updated on further developments or reports in the DC-AC Bidirectional Converter?
To stay informed about further developments, trends, and reports in the DC-AC Bidirectional Converter, consider subscribing to industry newsletters, following relevant companies and organizations, or regularly checking reputable industry news sources and publications.
Methodology
Step 1 - Identification of Relevant Samples Size from Population Database


Step 2 - Approaches for Defining Global Market Size (Value, Volume* & Price*)

Note*: In applicable scenarios
Step 3 - Data Sources
Primary Research
- Web Analytics
- Survey Reports
- Research Institute
- Latest Research Reports
- Opinion Leaders
Secondary Research
- Annual Reports
- White Paper
- Latest Press Release
- Industry Association
- Paid Database
- Investor Presentations

Step 4 - Data Triangulation
Involves using different sources of information in order to increase the validity of a study
These sources are likely to be stakeholders in a program - participants, other researchers, program staff, other community members, and so on.
Then we put all data in single framework & apply various statistical tools to find out the dynamic on the market.
During the analysis stage, feedback from the stakeholder groups would be compared to determine areas of agreement as well as areas of divergence


