

Key Insights
The global cupcake box market is poised for substantial growth, with an estimated market size of approximately $1,850 million in 2025, projected to expand at a Compound Annual Growth Rate (CAGR) of around 6.5% through 2033. This robust expansion is primarily driven by the escalating demand for convenient and aesthetically pleasing packaging solutions for baked goods, particularly cupcakes, from both individual consumers and commercial entities. The increasing popularity of home baking and the rise of artisanal bakeries, coupled with the growing e-commerce sector for food products, are significant tailwinds. Furthermore, the use of cupcake boxes for gifting and special occasions, including birthdays, weddings, and corporate events, continues to fuel market penetration. Innovation in design, material sustainability, and enhanced product protection are key trends shaping the competitive landscape, as manufacturers strive to meet evolving consumer preferences and regulatory requirements for eco-friendly packaging.
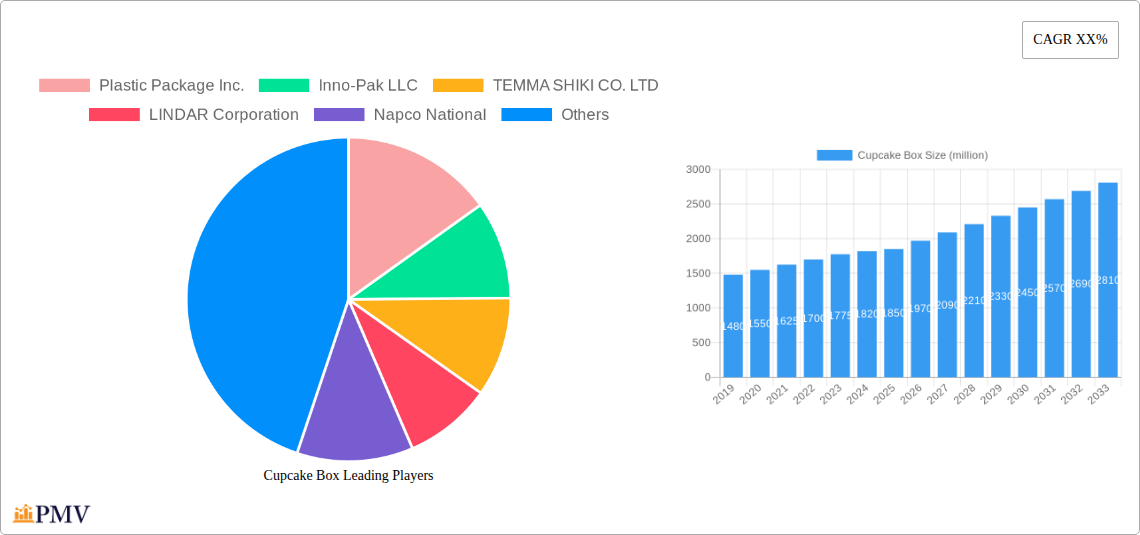
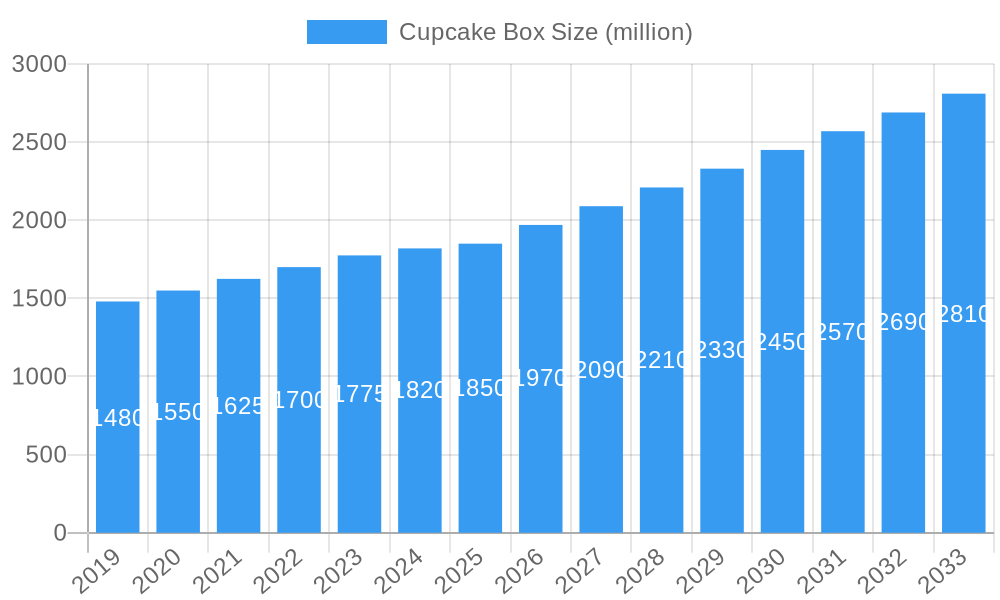
Cupcake Box Market Size (In Billion)
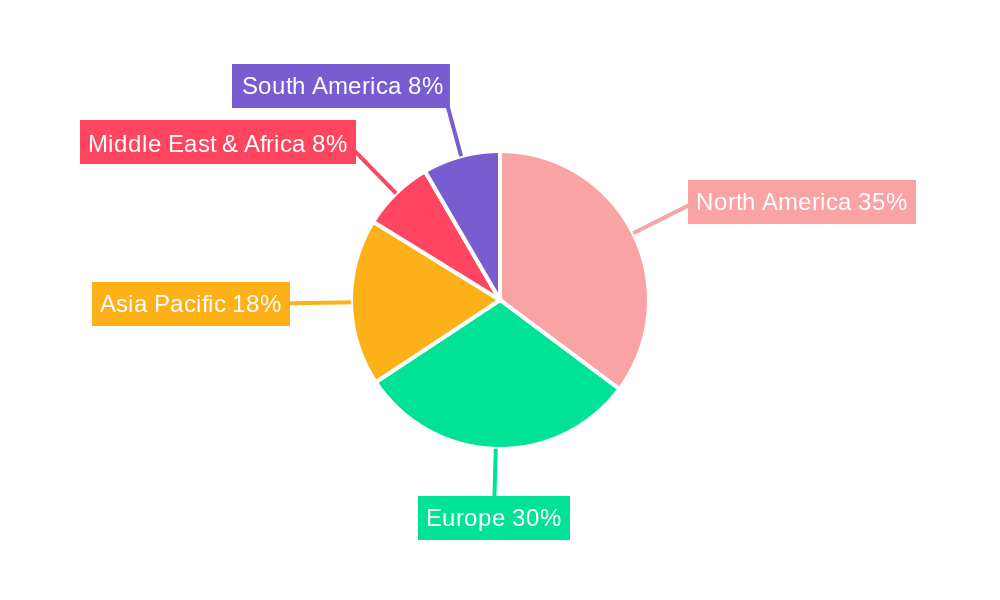
The market is segmented by application and type. The 'Restaurant' segment is expected to dominate, driven by the high volume of cupcake sales in food service establishments. The 'Bakery' segment also represents a significant share, with independent and chain bakeries relying on these boxes for daily operations and special orders. In terms of material types, 'Paper and Paperboard' is anticipated to hold the largest market share, owing to its biodegradability, cost-effectiveness, and extensive design possibilities. However, 'Plastic' packaging is also witnessing steady demand, particularly where enhanced durability and visibility are paramount. Geographically, North America currently leads the market, followed closely by Europe, both characterized by well-established food industries and high consumer spending on confectionery. Asia Pacific is emerging as a high-growth region, propelled by rapid urbanization, a burgeoning middle class, and an increasing adoption of Western-style confectionery trends. Key players such as Graphic Packaging International LLC, Smurfit Kappa Group plc, and Dart Container Corporation are actively investing in research and development to offer innovative and sustainable packaging solutions.
Cupcake Box Company Market Share
This comprehensive report delivers an unparalleled deep dive into the global Cupcake Box market, providing critical insights for stakeholders. Spanning a detailed study period from 2019 to 2033, with a robust analysis of the base year 2025, estimated year 2025, and an extensive forecast period from 2025 to 2033, this report is your definitive guide. We meticulously examine historical trends from 2019 to 2024, offering a granular understanding of past performance and market evolution. Designed for immediate use without modification, this report leverages high-ranking keywords to maximize search visibility and engage industry professionals across the food packaging, bakery, and restaurant sectors.
Cupcake Box Market Structure & Competitive Dynamics
The Cupcake Box market exhibits a moderately concentrated structure, with key players like Plastic Package Inc., Inno-Pak LLC, and TEMMA SHIKI CO. LTD holding significant market share, estimated at approximately 15-20% combined. The innovation ecosystem is driven by advancements in sustainable materials and smart packaging solutions. Regulatory frameworks primarily focus on food safety standards and environmental compliance, influencing material choices and manufacturing processes. Product substitutes, such as general food containers and reusable packaging, represent a minor threat due to the specialized design and branding appeal of cupcake boxes. End-user trends lean towards eco-friendly, aesthetically pleasing, and convenient packaging options, driving demand for innovative designs. Mergers and acquisitions (M&A) activity is moderate, with an estimated deal value of over $50 million in the past two years, consolidating market share and expanding product portfolios. For instance, strategic acquisitions by companies like Graphic Packaging International LLC are reshaping the competitive landscape. The increasing demand for custom-printed and branded cupcake boxes is a significant driver of competitive differentiation, encouraging companies to invest in advanced printing technologies and design services. The market's evolution is also influenced by the increasing digitalization of the food industry, leading to a greater emphasis on e-commerce-friendly packaging solutions.
Cupcake Box Industry Trends & Insights
The Cupcake Box industry is experiencing robust growth, projected to witness a Compound Annual Growth Rate (CAGR) of approximately 5.8% throughout the forecast period (2025-2033). This expansion is fueled by several key market growth drivers, including the burgeoning bakery industry, the growing popularity of personalized and celebratory cakes, and the increasing demand for premium and aesthetically appealing food packaging solutions. Technological disruptions are playing a pivotal role, with a significant focus on the adoption of sustainable and biodegradable materials, such as recycled paperboard and compostable plastics. This trend is driven by heightened consumer awareness regarding environmental impact and stricter government regulations on single-use plastics. Consumer preferences are evolving rapidly, with a strong emphasis on visually appealing designs, branding opportunities, and functional features like secure closures and window displays for product visibility. The competitive dynamics are characterized by both established players and emerging innovators vying for market share through product differentiation, supply chain optimization, and strategic partnerships. Market penetration of innovative cupcake box designs, particularly those offering enhanced portability and eco-friendly attributes, is projected to increase by over 10% annually. The rise of e-commerce and food delivery services has also created new avenues for growth, necessitating durable and protective packaging solutions that can withstand transit stresses. Furthermore, the increasing demand for specialized cupcake boxes for events, gifting, and corporate promotions contributes significantly to market expansion. The shift towards health-conscious and artisanal baked goods also indirectly boosts the demand for premium packaging that aligns with the brand perception. The global market size is estimated to reach over $1.2 billion by 2028, indicating a substantial upward trajectory.
Dominant Markets & Segments in Cupcake Box
The Bakery segment stands out as the dominant force within the Cupcake Box market, driven by the sheer volume of cupcakes produced and sold globally. This segment is projected to command over 65% of the market share by 2028. Key drivers for this dominance include the constant demand for everyday treats, celebratory cakes, and the growing trend of artisanal bakeries offering unique and visually appealing cupcakes. Economic policies that support small and medium-sized enterprises (SMEs) in the food sector, alongside the expansion of retail bakery chains, further bolster this segment's growth.
Within the Types segmentation, Paper and Paperboard boxes are currently the leading category, accounting for an estimated 70% of the market. This dominance is attributed to their cost-effectiveness, recyclability, and ability to be easily customized with branding and attractive graphics. The growing preference for sustainable packaging solutions further solidifies the position of paper and paperboard. However, Plastic cupcake boxes are gaining traction, particularly in applications where enhanced durability and moisture resistance are paramount, such as for professional catering and high-volume retail.
Geographically, North America is expected to remain the dominant market, propelled by a strong bakery culture, high disposable incomes, and significant consumer spending on confectionery and baked goods. Countries like the United States and Canada exhibit a high market penetration rate for pre-packaged cupcakes and a strong demand for custom bakery packaging. The presence of major players such as Dart Container Corporation and Pactiv LLC within this region further strengthens its dominance.
Key Drivers for Bakery Segment Dominance:
- High volume sales of cupcakes for daily consumption and special occasions.
- Growth of artisanal and specialty bakeries.
- Consumer demand for visually appealing and branded packaging.
- Expansion of retail bakery outlets and confectionery chains.
Key Drivers for Paper and Paperboard Dominance:
- Cost-effectiveness and widespread availability.
- Environmental friendliness and recyclability.
- Excellent printability for branding and design.
- Versatility in design and construction.
Key Drivers for North America Dominance:
- Strong consumer demand for premium baked goods.
- High disposable income and spending on confectionery.
- Well-established bakery and retail infrastructure.
- Presence of major packaging manufacturers.
Cupcake Box Product Innovations
Product innovation in the Cupcake Box market is primarily focused on enhancing sustainability, functionality, and visual appeal. Companies are developing eco-friendly alternatives using recycled materials, biodegradable plastics, and plant-based inks. Innovations include integrated handles for easy transport, window designs that offer prominent product display, and secure locking mechanisms to prevent damage during shipping. Advanced printing techniques are enabling vibrant branding and intricate designs, catering to the growing demand for personalized and premium packaging. These developments offer competitive advantages by meeting evolving consumer preferences and regulatory requirements for greener packaging solutions.
Report Segmentation & Scope
This report meticulously segments the Cupcake Box market across key parameters to provide a granular understanding of its dynamics. The Application segmentation includes Restaurant, Bakery, and Others, encompassing food service establishments, retail bakeries, and specialized event catering, respectively. The Types segmentation focuses on Paper and Paperboard and Plastic materials, highlighting the distinct properties and market shares of each. Growth projections, market sizes, and competitive dynamics will be analyzed for each sub-segment, offering a comprehensive view of market opportunities and challenges.
Key Drivers of Cupcake Box Growth
The Cupcake Box market is propelled by several synergistic growth drivers. The escalating demand for convenient and attractive food packaging, fueled by the expanding bakery industry and the rise of e-commerce food delivery, is a primary catalyst. Technological advancements in sustainable materials, such as compostable and recycled paperboard, are meeting consumer and regulatory demands for eco-friendly solutions. Furthermore, the increasing trend of personalized gifting and celebratory occasions, where cupcakes are a popular choice, directly boosts the need for specialized and aesthetically pleasing cupcake boxes. Economic factors like rising disposable incomes in emerging markets also contribute to increased consumer spending on premium baked goods and their packaging.
Challenges in the Cupcake Box Sector
Despite its growth, the Cupcake Box sector faces several challenges. Fluctuations in raw material costs, particularly for paper pulp and plastic resins, can impact profit margins and pricing strategies. Stringent environmental regulations regarding single-use plastics, while driving innovation, also present compliance hurdles and potential cost increases for manufacturers. Intense competition within the packaging industry, coupled with the presence of numerous small-scale manufacturers, can lead to price wars and pressure on market leaders. Supply chain disruptions, as witnessed in recent global events, can affect the availability and timely delivery of essential raw materials, impacting production schedules and overall market stability.
Leading Players in the Cupcake Box Market
- Plastic Package Inc.
- Inno-Pak LLC
- TEMMA SHIKI CO. LTD
- LINDAR Corporation
- Napco National
- Premier Packaging Solutions
- Dart Container Corporation
- Pactiv LLC
- ClipnBox
- Robinson Plc
- McLaren Packaging Ltd
- Graphic Packaging International LLC
- Smurfit Kappa Group plc
- Alefh Sp z o.o. Sp. K
- CoPack Inc
- Obtech Corporation (M) Sdn Bhd
- Veerkarton BV
- ZEE Packaging
- Taylor Box Company
- Europack
Key Developments in Cupcake Box Sector
- 2024 Q1: Graphic Packaging International LLC launched a new line of fully recyclable and compostable cupcake boxes made from plant-based materials, enhancing their sustainable product portfolio.
- 2023 Q4: Inno-Pak LLC announced a strategic partnership with a major bakery chain to supply customized, eco-friendly cupcake packaging, expanding its market reach.
- 2023 Q3: Smurfit Kappa Group plc invested in advanced printing technology to offer enhanced branding and customization options for their paperboard-based cupcake boxes, catering to premium market demands.
- 2023 Q2: Plastic Package Inc. acquired a smaller competitor specializing in clear plastic cupcake containers, strengthening its position in the transparent packaging segment.
- 2022 Q4: LINDAR Corporation introduced innovative, stackable cupcake boxes with improved ventilation, designed to maintain freshness during transit and storage.
Strategic Cupcake Box Market Outlook
The strategic outlook for the Cupcake Box market is highly positive, driven by sustained consumer demand for visually appealing and convenient baked goods. Growth accelerators include the increasing adoption of sustainable packaging solutions, the expansion of the direct-to-consumer bakery model, and the continuous innovation in design and functionality. Opportunities lie in targeting niche markets, such as gluten-free or vegan bakeries, and in developing smart packaging solutions with integrated branding and traceability features. Strategic collaborations, technological investments in eco-friendly materials, and a focus on customization will be crucial for players to capitalize on future market potential and maintain a competitive edge in this dynamic sector.
Cupcake Box Segmentation
-
1. Application
- 1.1. Restaurant
- 1.2. Bakery
- 1.3. Others
-
2. Types
- 2.1. Paper and Paperboard
- 2.2. Plastic
Cupcake Box Segmentation By Geography
-
1. North America
- 1.1. United States
- 1.2. Canada
- 1.3. Mexico
-
2. South America
- 2.1. Brazil
- 2.2. Argentina
- 2.3. Rest of South America
-
3. Europe
- 3.1. United Kingdom
- 3.2. Germany
- 3.3. France
- 3.4. Italy
- 3.5. Spain
- 3.6. Russia
- 3.7. Benelux
- 3.8. Nordics
- 3.9. Rest of Europe
-
4. Middle East & Africa
- 4.1. Turkey
- 4.2. Israel
- 4.3. GCC
- 4.4. North Africa
- 4.5. South Africa
- 4.6. Rest of Middle East & Africa
-
5. Asia Pacific
- 5.1. China
- 5.2. India
- 5.3. Japan
- 5.4. South Korea
- 5.5. ASEAN
- 5.6. Oceania
- 5.7. Rest of Asia Pacific
Cupcake Box Regional Market Share
Geographic Coverage of Cupcake Box
Cupcake Box REPORT HIGHLIGHTS
| Aspects | Details |
|---|---|
| Study Period | 2020-2034 |
| Base Year | 2025 |
| Estimated Year | 2026 |
| Forecast Period | 2026-2034 |
| Historical Period | 2020-2025 |
| Growth Rate | CAGR of 3.7% from 2020-2034 |
| Segmentation |
|
Table of Contents
- 1. Introduction
- 1.1. Research Scope
- 1.2. Market Segmentation
- 1.3. Research Methodology
- 1.4. Definitions and Assumptions
- 2. Executive Summary
- 2.1. Introduction
- 3. Market Dynamics
- 3.1. Introduction
- 3.2. Market Drivers
- 3.3. Market Restrains
- 3.4. Market Trends
- 4. Market Factor Analysis
- 4.1. Porters Five Forces
- 4.2. Supply/Value Chain
- 4.3. PESTEL analysis
- 4.4. Market Entropy
- 4.5. Patent/Trademark Analysis
- 5. Global Cupcake Box Analysis, Insights and Forecast, 2020-2032
- 5.1. Market Analysis, Insights and Forecast - by Application
- 5.1.1. Restaurant
- 5.1.2. Bakery
- 5.1.3. Others
- 5.2. Market Analysis, Insights and Forecast - by Types
- 5.2.1. Paper and Paperboard
- 5.2.2. Plastic
- 5.3. Market Analysis, Insights and Forecast - by Region
- 5.3.1. North America
- 5.3.2. South America
- 5.3.3. Europe
- 5.3.4. Middle East & Africa
- 5.3.5. Asia Pacific
- 5.1. Market Analysis, Insights and Forecast - by Application
- 6. North America Cupcake Box Analysis, Insights and Forecast, 2020-2032
- 6.1. Market Analysis, Insights and Forecast - by Application
- 6.1.1. Restaurant
- 6.1.2. Bakery
- 6.1.3. Others
- 6.2. Market Analysis, Insights and Forecast - by Types
- 6.2.1. Paper and Paperboard
- 6.2.2. Plastic
- 6.1. Market Analysis, Insights and Forecast - by Application
- 7. South America Cupcake Box Analysis, Insights and Forecast, 2020-2032
- 7.1. Market Analysis, Insights and Forecast - by Application
- 7.1.1. Restaurant
- 7.1.2. Bakery
- 7.1.3. Others
- 7.2. Market Analysis, Insights and Forecast - by Types
- 7.2.1. Paper and Paperboard
- 7.2.2. Plastic
- 7.1. Market Analysis, Insights and Forecast - by Application
- 8. Europe Cupcake Box Analysis, Insights and Forecast, 2020-2032
- 8.1. Market Analysis, Insights and Forecast - by Application
- 8.1.1. Restaurant
- 8.1.2. Bakery
- 8.1.3. Others
- 8.2. Market Analysis, Insights and Forecast - by Types
- 8.2.1. Paper and Paperboard
- 8.2.2. Plastic
- 8.1. Market Analysis, Insights and Forecast - by Application
- 9. Middle East & Africa Cupcake Box Analysis, Insights and Forecast, 2020-2032
- 9.1. Market Analysis, Insights and Forecast - by Application
- 9.1.1. Restaurant
- 9.1.2. Bakery
- 9.1.3. Others
- 9.2. Market Analysis, Insights and Forecast - by Types
- 9.2.1. Paper and Paperboard
- 9.2.2. Plastic
- 9.1. Market Analysis, Insights and Forecast - by Application
- 10. Asia Pacific Cupcake Box Analysis, Insights and Forecast, 2020-2032
- 10.1. Market Analysis, Insights and Forecast - by Application
- 10.1.1. Restaurant
- 10.1.2. Bakery
- 10.1.3. Others
- 10.2. Market Analysis, Insights and Forecast - by Types
- 10.2.1. Paper and Paperboard
- 10.2.2. Plastic
- 10.1. Market Analysis, Insights and Forecast - by Application
- 11. Competitive Analysis
- 11.1. Global Market Share Analysis 2025
- 11.2. Company Profiles
- 11.2.1 Plastic Package Inc.
- 11.2.1.1. Overview
- 11.2.1.2. Products
- 11.2.1.3. SWOT Analysis
- 11.2.1.4. Recent Developments
- 11.2.1.5. Financials (Based on Availability)
- 11.2.2 Inno-Pak LLC
- 11.2.2.1. Overview
- 11.2.2.2. Products
- 11.2.2.3. SWOT Analysis
- 11.2.2.4. Recent Developments
- 11.2.2.5. Financials (Based on Availability)
- 11.2.3 TEMMA SHIKI CO. LTD
- 11.2.3.1. Overview
- 11.2.3.2. Products
- 11.2.3.3. SWOT Analysis
- 11.2.3.4. Recent Developments
- 11.2.3.5. Financials (Based on Availability)
- 11.2.4 LINDAR Corporation
- 11.2.4.1. Overview
- 11.2.4.2. Products
- 11.2.4.3. SWOT Analysis
- 11.2.4.4. Recent Developments
- 11.2.4.5. Financials (Based on Availability)
- 11.2.5 Napco National
- 11.2.5.1. Overview
- 11.2.5.2. Products
- 11.2.5.3. SWOT Analysis
- 11.2.5.4. Recent Developments
- 11.2.5.5. Financials (Based on Availability)
- 11.2.6 Premier Packaging Solutions
- 11.2.6.1. Overview
- 11.2.6.2. Products
- 11.2.6.3. SWOT Analysis
- 11.2.6.4. Recent Developments
- 11.2.6.5. Financials (Based on Availability)
- 11.2.7 Dart Container Corporation
- 11.2.7.1. Overview
- 11.2.7.2. Products
- 11.2.7.3. SWOT Analysis
- 11.2.7.4. Recent Developments
- 11.2.7.5. Financials (Based on Availability)
- 11.2.8 Pactiv LLC
- 11.2.8.1. Overview
- 11.2.8.2. Products
- 11.2.8.3. SWOT Analysis
- 11.2.8.4. Recent Developments
- 11.2.8.5. Financials (Based on Availability)
- 11.2.9 ClipnBox
- 11.2.9.1. Overview
- 11.2.9.2. Products
- 11.2.9.3. SWOT Analysis
- 11.2.9.4. Recent Developments
- 11.2.9.5. Financials (Based on Availability)
- 11.2.10 Robinson Plc
- 11.2.10.1. Overview
- 11.2.10.2. Products
- 11.2.10.3. SWOT Analysis
- 11.2.10.4. Recent Developments
- 11.2.10.5. Financials (Based on Availability)
- 11.2.11 McLaren Packaging Ltd
- 11.2.11.1. Overview
- 11.2.11.2. Products
- 11.2.11.3. SWOT Analysis
- 11.2.11.4. Recent Developments
- 11.2.11.5. Financials (Based on Availability)
- 11.2.12 Graphic Packaging International LLC
- 11.2.12.1. Overview
- 11.2.12.2. Products
- 11.2.12.3. SWOT Analysis
- 11.2.12.4. Recent Developments
- 11.2.12.5. Financials (Based on Availability)
- 11.2.13 Smurfit Kappa Group plc
- 11.2.13.1. Overview
- 11.2.13.2. Products
- 11.2.13.3. SWOT Analysis
- 11.2.13.4. Recent Developments
- 11.2.13.5. Financials (Based on Availability)
- 11.2.14 Alefh Sp z o.o. Sp. K
- 11.2.14.1. Overview
- 11.2.14.2. Products
- 11.2.14.3. SWOT Analysis
- 11.2.14.4. Recent Developments
- 11.2.14.5. Financials (Based on Availability)
- 11.2.15 CoPack Inc
- 11.2.15.1. Overview
- 11.2.15.2. Products
- 11.2.15.3. SWOT Analysis
- 11.2.15.4. Recent Developments
- 11.2.15.5. Financials (Based on Availability)
- 11.2.16 Obtech Corporation (M) Sdn Bhd
- 11.2.16.1. Overview
- 11.2.16.2. Products
- 11.2.16.3. SWOT Analysis
- 11.2.16.4. Recent Developments
- 11.2.16.5. Financials (Based on Availability)
- 11.2.17 Veerkarton BV
- 11.2.17.1. Overview
- 11.2.17.2. Products
- 11.2.17.3. SWOT Analysis
- 11.2.17.4. Recent Developments
- 11.2.17.5. Financials (Based on Availability)
- 11.2.18 ZEE Packaging
- 11.2.18.1. Overview
- 11.2.18.2. Products
- 11.2.18.3. SWOT Analysis
- 11.2.18.4. Recent Developments
- 11.2.18.5. Financials (Based on Availability)
- 11.2.19 Taylor Box Company
- 11.2.19.1. Overview
- 11.2.19.2. Products
- 11.2.19.3. SWOT Analysis
- 11.2.19.4. Recent Developments
- 11.2.19.5. Financials (Based on Availability)
- 11.2.20 Europack
- 11.2.20.1. Overview
- 11.2.20.2. Products
- 11.2.20.3. SWOT Analysis
- 11.2.20.4. Recent Developments
- 11.2.20.5. Financials (Based on Availability)
- 11.2.1 Plastic Package Inc.
List of Figures
- Figure 1: Global Cupcake Box Revenue Breakdown (undefined, %) by Region 2025 & 2033
- Figure 2: Global Cupcake Box Volume Breakdown (K, %) by Region 2025 & 2033
- Figure 3: North America Cupcake Box Revenue (undefined), by Application 2025 & 2033
- Figure 4: North America Cupcake Box Volume (K), by Application 2025 & 2033
- Figure 5: North America Cupcake Box Revenue Share (%), by Application 2025 & 2033
- Figure 6: North America Cupcake Box Volume Share (%), by Application 2025 & 2033
- Figure 7: North America Cupcake Box Revenue (undefined), by Types 2025 & 2033
- Figure 8: North America Cupcake Box Volume (K), by Types 2025 & 2033
- Figure 9: North America Cupcake Box Revenue Share (%), by Types 2025 & 2033
- Figure 10: North America Cupcake Box Volume Share (%), by Types 2025 & 2033
- Figure 11: North America Cupcake Box Revenue (undefined), by Country 2025 & 2033
- Figure 12: North America Cupcake Box Volume (K), by Country 2025 & 2033
- Figure 13: North America Cupcake Box Revenue Share (%), by Country 2025 & 2033
- Figure 14: North America Cupcake Box Volume Share (%), by Country 2025 & 2033
- Figure 15: South America Cupcake Box Revenue (undefined), by Application 2025 & 2033
- Figure 16: South America Cupcake Box Volume (K), by Application 2025 & 2033
- Figure 17: South America Cupcake Box Revenue Share (%), by Application 2025 & 2033
- Figure 18: South America Cupcake Box Volume Share (%), by Application 2025 & 2033
- Figure 19: South America Cupcake Box Revenue (undefined), by Types 2025 & 2033
- Figure 20: South America Cupcake Box Volume (K), by Types 2025 & 2033
- Figure 21: South America Cupcake Box Revenue Share (%), by Types 2025 & 2033
- Figure 22: South America Cupcake Box Volume Share (%), by Types 2025 & 2033
- Figure 23: South America Cupcake Box Revenue (undefined), by Country 2025 & 2033
- Figure 24: South America Cupcake Box Volume (K), by Country 2025 & 2033
- Figure 25: South America Cupcake Box Revenue Share (%), by Country 2025 & 2033
- Figure 26: South America Cupcake Box Volume Share (%), by Country 2025 & 2033
- Figure 27: Europe Cupcake Box Revenue (undefined), by Application 2025 & 2033
- Figure 28: Europe Cupcake Box Volume (K), by Application 2025 & 2033
- Figure 29: Europe Cupcake Box Revenue Share (%), by Application 2025 & 2033
- Figure 30: Europe Cupcake Box Volume Share (%), by Application 2025 & 2033
- Figure 31: Europe Cupcake Box Revenue (undefined), by Types 2025 & 2033
- Figure 32: Europe Cupcake Box Volume (K), by Types 2025 & 2033
- Figure 33: Europe Cupcake Box Revenue Share (%), by Types 2025 & 2033
- Figure 34: Europe Cupcake Box Volume Share (%), by Types 2025 & 2033
- Figure 35: Europe Cupcake Box Revenue (undefined), by Country 2025 & 2033
- Figure 36: Europe Cupcake Box Volume (K), by Country 2025 & 2033
- Figure 37: Europe Cupcake Box Revenue Share (%), by Country 2025 & 2033
- Figure 38: Europe Cupcake Box Volume Share (%), by Country 2025 & 2033
- Figure 39: Middle East & Africa Cupcake Box Revenue (undefined), by Application 2025 & 2033
- Figure 40: Middle East & Africa Cupcake Box Volume (K), by Application 2025 & 2033
- Figure 41: Middle East & Africa Cupcake Box Revenue Share (%), by Application 2025 & 2033
- Figure 42: Middle East & Africa Cupcake Box Volume Share (%), by Application 2025 & 2033
- Figure 43: Middle East & Africa Cupcake Box Revenue (undefined), by Types 2025 & 2033
- Figure 44: Middle East & Africa Cupcake Box Volume (K), by Types 2025 & 2033
- Figure 45: Middle East & Africa Cupcake Box Revenue Share (%), by Types 2025 & 2033
- Figure 46: Middle East & Africa Cupcake Box Volume Share (%), by Types 2025 & 2033
- Figure 47: Middle East & Africa Cupcake Box Revenue (undefined), by Country 2025 & 2033
- Figure 48: Middle East & Africa Cupcake Box Volume (K), by Country 2025 & 2033
- Figure 49: Middle East & Africa Cupcake Box Revenue Share (%), by Country 2025 & 2033
- Figure 50: Middle East & Africa Cupcake Box Volume Share (%), by Country 2025 & 2033
- Figure 51: Asia Pacific Cupcake Box Revenue (undefined), by Application 2025 & 2033
- Figure 52: Asia Pacific Cupcake Box Volume (K), by Application 2025 & 2033
- Figure 53: Asia Pacific Cupcake Box Revenue Share (%), by Application 2025 & 2033
- Figure 54: Asia Pacific Cupcake Box Volume Share (%), by Application 2025 & 2033
- Figure 55: Asia Pacific Cupcake Box Revenue (undefined), by Types 2025 & 2033
- Figure 56: Asia Pacific Cupcake Box Volume (K), by Types 2025 & 2033
- Figure 57: Asia Pacific Cupcake Box Revenue Share (%), by Types 2025 & 2033
- Figure 58: Asia Pacific Cupcake Box Volume Share (%), by Types 2025 & 2033
- Figure 59: Asia Pacific Cupcake Box Revenue (undefined), by Country 2025 & 2033
- Figure 60: Asia Pacific Cupcake Box Volume (K), by Country 2025 & 2033
- Figure 61: Asia Pacific Cupcake Box Revenue Share (%), by Country 2025 & 2033
- Figure 62: Asia Pacific Cupcake Box Volume Share (%), by Country 2025 & 2033
List of Tables
- Table 1: Global Cupcake Box Revenue undefined Forecast, by Application 2020 & 2033
- Table 2: Global Cupcake Box Volume K Forecast, by Application 2020 & 2033
- Table 3: Global Cupcake Box Revenue undefined Forecast, by Types 2020 & 2033
- Table 4: Global Cupcake Box Volume K Forecast, by Types 2020 & 2033
- Table 5: Global Cupcake Box Revenue undefined Forecast, by Region 2020 & 2033
- Table 6: Global Cupcake Box Volume K Forecast, by Region 2020 & 2033
- Table 7: Global Cupcake Box Revenue undefined Forecast, by Application 2020 & 2033
- Table 8: Global Cupcake Box Volume K Forecast, by Application 2020 & 2033
- Table 9: Global Cupcake Box Revenue undefined Forecast, by Types 2020 & 2033
- Table 10: Global Cupcake Box Volume K Forecast, by Types 2020 & 2033
- Table 11: Global Cupcake Box Revenue undefined Forecast, by Country 2020 & 2033
- Table 12: Global Cupcake Box Volume K Forecast, by Country 2020 & 2033
- Table 13: United States Cupcake Box Revenue (undefined) Forecast, by Application 2020 & 2033
- Table 14: United States Cupcake Box Volume (K) Forecast, by Application 2020 & 2033
- Table 15: Canada Cupcake Box Revenue (undefined) Forecast, by Application 2020 & 2033
- Table 16: Canada Cupcake Box Volume (K) Forecast, by Application 2020 & 2033
- Table 17: Mexico Cupcake Box Revenue (undefined) Forecast, by Application 2020 & 2033
- Table 18: Mexico Cupcake Box Volume (K) Forecast, by Application 2020 & 2033
- Table 19: Global Cupcake Box Revenue undefined Forecast, by Application 2020 & 2033
- Table 20: Global Cupcake Box Volume K Forecast, by Application 2020 & 2033
- Table 21: Global Cupcake Box Revenue undefined Forecast, by Types 2020 & 2033
- Table 22: Global Cupcake Box Volume K Forecast, by Types 2020 & 2033
- Table 23: Global Cupcake Box Revenue undefined Forecast, by Country 2020 & 2033
- Table 24: Global Cupcake Box Volume K Forecast, by Country 2020 & 2033
- Table 25: Brazil Cupcake Box Revenue (undefined) Forecast, by Application 2020 & 2033
- Table 26: Brazil Cupcake Box Volume (K) Forecast, by Application 2020 & 2033
- Table 27: Argentina Cupcake Box Revenue (undefined) Forecast, by Application 2020 & 2033
- Table 28: Argentina Cupcake Box Volume (K) Forecast, by Application 2020 & 2033
- Table 29: Rest of South America Cupcake Box Revenue (undefined) Forecast, by Application 2020 & 2033
- Table 30: Rest of South America Cupcake Box Volume (K) Forecast, by Application 2020 & 2033
- Table 31: Global Cupcake Box Revenue undefined Forecast, by Application 2020 & 2033
- Table 32: Global Cupcake Box Volume K Forecast, by Application 2020 & 2033
- Table 33: Global Cupcake Box Revenue undefined Forecast, by Types 2020 & 2033
- Table 34: Global Cupcake Box Volume K Forecast, by Types 2020 & 2033
- Table 35: Global Cupcake Box Revenue undefined Forecast, by Country 2020 & 2033
- Table 36: Global Cupcake Box Volume K Forecast, by Country 2020 & 2033
- Table 37: United Kingdom Cupcake Box Revenue (undefined) Forecast, by Application 2020 & 2033
- Table 38: United Kingdom Cupcake Box Volume (K) Forecast, by Application 2020 & 2033
- Table 39: Germany Cupcake Box Revenue (undefined) Forecast, by Application 2020 & 2033
- Table 40: Germany Cupcake Box Volume (K) Forecast, by Application 2020 & 2033
- Table 41: France Cupcake Box Revenue (undefined) Forecast, by Application 2020 & 2033
- Table 42: France Cupcake Box Volume (K) Forecast, by Application 2020 & 2033
- Table 43: Italy Cupcake Box Revenue (undefined) Forecast, by Application 2020 & 2033
- Table 44: Italy Cupcake Box Volume (K) Forecast, by Application 2020 & 2033
- Table 45: Spain Cupcake Box Revenue (undefined) Forecast, by Application 2020 & 2033
- Table 46: Spain Cupcake Box Volume (K) Forecast, by Application 2020 & 2033
- Table 47: Russia Cupcake Box Revenue (undefined) Forecast, by Application 2020 & 2033
- Table 48: Russia Cupcake Box Volume (K) Forecast, by Application 2020 & 2033
- Table 49: Benelux Cupcake Box Revenue (undefined) Forecast, by Application 2020 & 2033
- Table 50: Benelux Cupcake Box Volume (K) Forecast, by Application 2020 & 2033
- Table 51: Nordics Cupcake Box Revenue (undefined) Forecast, by Application 2020 & 2033
- Table 52: Nordics Cupcake Box Volume (K) Forecast, by Application 2020 & 2033
- Table 53: Rest of Europe Cupcake Box Revenue (undefined) Forecast, by Application 2020 & 2033
- Table 54: Rest of Europe Cupcake Box Volume (K) Forecast, by Application 2020 & 2033
- Table 55: Global Cupcake Box Revenue undefined Forecast, by Application 2020 & 2033
- Table 56: Global Cupcake Box Volume K Forecast, by Application 2020 & 2033
- Table 57: Global Cupcake Box Revenue undefined Forecast, by Types 2020 & 2033
- Table 58: Global Cupcake Box Volume K Forecast, by Types 2020 & 2033
- Table 59: Global Cupcake Box Revenue undefined Forecast, by Country 2020 & 2033
- Table 60: Global Cupcake Box Volume K Forecast, by Country 2020 & 2033
- Table 61: Turkey Cupcake Box Revenue (undefined) Forecast, by Application 2020 & 2033
- Table 62: Turkey Cupcake Box Volume (K) Forecast, by Application 2020 & 2033
- Table 63: Israel Cupcake Box Revenue (undefined) Forecast, by Application 2020 & 2033
- Table 64: Israel Cupcake Box Volume (K) Forecast, by Application 2020 & 2033
- Table 65: GCC Cupcake Box Revenue (undefined) Forecast, by Application 2020 & 2033
- Table 66: GCC Cupcake Box Volume (K) Forecast, by Application 2020 & 2033
- Table 67: North Africa Cupcake Box Revenue (undefined) Forecast, by Application 2020 & 2033
- Table 68: North Africa Cupcake Box Volume (K) Forecast, by Application 2020 & 2033
- Table 69: South Africa Cupcake Box Revenue (undefined) Forecast, by Application 2020 & 2033
- Table 70: South Africa Cupcake Box Volume (K) Forecast, by Application 2020 & 2033
- Table 71: Rest of Middle East & Africa Cupcake Box Revenue (undefined) Forecast, by Application 2020 & 2033
- Table 72: Rest of Middle East & Africa Cupcake Box Volume (K) Forecast, by Application 2020 & 2033
- Table 73: Global Cupcake Box Revenue undefined Forecast, by Application 2020 & 2033
- Table 74: Global Cupcake Box Volume K Forecast, by Application 2020 & 2033
- Table 75: Global Cupcake Box Revenue undefined Forecast, by Types 2020 & 2033
- Table 76: Global Cupcake Box Volume K Forecast, by Types 2020 & 2033
- Table 77: Global Cupcake Box Revenue undefined Forecast, by Country 2020 & 2033
- Table 78: Global Cupcake Box Volume K Forecast, by Country 2020 & 2033
- Table 79: China Cupcake Box Revenue (undefined) Forecast, by Application 2020 & 2033
- Table 80: China Cupcake Box Volume (K) Forecast, by Application 2020 & 2033
- Table 81: India Cupcake Box Revenue (undefined) Forecast, by Application 2020 & 2033
- Table 82: India Cupcake Box Volume (K) Forecast, by Application 2020 & 2033
- Table 83: Japan Cupcake Box Revenue (undefined) Forecast, by Application 2020 & 2033
- Table 84: Japan Cupcake Box Volume (K) Forecast, by Application 2020 & 2033
- Table 85: South Korea Cupcake Box Revenue (undefined) Forecast, by Application 2020 & 2033
- Table 86: South Korea Cupcake Box Volume (K) Forecast, by Application 2020 & 2033
- Table 87: ASEAN Cupcake Box Revenue (undefined) Forecast, by Application 2020 & 2033
- Table 88: ASEAN Cupcake Box Volume (K) Forecast, by Application 2020 & 2033
- Table 89: Oceania Cupcake Box Revenue (undefined) Forecast, by Application 2020 & 2033
- Table 90: Oceania Cupcake Box Volume (K) Forecast, by Application 2020 & 2033
- Table 91: Rest of Asia Pacific Cupcake Box Revenue (undefined) Forecast, by Application 2020 & 2033
- Table 92: Rest of Asia Pacific Cupcake Box Volume (K) Forecast, by Application 2020 & 2033
Frequently Asked Questions
1. What is the projected Compound Annual Growth Rate (CAGR) of the Cupcake Box?
The projected CAGR is approximately 3.7%.
2. Which companies are prominent players in the Cupcake Box?
Key companies in the market include Plastic Package Inc., Inno-Pak LLC, TEMMA SHIKI CO. LTD, LINDAR Corporation, Napco National, Premier Packaging Solutions, Dart Container Corporation, Pactiv LLC, ClipnBox, Robinson Plc, McLaren Packaging Ltd, Graphic Packaging International LLC, Smurfit Kappa Group plc, Alefh Sp z o.o. Sp. K, CoPack Inc, Obtech Corporation (M) Sdn Bhd, Veerkarton BV, ZEE Packaging, Taylor Box Company, Europack.
3. What are the main segments of the Cupcake Box?
The market segments include Application, Types.
4. Can you provide details about the market size?
The market size is estimated to be USD XXX N/A as of 2022.
5. What are some drivers contributing to market growth?
N/A
6. What are the notable trends driving market growth?
N/A
7. Are there any restraints impacting market growth?
N/A
8. Can you provide examples of recent developments in the market?
N/A
9. What pricing options are available for accessing the report?
Pricing options include single-user, multi-user, and enterprise licenses priced at USD 4350.00, USD 6525.00, and USD 8700.00 respectively.
10. Is the market size provided in terms of value or volume?
The market size is provided in terms of value, measured in N/A and volume, measured in K.
11. Are there any specific market keywords associated with the report?
Yes, the market keyword associated with the report is "Cupcake Box," which aids in identifying and referencing the specific market segment covered.
12. How do I determine which pricing option suits my needs best?
The pricing options vary based on user requirements and access needs. Individual users may opt for single-user licenses, while businesses requiring broader access may choose multi-user or enterprise licenses for cost-effective access to the report.
13. Are there any additional resources or data provided in the Cupcake Box report?
While the report offers comprehensive insights, it's advisable to review the specific contents or supplementary materials provided to ascertain if additional resources or data are available.
14. How can I stay updated on further developments or reports in the Cupcake Box?
To stay informed about further developments, trends, and reports in the Cupcake Box, consider subscribing to industry newsletters, following relevant companies and organizations, or regularly checking reputable industry news sources and publications.
Methodology
Step 1 - Identification of Relevant Samples Size from Population Database


Step 2 - Approaches for Defining Global Market Size (Value, Volume* & Price*)

Note*: In applicable scenarios
Step 3 - Data Sources
Primary Research
- Web Analytics
- Survey Reports
- Research Institute
- Latest Research Reports
- Opinion Leaders
Secondary Research
- Annual Reports
- White Paper
- Latest Press Release
- Industry Association
- Paid Database
- Investor Presentations

Step 4 - Data Triangulation
Involves using different sources of information in order to increase the validity of a study
These sources are likely to be stakeholders in a program - participants, other researchers, program staff, other community members, and so on.
Then we put all data in single framework & apply various statistical tools to find out the dynamic on the market.
During the analysis stage, feedback from the stakeholder groups would be compared to determine areas of agreement as well as areas of divergence