
Key Insights
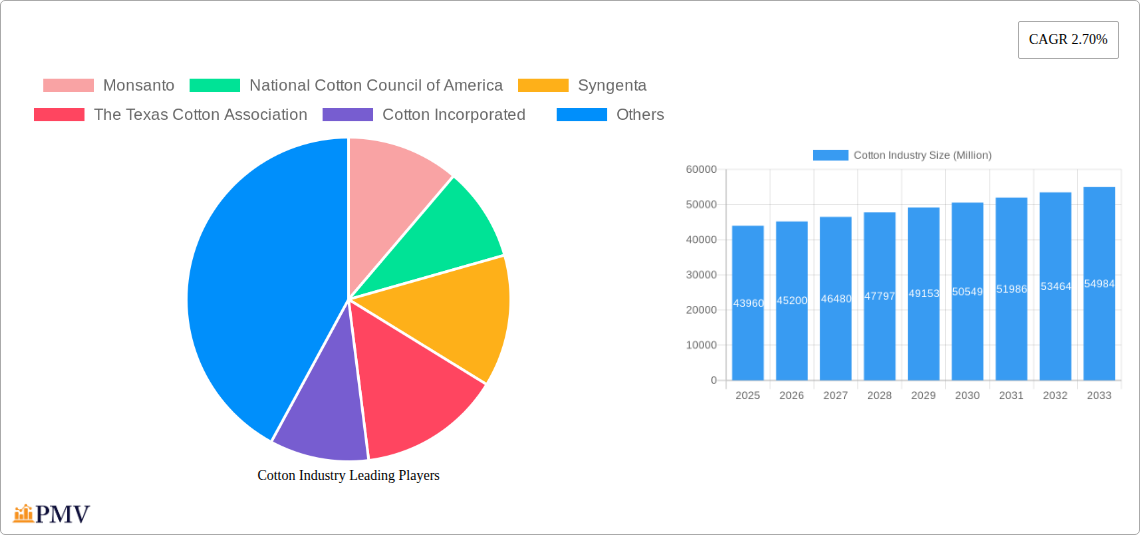
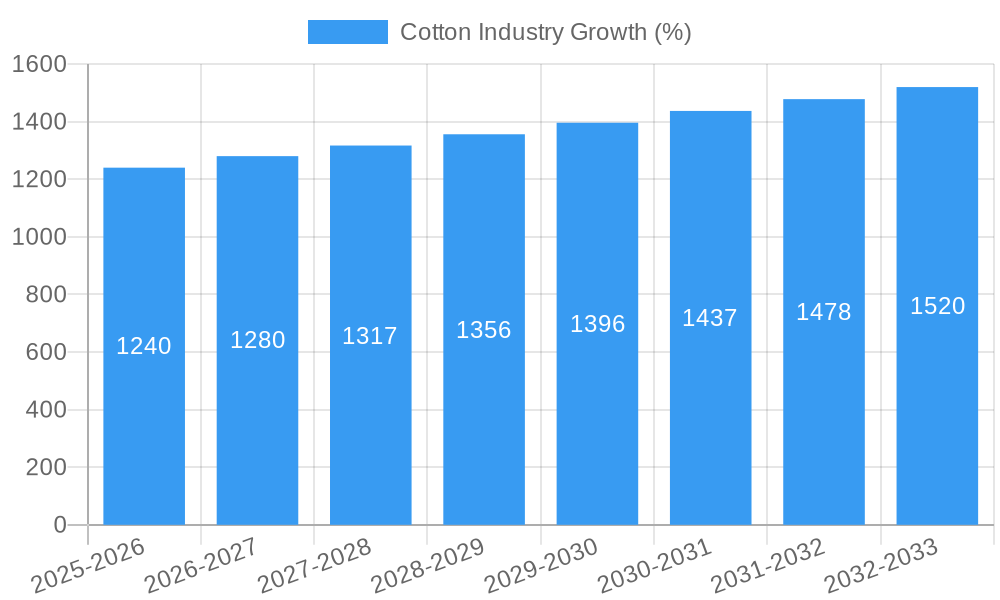
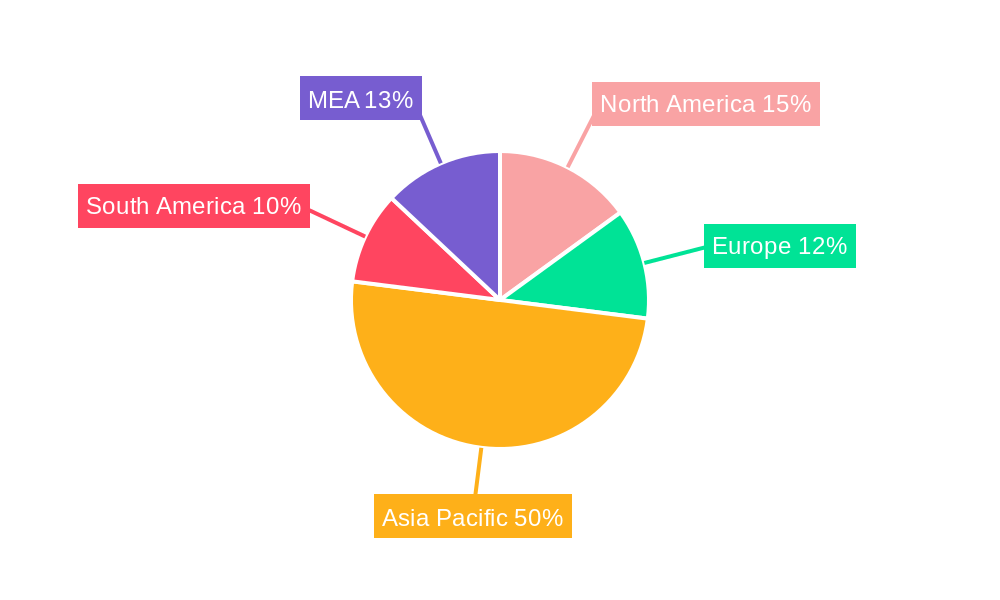
The global cotton industry, valued at $43.96 billion in 2025, is projected to experience steady growth, with a Compound Annual Growth Rate (CAGR) of 2.70% from 2025 to 2033. This growth is driven by several factors. Increasing demand for apparel, particularly in developing economies experiencing rising disposable incomes, fuels significant consumption. The home textile sector also contributes substantially, with cotton's softness and breathability remaining highly desirable. Furthermore, advancements in cotton farming techniques, such as improved seed varieties and water-efficient irrigation, are enhancing productivity and sustainability, counteracting some of the restraints. However, the industry faces challenges including fluctuating cotton prices influenced by global weather patterns and geopolitical events, competition from synthetic fibers like polyester, and growing concerns regarding the environmental impact of cotton production, particularly water usage and pesticide application. The industry is actively addressing these concerns through initiatives promoting sustainable cotton farming practices and the development of more environmentally friendly pesticides. Market segmentation reveals a preference for longer staple cotton lengths in higher-grade apparel, while shorter staples find applications in lower-priced textiles and industrial uses. Regional analysis indicates strong market presence in Asia-Pacific, driven by China and India's textile manufacturing hubs, while North America and Europe maintain significant consumption levels.
The cotton industry's future hinges on balancing supply and demand, mitigating environmental concerns, and adapting to changing consumer preferences. Innovation in textile processing and the development of high-value cotton products are crucial for maintaining market competitiveness. The increasing focus on sustainable and ethically sourced cotton presents opportunities for businesses prioritizing transparency and environmental responsibility. This evolving landscape necessitates strategic adaptations by both producers and consumers to ensure the continued success of the cotton industry in the long term. The industry's segmentation by fiber length (short, medium, long staple), grade (SLM, M, SM), color (white, colored), and end-use (apparel, home textiles, industrial) allows for tailored strategies to address specific market segments and optimize resource allocation.
Comprehensive Cotton Industry Report: 2019-2033
This in-depth report provides a comprehensive analysis of the global cotton industry, encompassing market structure, competitive dynamics, key trends, and future growth prospects. The study period covers 2019-2033, with a base year of 2025 and a forecast period of 2025-2033. The report offers actionable insights for industry stakeholders, including producers, processors, traders, retailers, and investors. Valuations are presented in Millions.
Cotton Industry Market Structure & Competitive Dynamics
This section analyzes the cotton industry's market concentration, revealing the dominance of key players like Monsanto, Syngenta, and Bayer CropScience. We examine innovation ecosystems, exploring collaborations between companies like Cotton Incorporated and research institutions. The regulatory landscape's impact, including trade policies and environmental regulations, is also assessed. The report details the dynamics of product substitutes (e.g., synthetic fibers) and end-user trends influencing demand across apparel, home textiles, and industrial applications. Finally, we analyze M&A activities within the cotton industry, quantifying deal values (xx Million) and their impact on market share distribution. Key metrics include market share percentages for leading players and an overview of significant M&A deals during the historical period (2019-2024). For example, the impact of recent mergers between xx company and yy company is assessed in terms of xx Million market share acquisition.
Cotton Industry Industry Trends & Insights
This section delves into the major trends shaping the cotton industry. We analyze market growth drivers, such as increasing global textile demand and rising disposable incomes in developing economies. The report also examines technological disruptions, including advancements in cotton breeding (e.g., genetically modified (GM) cotton), precision agriculture, and improved ginning technologies. Consumer preferences toward sustainable and ethically sourced cotton are also analyzed, including the growth of organic cotton. The competitive dynamics within the industry are explored, examining factors such as pricing strategies, supply chain management, and brand positioning. The report provides specific metrics, including the Compound Annual Growth Rate (CAGR) projected for the forecast period (xx%) and market penetration rates for various cotton types.
Dominant Markets & Segments in Cotton Industry
This section identifies the leading regions, countries, and market segments within the cotton industry. Detailed analysis considers fiber length (short-staple, medium-staple, long-staple), grade (Strict Low Middling (SLM), Middling (M), Strict Middling (SM)), color (white, colored), and end-use applications (apparel, home textiles, industrial applications).
- Key Drivers:
- Favorable economic policies supporting cotton production.
- Robust infrastructure facilitating efficient processing and transportation.
- Strong consumer demand in key regions.
- Government support programs.
The dominance of specific regions and segments is discussed, highlighting the factors driving their success. For instance, the report may highlight India’s prominence in short-staple cotton production, driven by its large land area and favorable climatic conditions. Similarly, the high demand for long-staple cotton in premium apparel segments may be highlighted, explaining its market share. Specific market size estimations (in Millions) for each segment will be provided.
Cotton Industry Product Innovations
This section summarizes recent product developments and advancements in cotton technology. The focus lies on innovations improving fiber quality, yield, and sustainability. Examples include genetically modified (GM) cotton varieties offering pest resistance and enhanced fiber properties, along with the development of organic cotton varieties. These innovations are analyzed for their competitive advantages and market fit.
Report Segmentation & Scope
This report segments the cotton industry based on fiber length, grade, color, and end-use. Each segment receives detailed analysis, including growth projections, market sizes (in Millions), and competitive dynamics.
- Fiber Length: Short-staple, medium-staple, and long-staple cotton segments are analyzed based on their respective market sizes and growth rates.
- Grade: Analysis covers SLM, M, and SM grades, assessing their pricing and demand variations.
- Color: White and colored cotton segments are examined, focusing on their application-specific demand.
- End-Use: Apparel, home textiles, and industrial applications segments are explored, analyzing their contributions to overall market value.
Key Drivers of Cotton Industry Growth
The growth of the cotton industry is driven by several key factors. Increasing global population and rising disposable incomes fuel demand for textiles, leading to higher cotton consumption. Technological advancements in cotton farming, processing, and manufacturing enhance productivity and quality. Favorable government policies and trade agreements also stimulate industry expansion. Furthermore, innovations in sustainable and organic cotton production cater to growing consumer preferences for eco-friendly products.
Challenges in the Cotton Industry Sector
The cotton industry faces several challenges. Fluctuating cotton prices impact profitability, creating uncertainty for farmers and processors. Environmental concerns surrounding pesticide use and water consumption require sustainable farming practices. Competition from synthetic fibers and other natural fibers influences market share. Supply chain disruptions can also affect production and distribution efficiency. Finally, regulatory hurdles and trade restrictions impact international trade.
Leading Players in the Cotton Industry Market
- Monsanto
- National Cotton Council of America
- Syngenta
- The Texas Cotton Association
- Cotton Incorporated
- International Cotton Association
- Bayer CropScience
Key Developments in Cotton Industry Sector
- September 2022: Two new organic cotton varieties became available to Indian farmers, boosting sustainable cotton production.
- August 2022: Several major apparel brands joined the Organic Cotton Accelerator (OCA), signaling increased industry commitment to sustainable practices.
- March 2022: Armor seed company launched new cotton varieties with improved seed size, vigor, and fiber quality, enhancing yields and quality.
Strategic Cotton Industry Market Outlook
The cotton industry is poised for continued growth, driven by increasing textile demand and innovations in sustainable production. Strategic opportunities exist in developing high-value cotton varieties, optimizing supply chains, and promoting sustainable farming practices. Expanding into new markets and catering to specific niche applications also offer significant potential. The industry’s future success hinges on adapting to changing consumer preferences and addressing environmental concerns. The global market is projected to reach xx Million by 2033.
Cotton Industry Segmentation
- 1. Production Analysis
- 2. Consumption Analysis
- 3. Import Market Analysis (Value & Volume)
- 4. Export Market Analysis (Value & Volume)
- 5. Price Trend Analysis
Cotton Industry Segmentation By Geography
-
1. North America
- 1.1. United States
- 1.2. Canada
- 1.3. Mexico
-
2. Europe
- 2.1. Germany
- 2.2. France
- 2.3. Russia
- 2.4. Greece
- 2.5. Italy
-
3. Asia Pacific
- 3.1. China
- 3.2. India
- 3.3. Australia
- 3.4. Pakistan
- 3.5. Bangladesh
-
4. South America
- 4.1. Brazil
- 4.2. Argentina
- 5. Middle East
-
6. South Africa
- 6.1. Turkey
- 6.2. Egypt
Cotton Industry REPORT HIGHLIGHTS
| Aspects | Details |
|---|---|
| Study Period | 2019-2033 |
| Base Year | 2024 |
| Estimated Year | 2025 |
| Forecast Period | 2025-2033 |
| Historical Period | 2019-2024 |
| Growth Rate | CAGR of 2.70% from 2019-2033 |
| Segmentation |
|
Table of Contents
- 1. Introduction
- 1.1. Research Scope
- 1.2. Market Segmentation
- 1.3. Research Methodology
- 1.4. Definitions and Assumptions
- 2. Executive Summary
- 2.1. Introduction
- 3. Market Dynamics
- 3.1. Introduction
- 3.2. Market Drivers
- 3.2.1. Rising Demand for Milled and Broken Rice; Growing Preference for Speciality Rice Variety; Government Initiatives Supports Rice Production
- 3.3. Market Restrains
- 3.3.1. Lack of Supply Chain for Rice; Growing Agricultural Labor Crisis
- 3.4. Market Trends
- 3.4.1. Increasing demand for the cotton exports
- 4. Market Factor Analysis
- 4.1. Porters Five Forces
- 4.2. Supply/Value Chain
- 4.3. PESTEL analysis
- 4.4. Market Entropy
- 4.5. Patent/Trademark Analysis
- 5. Global Cotton Industry Analysis, Insights and Forecast, 2019-2031
- 5.1. Market Analysis, Insights and Forecast - by Production Analysis
- 5.2. Market Analysis, Insights and Forecast - by Consumption Analysis
- 5.3. Market Analysis, Insights and Forecast - by Import Market Analysis (Value & Volume)
- 5.4. Market Analysis, Insights and Forecast - by Export Market Analysis (Value & Volume)
- 5.5. Market Analysis, Insights and Forecast - by Price Trend Analysis
- 5.6. Market Analysis, Insights and Forecast - by Region
- 5.6.1. North America
- 5.6.2. Europe
- 5.6.3. Asia Pacific
- 5.6.4. South America
- 5.6.5. Middle East
- 5.6.6. South Africa
- 5.1. Market Analysis, Insights and Forecast - by Production Analysis
- 6. North America Cotton Industry Analysis, Insights and Forecast, 2019-2031
- 6.1. Market Analysis, Insights and Forecast - by Production Analysis
- 6.2. Market Analysis, Insights and Forecast - by Consumption Analysis
- 6.3. Market Analysis, Insights and Forecast - by Import Market Analysis (Value & Volume)
- 6.4. Market Analysis, Insights and Forecast - by Export Market Analysis (Value & Volume)
- 6.5. Market Analysis, Insights and Forecast - by Price Trend Analysis
- 6.1. Market Analysis, Insights and Forecast - by Production Analysis
- 7. Europe Cotton Industry Analysis, Insights and Forecast, 2019-2031
- 7.1. Market Analysis, Insights and Forecast - by Production Analysis
- 7.2. Market Analysis, Insights and Forecast - by Consumption Analysis
- 7.3. Market Analysis, Insights and Forecast - by Import Market Analysis (Value & Volume)
- 7.4. Market Analysis, Insights and Forecast - by Export Market Analysis (Value & Volume)
- 7.5. Market Analysis, Insights and Forecast - by Price Trend Analysis
- 7.1. Market Analysis, Insights and Forecast - by Production Analysis
- 8. Asia Pacific Cotton Industry Analysis, Insights and Forecast, 2019-2031
- 8.1. Market Analysis, Insights and Forecast - by Production Analysis
- 8.2. Market Analysis, Insights and Forecast - by Consumption Analysis
- 8.3. Market Analysis, Insights and Forecast - by Import Market Analysis (Value & Volume)
- 8.4. Market Analysis, Insights and Forecast - by Export Market Analysis (Value & Volume)
- 8.5. Market Analysis, Insights and Forecast - by Price Trend Analysis
- 8.1. Market Analysis, Insights and Forecast - by Production Analysis
- 9. South America Cotton Industry Analysis, Insights and Forecast, 2019-2031
- 9.1. Market Analysis, Insights and Forecast - by Production Analysis
- 9.2. Market Analysis, Insights and Forecast - by Consumption Analysis
- 9.3. Market Analysis, Insights and Forecast - by Import Market Analysis (Value & Volume)
- 9.4. Market Analysis, Insights and Forecast - by Export Market Analysis (Value & Volume)
- 9.5. Market Analysis, Insights and Forecast - by Price Trend Analysis
- 9.1. Market Analysis, Insights and Forecast - by Production Analysis
- 10. Middle East Cotton Industry Analysis, Insights and Forecast, 2019-2031
- 10.1. Market Analysis, Insights and Forecast - by Production Analysis
- 10.2. Market Analysis, Insights and Forecast - by Consumption Analysis
- 10.3. Market Analysis, Insights and Forecast - by Import Market Analysis (Value & Volume)
- 10.4. Market Analysis, Insights and Forecast - by Export Market Analysis (Value & Volume)
- 10.5. Market Analysis, Insights and Forecast - by Price Trend Analysis
- 10.1. Market Analysis, Insights and Forecast - by Production Analysis
- 11. South Africa Cotton Industry Analysis, Insights and Forecast, 2019-2031
- 11.1. Market Analysis, Insights and Forecast - by Production Analysis
- 11.2. Market Analysis, Insights and Forecast - by Consumption Analysis
- 11.3. Market Analysis, Insights and Forecast - by Import Market Analysis (Value & Volume)
- 11.4. Market Analysis, Insights and Forecast - by Export Market Analysis (Value & Volume)
- 11.5. Market Analysis, Insights and Forecast - by Price Trend Analysis
- 11.1. Market Analysis, Insights and Forecast - by Production Analysis
- 12. South America Cotton Industry Analysis, Insights and Forecast, 2019-2031
- 12.1. Market Analysis, Insights and Forecast - By Country/Sub-region
- 12.1.1 Brazil
- 12.1.2 Argentina
- 12.1.3 Rest of South America
- 13. North America Cotton Industry Analysis, Insights and Forecast, 2019-2031
- 13.1. Market Analysis, Insights and Forecast - By Country/Sub-region
- 13.1.1 United States
- 13.1.2 Canada
- 13.1.3 Mexico
- 14. Asia Pacific Cotton Industry Analysis, Insights and Forecast, 2019-2031
- 14.1. Market Analysis, Insights and Forecast - By Country/Sub-region
- 14.1.1 China
- 14.1.2 Japan
- 14.1.3 India
- 14.1.4 South Korea
- 14.1.5 Taiwan
- 14.1.6 Australia
- 14.1.7 Rest of Asia-Pacific
- 15. Europe Cotton Industry Analysis, Insights and Forecast, 2019-2031
- 15.1. Market Analysis, Insights and Forecast - By Country/Sub-region
- 15.1.1 Germany
- 15.1.2 France
- 15.1.3 Italy
- 15.1.4 United Kingdom
- 15.1.5 Netherlands
- 15.1.6 Rest of Europe
- 16. MEA Cotton Industry Analysis, Insights and Forecast, 2019-2031
- 16.1. Market Analysis, Insights and Forecast - By Country/Sub-region
- 16.1.1 Middle East
- 16.1.2 Africa
- 17. Competitive Analysis
- 17.1. Global Market Share Analysis 2024
- 17.2. Company Profiles
- 17.2.1 Monsanto
- 17.2.1.1. Overview
- 17.2.1.2. Products
- 17.2.1.3. SWOT Analysis
- 17.2.1.4. Recent Developments
- 17.2.1.5. Financials (Based on Availability)
- 17.2.2 National Cotton Council of America
- 17.2.2.1. Overview
- 17.2.2.2. Products
- 17.2.2.3. SWOT Analysis
- 17.2.2.4. Recent Developments
- 17.2.2.5. Financials (Based on Availability)
- 17.2.3 Syngenta
- 17.2.3.1. Overview
- 17.2.3.2. Products
- 17.2.3.3. SWOT Analysis
- 17.2.3.4. Recent Developments
- 17.2.3.5. Financials (Based on Availability)
- 17.2.4 The Texas Cotton Association
- 17.2.4.1. Overview
- 17.2.4.2. Products
- 17.2.4.3. SWOT Analysis
- 17.2.4.4. Recent Developments
- 17.2.4.5. Financials (Based on Availability)
- 17.2.5 Cotton Incorporated
- 17.2.5.1. Overview
- 17.2.5.2. Products
- 17.2.5.3. SWOT Analysis
- 17.2.5.4. Recent Developments
- 17.2.5.5. Financials (Based on Availability)
- 17.2.6 International Cotton Association
- 17.2.6.1. Overview
- 17.2.6.2. Products
- 17.2.6.3. SWOT Analysis
- 17.2.6.4. Recent Developments
- 17.2.6.5. Financials (Based on Availability)
- 17.2.7 Bayer CropScience
- 17.2.7.1. Overview
- 17.2.7.2. Products
- 17.2.7.3. SWOT Analysis
- 17.2.7.4. Recent Developments
- 17.2.7.5. Financials (Based on Availability)
- 17.2.1 Monsanto
List of Figures
- Figure 1: Global Cotton Industry Revenue Breakdown (Million, %) by Region 2024 & 2032
- Figure 2: Global Cotton Industry Volume Breakdown (Kiloton, %) by Region 2024 & 2032
- Figure 3: South America Cotton Industry Revenue (Million), by Country 2024 & 2032
- Figure 4: South America Cotton Industry Volume (Kiloton), by Country 2024 & 2032
- Figure 5: South America Cotton Industry Revenue Share (%), by Country 2024 & 2032
- Figure 6: South America Cotton Industry Volume Share (%), by Country 2024 & 2032
- Figure 7: North America Cotton Industry Revenue (Million), by Country 2024 & 2032
- Figure 8: North America Cotton Industry Volume (Kiloton), by Country 2024 & 2032
- Figure 9: North America Cotton Industry Revenue Share (%), by Country 2024 & 2032
- Figure 10: North America Cotton Industry Volume Share (%), by Country 2024 & 2032
- Figure 11: Asia Pacific Cotton Industry Revenue (Million), by Country 2024 & 2032
- Figure 12: Asia Pacific Cotton Industry Volume (Kiloton), by Country 2024 & 2032
- Figure 13: Asia Pacific Cotton Industry Revenue Share (%), by Country 2024 & 2032
- Figure 14: Asia Pacific Cotton Industry Volume Share (%), by Country 2024 & 2032
- Figure 15: Europe Cotton Industry Revenue (Million), by Country 2024 & 2032
- Figure 16: Europe Cotton Industry Volume (Kiloton), by Country 2024 & 2032
- Figure 17: Europe Cotton Industry Revenue Share (%), by Country 2024 & 2032
- Figure 18: Europe Cotton Industry Volume Share (%), by Country 2024 & 2032
- Figure 19: MEA Cotton Industry Revenue (Million), by Country 2024 & 2032
- Figure 20: MEA Cotton Industry Volume (Kiloton), by Country 2024 & 2032
- Figure 21: MEA Cotton Industry Revenue Share (%), by Country 2024 & 2032
- Figure 22: MEA Cotton Industry Volume Share (%), by Country 2024 & 2032
- Figure 23: North America Cotton Industry Revenue (Million), by Production Analysis 2024 & 2032
- Figure 24: North America Cotton Industry Volume (Kiloton), by Production Analysis 2024 & 2032
- Figure 25: North America Cotton Industry Revenue Share (%), by Production Analysis 2024 & 2032
- Figure 26: North America Cotton Industry Volume Share (%), by Production Analysis 2024 & 2032
- Figure 27: North America Cotton Industry Revenue (Million), by Consumption Analysis 2024 & 2032
- Figure 28: North America Cotton Industry Volume (Kiloton), by Consumption Analysis 2024 & 2032
- Figure 29: North America Cotton Industry Revenue Share (%), by Consumption Analysis 2024 & 2032
- Figure 30: North America Cotton Industry Volume Share (%), by Consumption Analysis 2024 & 2032
- Figure 31: North America Cotton Industry Revenue (Million), by Import Market Analysis (Value & Volume) 2024 & 2032
- Figure 32: North America Cotton Industry Volume (Kiloton), by Import Market Analysis (Value & Volume) 2024 & 2032
- Figure 33: North America Cotton Industry Revenue Share (%), by Import Market Analysis (Value & Volume) 2024 & 2032
- Figure 34: North America Cotton Industry Volume Share (%), by Import Market Analysis (Value & Volume) 2024 & 2032
- Figure 35: North America Cotton Industry Revenue (Million), by Export Market Analysis (Value & Volume) 2024 & 2032
- Figure 36: North America Cotton Industry Volume (Kiloton), by Export Market Analysis (Value & Volume) 2024 & 2032
- Figure 37: North America Cotton Industry Revenue Share (%), by Export Market Analysis (Value & Volume) 2024 & 2032
- Figure 38: North America Cotton Industry Volume Share (%), by Export Market Analysis (Value & Volume) 2024 & 2032
- Figure 39: North America Cotton Industry Revenue (Million), by Price Trend Analysis 2024 & 2032
- Figure 40: North America Cotton Industry Volume (Kiloton), by Price Trend Analysis 2024 & 2032
- Figure 41: North America Cotton Industry Revenue Share (%), by Price Trend Analysis 2024 & 2032
- Figure 42: North America Cotton Industry Volume Share (%), by Price Trend Analysis 2024 & 2032
- Figure 43: North America Cotton Industry Revenue (Million), by Country 2024 & 2032
- Figure 44: North America Cotton Industry Volume (Kiloton), by Country 2024 & 2032
- Figure 45: North America Cotton Industry Revenue Share (%), by Country 2024 & 2032
- Figure 46: North America Cotton Industry Volume Share (%), by Country 2024 & 2032
- Figure 47: Europe Cotton Industry Revenue (Million), by Production Analysis 2024 & 2032
- Figure 48: Europe Cotton Industry Volume (Kiloton), by Production Analysis 2024 & 2032
- Figure 49: Europe Cotton Industry Revenue Share (%), by Production Analysis 2024 & 2032
- Figure 50: Europe Cotton Industry Volume Share (%), by Production Analysis 2024 & 2032
- Figure 51: Europe Cotton Industry Revenue (Million), by Consumption Analysis 2024 & 2032
- Figure 52: Europe Cotton Industry Volume (Kiloton), by Consumption Analysis 2024 & 2032
- Figure 53: Europe Cotton Industry Revenue Share (%), by Consumption Analysis 2024 & 2032
- Figure 54: Europe Cotton Industry Volume Share (%), by Consumption Analysis 2024 & 2032
- Figure 55: Europe Cotton Industry Revenue (Million), by Import Market Analysis (Value & Volume) 2024 & 2032
- Figure 56: Europe Cotton Industry Volume (Kiloton), by Import Market Analysis (Value & Volume) 2024 & 2032
- Figure 57: Europe Cotton Industry Revenue Share (%), by Import Market Analysis (Value & Volume) 2024 & 2032
- Figure 58: Europe Cotton Industry Volume Share (%), by Import Market Analysis (Value & Volume) 2024 & 2032
- Figure 59: Europe Cotton Industry Revenue (Million), by Export Market Analysis (Value & Volume) 2024 & 2032
- Figure 60: Europe Cotton Industry Volume (Kiloton), by Export Market Analysis (Value & Volume) 2024 & 2032
- Figure 61: Europe Cotton Industry Revenue Share (%), by Export Market Analysis (Value & Volume) 2024 & 2032
- Figure 62: Europe Cotton Industry Volume Share (%), by Export Market Analysis (Value & Volume) 2024 & 2032
- Figure 63: Europe Cotton Industry Revenue (Million), by Price Trend Analysis 2024 & 2032
- Figure 64: Europe Cotton Industry Volume (Kiloton), by Price Trend Analysis 2024 & 2032
- Figure 65: Europe Cotton Industry Revenue Share (%), by Price Trend Analysis 2024 & 2032
- Figure 66: Europe Cotton Industry Volume Share (%), by Price Trend Analysis 2024 & 2032
- Figure 67: Europe Cotton Industry Revenue (Million), by Country 2024 & 2032
- Figure 68: Europe Cotton Industry Volume (Kiloton), by Country 2024 & 2032
- Figure 69: Europe Cotton Industry Revenue Share (%), by Country 2024 & 2032
- Figure 70: Europe Cotton Industry Volume Share (%), by Country 2024 & 2032
- Figure 71: Asia Pacific Cotton Industry Revenue (Million), by Production Analysis 2024 & 2032
- Figure 72: Asia Pacific Cotton Industry Volume (Kiloton), by Production Analysis 2024 & 2032
- Figure 73: Asia Pacific Cotton Industry Revenue Share (%), by Production Analysis 2024 & 2032
- Figure 74: Asia Pacific Cotton Industry Volume Share (%), by Production Analysis 2024 & 2032
- Figure 75: Asia Pacific Cotton Industry Revenue (Million), by Consumption Analysis 2024 & 2032
- Figure 76: Asia Pacific Cotton Industry Volume (Kiloton), by Consumption Analysis 2024 & 2032
- Figure 77: Asia Pacific Cotton Industry Revenue Share (%), by Consumption Analysis 2024 & 2032
- Figure 78: Asia Pacific Cotton Industry Volume Share (%), by Consumption Analysis 2024 & 2032
- Figure 79: Asia Pacific Cotton Industry Revenue (Million), by Import Market Analysis (Value & Volume) 2024 & 2032
- Figure 80: Asia Pacific Cotton Industry Volume (Kiloton), by Import Market Analysis (Value & Volume) 2024 & 2032
- Figure 81: Asia Pacific Cotton Industry Revenue Share (%), by Import Market Analysis (Value & Volume) 2024 & 2032
- Figure 82: Asia Pacific Cotton Industry Volume Share (%), by Import Market Analysis (Value & Volume) 2024 & 2032
- Figure 83: Asia Pacific Cotton Industry Revenue (Million), by Export Market Analysis (Value & Volume) 2024 & 2032
- Figure 84: Asia Pacific Cotton Industry Volume (Kiloton), by Export Market Analysis (Value & Volume) 2024 & 2032
- Figure 85: Asia Pacific Cotton Industry Revenue Share (%), by Export Market Analysis (Value & Volume) 2024 & 2032
- Figure 86: Asia Pacific Cotton Industry Volume Share (%), by Export Market Analysis (Value & Volume) 2024 & 2032
- Figure 87: Asia Pacific Cotton Industry Revenue (Million), by Price Trend Analysis 2024 & 2032
- Figure 88: Asia Pacific Cotton Industry Volume (Kiloton), by Price Trend Analysis 2024 & 2032
- Figure 89: Asia Pacific Cotton Industry Revenue Share (%), by Price Trend Analysis 2024 & 2032
- Figure 90: Asia Pacific Cotton Industry Volume Share (%), by Price Trend Analysis 2024 & 2032
- Figure 91: Asia Pacific Cotton Industry Revenue (Million), by Country 2024 & 2032
- Figure 92: Asia Pacific Cotton Industry Volume (Kiloton), by Country 2024 & 2032
- Figure 93: Asia Pacific Cotton Industry Revenue Share (%), by Country 2024 & 2032
- Figure 94: Asia Pacific Cotton Industry Volume Share (%), by Country 2024 & 2032
- Figure 95: South America Cotton Industry Revenue (Million), by Production Analysis 2024 & 2032
- Figure 96: South America Cotton Industry Volume (Kiloton), by Production Analysis 2024 & 2032
- Figure 97: South America Cotton Industry Revenue Share (%), by Production Analysis 2024 & 2032
- Figure 98: South America Cotton Industry Volume Share (%), by Production Analysis 2024 & 2032
- Figure 99: South America Cotton Industry Revenue (Million), by Consumption Analysis 2024 & 2032
- Figure 100: South America Cotton Industry Volume (Kiloton), by Consumption Analysis 2024 & 2032
- Figure 101: South America Cotton Industry Revenue Share (%), by Consumption Analysis 2024 & 2032
- Figure 102: South America Cotton Industry Volume Share (%), by Consumption Analysis 2024 & 2032
- Figure 103: South America Cotton Industry Revenue (Million), by Import Market Analysis (Value & Volume) 2024 & 2032
- Figure 104: South America Cotton Industry Volume (Kiloton), by Import Market Analysis (Value & Volume) 2024 & 2032
- Figure 105: South America Cotton Industry Revenue Share (%), by Import Market Analysis (Value & Volume) 2024 & 2032
- Figure 106: South America Cotton Industry Volume Share (%), by Import Market Analysis (Value & Volume) 2024 & 2032
- Figure 107: South America Cotton Industry Revenue (Million), by Export Market Analysis (Value & Volume) 2024 & 2032
- Figure 108: South America Cotton Industry Volume (Kiloton), by Export Market Analysis (Value & Volume) 2024 & 2032
- Figure 109: South America Cotton Industry Revenue Share (%), by Export Market Analysis (Value & Volume) 2024 & 2032
- Figure 110: South America Cotton Industry Volume Share (%), by Export Market Analysis (Value & Volume) 2024 & 2032
- Figure 111: South America Cotton Industry Revenue (Million), by Price Trend Analysis 2024 & 2032
- Figure 112: South America Cotton Industry Volume (Kiloton), by Price Trend Analysis 2024 & 2032
- Figure 113: South America Cotton Industry Revenue Share (%), by Price Trend Analysis 2024 & 2032
- Figure 114: South America Cotton Industry Volume Share (%), by Price Trend Analysis 2024 & 2032
- Figure 115: South America Cotton Industry Revenue (Million), by Country 2024 & 2032
- Figure 116: South America Cotton Industry Volume (Kiloton), by Country 2024 & 2032
- Figure 117: South America Cotton Industry Revenue Share (%), by Country 2024 & 2032
- Figure 118: South America Cotton Industry Volume Share (%), by Country 2024 & 2032
- Figure 119: Middle East Cotton Industry Revenue (Million), by Production Analysis 2024 & 2032
- Figure 120: Middle East Cotton Industry Volume (Kiloton), by Production Analysis 2024 & 2032
- Figure 121: Middle East Cotton Industry Revenue Share (%), by Production Analysis 2024 & 2032
- Figure 122: Middle East Cotton Industry Volume Share (%), by Production Analysis 2024 & 2032
- Figure 123: Middle East Cotton Industry Revenue (Million), by Consumption Analysis 2024 & 2032
- Figure 124: Middle East Cotton Industry Volume (Kiloton), by Consumption Analysis 2024 & 2032
- Figure 125: Middle East Cotton Industry Revenue Share (%), by Consumption Analysis 2024 & 2032
- Figure 126: Middle East Cotton Industry Volume Share (%), by Consumption Analysis 2024 & 2032
- Figure 127: Middle East Cotton Industry Revenue (Million), by Import Market Analysis (Value & Volume) 2024 & 2032
- Figure 128: Middle East Cotton Industry Volume (Kiloton), by Import Market Analysis (Value & Volume) 2024 & 2032
- Figure 129: Middle East Cotton Industry Revenue Share (%), by Import Market Analysis (Value & Volume) 2024 & 2032
- Figure 130: Middle East Cotton Industry Volume Share (%), by Import Market Analysis (Value & Volume) 2024 & 2032
- Figure 131: Middle East Cotton Industry Revenue (Million), by Export Market Analysis (Value & Volume) 2024 & 2032
- Figure 132: Middle East Cotton Industry Volume (Kiloton), by Export Market Analysis (Value & Volume) 2024 & 2032
- Figure 133: Middle East Cotton Industry Revenue Share (%), by Export Market Analysis (Value & Volume) 2024 & 2032
- Figure 134: Middle East Cotton Industry Volume Share (%), by Export Market Analysis (Value & Volume) 2024 & 2032
- Figure 135: Middle East Cotton Industry Revenue (Million), by Price Trend Analysis 2024 & 2032
- Figure 136: Middle East Cotton Industry Volume (Kiloton), by Price Trend Analysis 2024 & 2032
- Figure 137: Middle East Cotton Industry Revenue Share (%), by Price Trend Analysis 2024 & 2032
- Figure 138: Middle East Cotton Industry Volume Share (%), by Price Trend Analysis 2024 & 2032
- Figure 139: Middle East Cotton Industry Revenue (Million), by Country 2024 & 2032
- Figure 140: Middle East Cotton Industry Volume (Kiloton), by Country 2024 & 2032
- Figure 141: Middle East Cotton Industry Revenue Share (%), by Country 2024 & 2032
- Figure 142: Middle East Cotton Industry Volume Share (%), by Country 2024 & 2032
- Figure 143: South Africa Cotton Industry Revenue (Million), by Production Analysis 2024 & 2032
- Figure 144: South Africa Cotton Industry Volume (Kiloton), by Production Analysis 2024 & 2032
- Figure 145: South Africa Cotton Industry Revenue Share (%), by Production Analysis 2024 & 2032
- Figure 146: South Africa Cotton Industry Volume Share (%), by Production Analysis 2024 & 2032
- Figure 147: South Africa Cotton Industry Revenue (Million), by Consumption Analysis 2024 & 2032
- Figure 148: South Africa Cotton Industry Volume (Kiloton), by Consumption Analysis 2024 & 2032
- Figure 149: South Africa Cotton Industry Revenue Share (%), by Consumption Analysis 2024 & 2032
- Figure 150: South Africa Cotton Industry Volume Share (%), by Consumption Analysis 2024 & 2032
- Figure 151: South Africa Cotton Industry Revenue (Million), by Import Market Analysis (Value & Volume) 2024 & 2032
- Figure 152: South Africa Cotton Industry Volume (Kiloton), by Import Market Analysis (Value & Volume) 2024 & 2032
- Figure 153: South Africa Cotton Industry Revenue Share (%), by Import Market Analysis (Value & Volume) 2024 & 2032
- Figure 154: South Africa Cotton Industry Volume Share (%), by Import Market Analysis (Value & Volume) 2024 & 2032
- Figure 155: South Africa Cotton Industry Revenue (Million), by Export Market Analysis (Value & Volume) 2024 & 2032
- Figure 156: South Africa Cotton Industry Volume (Kiloton), by Export Market Analysis (Value & Volume) 2024 & 2032
- Figure 157: South Africa Cotton Industry Revenue Share (%), by Export Market Analysis (Value & Volume) 2024 & 2032
- Figure 158: South Africa Cotton Industry Volume Share (%), by Export Market Analysis (Value & Volume) 2024 & 2032
- Figure 159: South Africa Cotton Industry Revenue (Million), by Price Trend Analysis 2024 & 2032
- Figure 160: South Africa Cotton Industry Volume (Kiloton), by Price Trend Analysis 2024 & 2032
- Figure 161: South Africa Cotton Industry Revenue Share (%), by Price Trend Analysis 2024 & 2032
- Figure 162: South Africa Cotton Industry Volume Share (%), by Price Trend Analysis 2024 & 2032
- Figure 163: South Africa Cotton Industry Revenue (Million), by Country 2024 & 2032
- Figure 164: South Africa Cotton Industry Volume (Kiloton), by Country 2024 & 2032
- Figure 165: South Africa Cotton Industry Revenue Share (%), by Country 2024 & 2032
- Figure 166: South Africa Cotton Industry Volume Share (%), by Country 2024 & 2032
List of Tables
- Table 1: Global Cotton Industry Revenue Million Forecast, by Region 2019 & 2032
- Table 2: Global Cotton Industry Volume Kiloton Forecast, by Region 2019 & 2032
- Table 3: Global Cotton Industry Revenue Million Forecast, by Production Analysis 2019 & 2032
- Table 4: Global Cotton Industry Volume Kiloton Forecast, by Production Analysis 2019 & 2032
- Table 5: Global Cotton Industry Revenue Million Forecast, by Consumption Analysis 2019 & 2032
- Table 6: Global Cotton Industry Volume Kiloton Forecast, by Consumption Analysis 2019 & 2032
- Table 7: Global Cotton Industry Revenue Million Forecast, by Import Market Analysis (Value & Volume) 2019 & 2032
- Table 8: Global Cotton Industry Volume Kiloton Forecast, by Import Market Analysis (Value & Volume) 2019 & 2032
- Table 9: Global Cotton Industry Revenue Million Forecast, by Export Market Analysis (Value & Volume) 2019 & 2032
- Table 10: Global Cotton Industry Volume Kiloton Forecast, by Export Market Analysis (Value & Volume) 2019 & 2032
- Table 11: Global Cotton Industry Revenue Million Forecast, by Price Trend Analysis 2019 & 2032
- Table 12: Global Cotton Industry Volume Kiloton Forecast, by Price Trend Analysis 2019 & 2032
- Table 13: Global Cotton Industry Revenue Million Forecast, by Region 2019 & 2032
- Table 14: Global Cotton Industry Volume Kiloton Forecast, by Region 2019 & 2032
- Table 15: Global Cotton Industry Revenue Million Forecast, by Country 2019 & 2032
- Table 16: Global Cotton Industry Volume Kiloton Forecast, by Country 2019 & 2032
- Table 17: Brazil Cotton Industry Revenue (Million) Forecast, by Application 2019 & 2032
- Table 18: Brazil Cotton Industry Volume (Kiloton) Forecast, by Application 2019 & 2032
- Table 19: Argentina Cotton Industry Revenue (Million) Forecast, by Application 2019 & 2032
- Table 20: Argentina Cotton Industry Volume (Kiloton) Forecast, by Application 2019 & 2032
- Table 21: Rest of South America Cotton Industry Revenue (Million) Forecast, by Application 2019 & 2032
- Table 22: Rest of South America Cotton Industry Volume (Kiloton) Forecast, by Application 2019 & 2032
- Table 23: Global Cotton Industry Revenue Million Forecast, by Country 2019 & 2032
- Table 24: Global Cotton Industry Volume Kiloton Forecast, by Country 2019 & 2032
- Table 25: United States Cotton Industry Revenue (Million) Forecast, by Application 2019 & 2032
- Table 26: United States Cotton Industry Volume (Kiloton) Forecast, by Application 2019 & 2032
- Table 27: Canada Cotton Industry Revenue (Million) Forecast, by Application 2019 & 2032
- Table 28: Canada Cotton Industry Volume (Kiloton) Forecast, by Application 2019 & 2032
- Table 29: Mexico Cotton Industry Revenue (Million) Forecast, by Application 2019 & 2032
- Table 30: Mexico Cotton Industry Volume (Kiloton) Forecast, by Application 2019 & 2032
- Table 31: Global Cotton Industry Revenue Million Forecast, by Country 2019 & 2032
- Table 32: Global Cotton Industry Volume Kiloton Forecast, by Country 2019 & 2032
- Table 33: China Cotton Industry Revenue (Million) Forecast, by Application 2019 & 2032
- Table 34: China Cotton Industry Volume (Kiloton) Forecast, by Application 2019 & 2032
- Table 35: Japan Cotton Industry Revenue (Million) Forecast, by Application 2019 & 2032
- Table 36: Japan Cotton Industry Volume (Kiloton) Forecast, by Application 2019 & 2032
- Table 37: India Cotton Industry Revenue (Million) Forecast, by Application 2019 & 2032
- Table 38: India Cotton Industry Volume (Kiloton) Forecast, by Application 2019 & 2032
- Table 39: South Korea Cotton Industry Revenue (Million) Forecast, by Application 2019 & 2032
- Table 40: South Korea Cotton Industry Volume (Kiloton) Forecast, by Application 2019 & 2032
- Table 41: Taiwan Cotton Industry Revenue (Million) Forecast, by Application 2019 & 2032
- Table 42: Taiwan Cotton Industry Volume (Kiloton) Forecast, by Application 2019 & 2032
- Table 43: Australia Cotton Industry Revenue (Million) Forecast, by Application 2019 & 2032
- Table 44: Australia Cotton Industry Volume (Kiloton) Forecast, by Application 2019 & 2032
- Table 45: Rest of Asia-Pacific Cotton Industry Revenue (Million) Forecast, by Application 2019 & 2032
- Table 46: Rest of Asia-Pacific Cotton Industry Volume (Kiloton) Forecast, by Application 2019 & 2032
- Table 47: Global Cotton Industry Revenue Million Forecast, by Country 2019 & 2032
- Table 48: Global Cotton Industry Volume Kiloton Forecast, by Country 2019 & 2032
- Table 49: Germany Cotton Industry Revenue (Million) Forecast, by Application 2019 & 2032
- Table 50: Germany Cotton Industry Volume (Kiloton) Forecast, by Application 2019 & 2032
- Table 51: France Cotton Industry Revenue (Million) Forecast, by Application 2019 & 2032
- Table 52: France Cotton Industry Volume (Kiloton) Forecast, by Application 2019 & 2032
- Table 53: Italy Cotton Industry Revenue (Million) Forecast, by Application 2019 & 2032
- Table 54: Italy Cotton Industry Volume (Kiloton) Forecast, by Application 2019 & 2032
- Table 55: United Kingdom Cotton Industry Revenue (Million) Forecast, by Application 2019 & 2032
- Table 56: United Kingdom Cotton Industry Volume (Kiloton) Forecast, by Application 2019 & 2032
- Table 57: Netherlands Cotton Industry Revenue (Million) Forecast, by Application 2019 & 2032
- Table 58: Netherlands Cotton Industry Volume (Kiloton) Forecast, by Application 2019 & 2032
- Table 59: Rest of Europe Cotton Industry Revenue (Million) Forecast, by Application 2019 & 2032
- Table 60: Rest of Europe Cotton Industry Volume (Kiloton) Forecast, by Application 2019 & 2032
- Table 61: Global Cotton Industry Revenue Million Forecast, by Country 2019 & 2032
- Table 62: Global Cotton Industry Volume Kiloton Forecast, by Country 2019 & 2032
- Table 63: Middle East Cotton Industry Revenue (Million) Forecast, by Application 2019 & 2032
- Table 64: Middle East Cotton Industry Volume (Kiloton) Forecast, by Application 2019 & 2032
- Table 65: Africa Cotton Industry Revenue (Million) Forecast, by Application 2019 & 2032
- Table 66: Africa Cotton Industry Volume (Kiloton) Forecast, by Application 2019 & 2032
- Table 67: Global Cotton Industry Revenue Million Forecast, by Production Analysis 2019 & 2032
- Table 68: Global Cotton Industry Volume Kiloton Forecast, by Production Analysis 2019 & 2032
- Table 69: Global Cotton Industry Revenue Million Forecast, by Consumption Analysis 2019 & 2032
- Table 70: Global Cotton Industry Volume Kiloton Forecast, by Consumption Analysis 2019 & 2032
- Table 71: Global Cotton Industry Revenue Million Forecast, by Import Market Analysis (Value & Volume) 2019 & 2032
- Table 72: Global Cotton Industry Volume Kiloton Forecast, by Import Market Analysis (Value & Volume) 2019 & 2032
- Table 73: Global Cotton Industry Revenue Million Forecast, by Export Market Analysis (Value & Volume) 2019 & 2032
- Table 74: Global Cotton Industry Volume Kiloton Forecast, by Export Market Analysis (Value & Volume) 2019 & 2032
- Table 75: Global Cotton Industry Revenue Million Forecast, by Price Trend Analysis 2019 & 2032
- Table 76: Global Cotton Industry Volume Kiloton Forecast, by Price Trend Analysis 2019 & 2032
- Table 77: Global Cotton Industry Revenue Million Forecast, by Country 2019 & 2032
- Table 78: Global Cotton Industry Volume Kiloton Forecast, by Country 2019 & 2032
- Table 79: United States Cotton Industry Revenue (Million) Forecast, by Application 2019 & 2032
- Table 80: United States Cotton Industry Volume (Kiloton) Forecast, by Application 2019 & 2032
- Table 81: Canada Cotton Industry Revenue (Million) Forecast, by Application 2019 & 2032
- Table 82: Canada Cotton Industry Volume (Kiloton) Forecast, by Application 2019 & 2032
- Table 83: Mexico Cotton Industry Revenue (Million) Forecast, by Application 2019 & 2032
- Table 84: Mexico Cotton Industry Volume (Kiloton) Forecast, by Application 2019 & 2032
- Table 85: Global Cotton Industry Revenue Million Forecast, by Production Analysis 2019 & 2032
- Table 86: Global Cotton Industry Volume Kiloton Forecast, by Production Analysis 2019 & 2032
- Table 87: Global Cotton Industry Revenue Million Forecast, by Consumption Analysis 2019 & 2032
- Table 88: Global Cotton Industry Volume Kiloton Forecast, by Consumption Analysis 2019 & 2032
- Table 89: Global Cotton Industry Revenue Million Forecast, by Import Market Analysis (Value & Volume) 2019 & 2032
- Table 90: Global Cotton Industry Volume Kiloton Forecast, by Import Market Analysis (Value & Volume) 2019 & 2032
- Table 91: Global Cotton Industry Revenue Million Forecast, by Export Market Analysis (Value & Volume) 2019 & 2032
- Table 92: Global Cotton Industry Volume Kiloton Forecast, by Export Market Analysis (Value & Volume) 2019 & 2032
- Table 93: Global Cotton Industry Revenue Million Forecast, by Price Trend Analysis 2019 & 2032
- Table 94: Global Cotton Industry Volume Kiloton Forecast, by Price Trend Analysis 2019 & 2032
- Table 95: Global Cotton Industry Revenue Million Forecast, by Country 2019 & 2032
- Table 96: Global Cotton Industry Volume Kiloton Forecast, by Country 2019 & 2032
- Table 97: Germany Cotton Industry Revenue (Million) Forecast, by Application 2019 & 2032
- Table 98: Germany Cotton Industry Volume (Kiloton) Forecast, by Application 2019 & 2032
- Table 99: France Cotton Industry Revenue (Million) Forecast, by Application 2019 & 2032
- Table 100: France Cotton Industry Volume (Kiloton) Forecast, by Application 2019 & 2032
- Table 101: Russia Cotton Industry Revenue (Million) Forecast, by Application 2019 & 2032
- Table 102: Russia Cotton Industry Volume (Kiloton) Forecast, by Application 2019 & 2032
- Table 103: Greece Cotton Industry Revenue (Million) Forecast, by Application 2019 & 2032
- Table 104: Greece Cotton Industry Volume (Kiloton) Forecast, by Application 2019 & 2032
- Table 105: Italy Cotton Industry Revenue (Million) Forecast, by Application 2019 & 2032
- Table 106: Italy Cotton Industry Volume (Kiloton) Forecast, by Application 2019 & 2032
- Table 107: Global Cotton Industry Revenue Million Forecast, by Production Analysis 2019 & 2032
- Table 108: Global Cotton Industry Volume Kiloton Forecast, by Production Analysis 2019 & 2032
- Table 109: Global Cotton Industry Revenue Million Forecast, by Consumption Analysis 2019 & 2032
- Table 110: Global Cotton Industry Volume Kiloton Forecast, by Consumption Analysis 2019 & 2032
- Table 111: Global Cotton Industry Revenue Million Forecast, by Import Market Analysis (Value & Volume) 2019 & 2032
- Table 112: Global Cotton Industry Volume Kiloton Forecast, by Import Market Analysis (Value & Volume) 2019 & 2032
- Table 113: Global Cotton Industry Revenue Million Forecast, by Export Market Analysis (Value & Volume) 2019 & 2032
- Table 114: Global Cotton Industry Volume Kiloton Forecast, by Export Market Analysis (Value & Volume) 2019 & 2032
- Table 115: Global Cotton Industry Revenue Million Forecast, by Price Trend Analysis 2019 & 2032
- Table 116: Global Cotton Industry Volume Kiloton Forecast, by Price Trend Analysis 2019 & 2032
- Table 117: Global Cotton Industry Revenue Million Forecast, by Country 2019 & 2032
- Table 118: Global Cotton Industry Volume Kiloton Forecast, by Country 2019 & 2032
- Table 119: China Cotton Industry Revenue (Million) Forecast, by Application 2019 & 2032
- Table 120: China Cotton Industry Volume (Kiloton) Forecast, by Application 2019 & 2032
- Table 121: India Cotton Industry Revenue (Million) Forecast, by Application 2019 & 2032
- Table 122: India Cotton Industry Volume (Kiloton) Forecast, by Application 2019 & 2032
- Table 123: Australia Cotton Industry Revenue (Million) Forecast, by Application 2019 & 2032
- Table 124: Australia Cotton Industry Volume (Kiloton) Forecast, by Application 2019 & 2032
- Table 125: Pakistan Cotton Industry Revenue (Million) Forecast, by Application 2019 & 2032
- Table 126: Pakistan Cotton Industry Volume (Kiloton) Forecast, by Application 2019 & 2032
- Table 127: Bangladesh Cotton Industry Revenue (Million) Forecast, by Application 2019 & 2032
- Table 128: Bangladesh Cotton Industry Volume (Kiloton) Forecast, by Application 2019 & 2032
- Table 129: Global Cotton Industry Revenue Million Forecast, by Production Analysis 2019 & 2032
- Table 130: Global Cotton Industry Volume Kiloton Forecast, by Production Analysis 2019 & 2032
- Table 131: Global Cotton Industry Revenue Million Forecast, by Consumption Analysis 2019 & 2032
- Table 132: Global Cotton Industry Volume Kiloton Forecast, by Consumption Analysis 2019 & 2032
- Table 133: Global Cotton Industry Revenue Million Forecast, by Import Market Analysis (Value & Volume) 2019 & 2032
- Table 134: Global Cotton Industry Volume Kiloton Forecast, by Import Market Analysis (Value & Volume) 2019 & 2032
- Table 135: Global Cotton Industry Revenue Million Forecast, by Export Market Analysis (Value & Volume) 2019 & 2032
- Table 136: Global Cotton Industry Volume Kiloton Forecast, by Export Market Analysis (Value & Volume) 2019 & 2032
- Table 137: Global Cotton Industry Revenue Million Forecast, by Price Trend Analysis 2019 & 2032
- Table 138: Global Cotton Industry Volume Kiloton Forecast, by Price Trend Analysis 2019 & 2032
- Table 139: Global Cotton Industry Revenue Million Forecast, by Country 2019 & 2032
- Table 140: Global Cotton Industry Volume Kiloton Forecast, by Country 2019 & 2032
- Table 141: Brazil Cotton Industry Revenue (Million) Forecast, by Application 2019 & 2032
- Table 142: Brazil Cotton Industry Volume (Kiloton) Forecast, by Application 2019 & 2032
- Table 143: Argentina Cotton Industry Revenue (Million) Forecast, by Application 2019 & 2032
- Table 144: Argentina Cotton Industry Volume (Kiloton) Forecast, by Application 2019 & 2032
- Table 145: Global Cotton Industry Revenue Million Forecast, by Production Analysis 2019 & 2032
- Table 146: Global Cotton Industry Volume Kiloton Forecast, by Production Analysis 2019 & 2032
- Table 147: Global Cotton Industry Revenue Million Forecast, by Consumption Analysis 2019 & 2032
- Table 148: Global Cotton Industry Volume Kiloton Forecast, by Consumption Analysis 2019 & 2032
- Table 149: Global Cotton Industry Revenue Million Forecast, by Import Market Analysis (Value & Volume) 2019 & 2032
- Table 150: Global Cotton Industry Volume Kiloton Forecast, by Import Market Analysis (Value & Volume) 2019 & 2032
- Table 151: Global Cotton Industry Revenue Million Forecast, by Export Market Analysis (Value & Volume) 2019 & 2032
- Table 152: Global Cotton Industry Volume Kiloton Forecast, by Export Market Analysis (Value & Volume) 2019 & 2032
- Table 153: Global Cotton Industry Revenue Million Forecast, by Price Trend Analysis 2019 & 2032
- Table 154: Global Cotton Industry Volume Kiloton Forecast, by Price Trend Analysis 2019 & 2032
- Table 155: Global Cotton Industry Revenue Million Forecast, by Country 2019 & 2032
- Table 156: Global Cotton Industry Volume Kiloton Forecast, by Country 2019 & 2032
- Table 157: Global Cotton Industry Revenue Million Forecast, by Production Analysis 2019 & 2032
- Table 158: Global Cotton Industry Volume Kiloton Forecast, by Production Analysis 2019 & 2032
- Table 159: Global Cotton Industry Revenue Million Forecast, by Consumption Analysis 2019 & 2032
- Table 160: Global Cotton Industry Volume Kiloton Forecast, by Consumption Analysis 2019 & 2032
- Table 161: Global Cotton Industry Revenue Million Forecast, by Import Market Analysis (Value & Volume) 2019 & 2032
- Table 162: Global Cotton Industry Volume Kiloton Forecast, by Import Market Analysis (Value & Volume) 2019 & 2032
- Table 163: Global Cotton Industry Revenue Million Forecast, by Export Market Analysis (Value & Volume) 2019 & 2032
- Table 164: Global Cotton Industry Volume Kiloton Forecast, by Export Market Analysis (Value & Volume) 2019 & 2032
- Table 165: Global Cotton Industry Revenue Million Forecast, by Price Trend Analysis 2019 & 2032
- Table 166: Global Cotton Industry Volume Kiloton Forecast, by Price Trend Analysis 2019 & 2032
- Table 167: Global Cotton Industry Revenue Million Forecast, by Country 2019 & 2032
- Table 168: Global Cotton Industry Volume Kiloton Forecast, by Country 2019 & 2032
- Table 169: Turkey Cotton Industry Revenue (Million) Forecast, by Application 2019 & 2032
- Table 170: Turkey Cotton Industry Volume (Kiloton) Forecast, by Application 2019 & 2032
- Table 171: Egypt Cotton Industry Revenue (Million) Forecast, by Application 2019 & 2032
- Table 172: Egypt Cotton Industry Volume (Kiloton) Forecast, by Application 2019 & 2032
Frequently Asked Questions
1. What is the projected Compound Annual Growth Rate (CAGR) of the Cotton Industry?
The projected CAGR is approximately 2.70%.
2. Which companies are prominent players in the Cotton Industry?
Key companies in the market include Monsanto, National Cotton Council of America, Syngenta , The Texas Cotton Association, Cotton Incorporated , International Cotton Association , Bayer CropScience .
3. What are the main segments of the Cotton Industry?
The market segments include Production Analysis, Consumption Analysis, Import Market Analysis (Value & Volume), Export Market Analysis (Value & Volume), Price Trend Analysis.
4. Can you provide details about the market size?
The market size is estimated to be USD 43.96 Million as of 2022.
5. What are some drivers contributing to market growth?
Rising Demand for Milled and Broken Rice; Growing Preference for Speciality Rice Variety; Government Initiatives Supports Rice Production.
6. What are the notable trends driving market growth?
Increasing demand for the cotton exports.
7. Are there any restraints impacting market growth?
Lack of Supply Chain for Rice; Growing Agricultural Labor Crisis.
8. Can you provide examples of recent developments in the market?
September 2022: The two first-ever new organic cotton varieties have been made available to farmers in India. These varieties were developed through a decentralized organic participatory breeding program of FiBL Switzerland and their partners.
9. What pricing options are available for accessing the report?
Pricing options include single-user, multi-user, and enterprise licenses priced at USD 4750, USD 5250, and USD 8750 respectively.
10. Is the market size provided in terms of value or volume?
The market size is provided in terms of value, measured in Million and volume, measured in Kiloton.
11. Are there any specific market keywords associated with the report?
Yes, the market keyword associated with the report is "Cotton Industry," which aids in identifying and referencing the specific market segment covered.
12. How do I determine which pricing option suits my needs best?
The pricing options vary based on user requirements and access needs. Individual users may opt for single-user licenses, while businesses requiring broader access may choose multi-user or enterprise licenses for cost-effective access to the report.
13. Are there any additional resources or data provided in the Cotton Industry report?
While the report offers comprehensive insights, it's advisable to review the specific contents or supplementary materials provided to ascertain if additional resources or data are available.
14. How can I stay updated on further developments or reports in the Cotton Industry?
To stay informed about further developments, trends, and reports in the Cotton Industry, consider subscribing to industry newsletters, following relevant companies and organizations, or regularly checking reputable industry news sources and publications.
Methodology
Step 1 - Identification of Relevant Samples Size from Population Database


Step 2 - Approaches for Defining Global Market Size (Value, Volume* & Price*)

Note*: In applicable scenarios
Step 3 - Data Sources
Primary Research
- Web Analytics
- Survey Reports
- Research Institute
- Latest Research Reports
- Opinion Leaders
Secondary Research
- Annual Reports
- White Paper
- Latest Press Release
- Industry Association
- Paid Database
- Investor Presentations

Step 4 - Data Triangulation
Involves using different sources of information in order to increase the validity of a study
These sources are likely to be stakeholders in a program - participants, other researchers, program staff, other community members, and so on.
Then we put all data in single framework & apply various statistical tools to find out the dynamic on the market.
During the analysis stage, feedback from the stakeholder groups would be compared to determine areas of agreement as well as areas of divergence


