

Key Insights
The global market for containers in the cosmetics industry is experiencing robust growth, driven by the increasing demand for cosmetics and personal care products worldwide. This expansion is fueled by several factors, including the rising disposable incomes in developing economies, the growing popularity of natural and organic cosmetics, and the increasing preference for convenient and travel-friendly packaging formats. The market is segmented by material type (glass, plastic, metal), product type (bottles, jars, tubes, pumps), and application (skincare, haircare, makeup). The plastic segment currently dominates due to its cost-effectiveness and versatility, while the demand for sustainable and eco-friendly packaging options, such as recycled and biodegradable materials, is steadily increasing. This shift towards sustainability is expected to drive innovation in packaging materials and designs in the coming years. Major players in the market are continually investing in research and development to improve packaging functionality, aesthetics, and environmental impact.
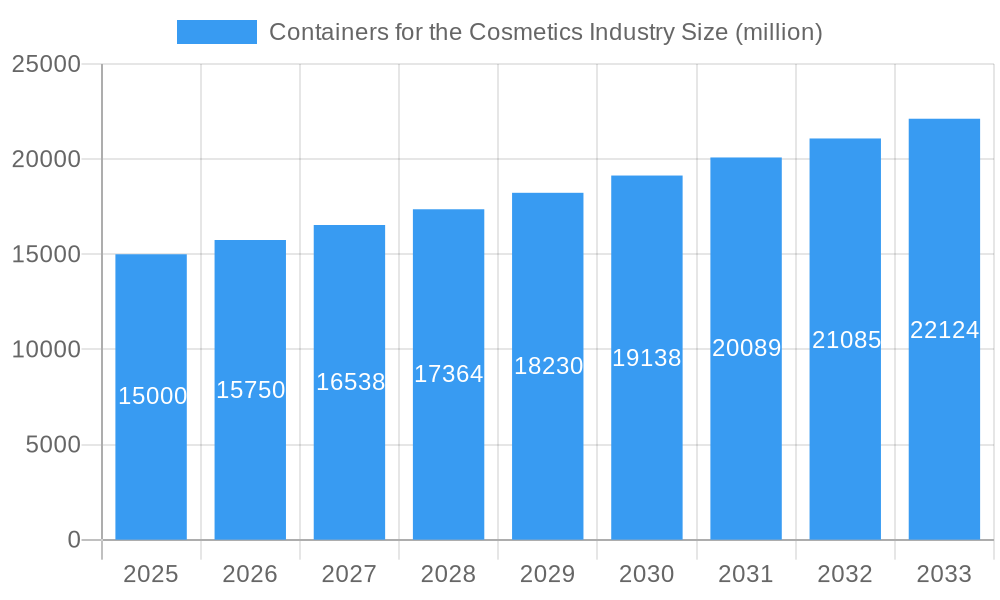
Containers for the Cosmetics Industry Market Size (In Billion)
Competition in this market is intense, with both established multinational corporations and smaller niche players vying for market share. Key players are focusing on strategic partnerships, mergers and acquisitions, and product innovation to maintain a competitive edge. Geographical growth is uneven, with North America and Europe currently holding significant market share. However, rapid economic growth and rising consumer spending in Asia-Pacific are expected to significantly boost the market's growth in this region in the forecast period. Despite these positive trends, the market faces challenges such as fluctuations in raw material prices and the increasing focus on regulatory compliance for packaging materials. The market is expected to maintain a healthy Compound Annual Growth Rate (CAGR) throughout the forecast period (2025-2033), indicating a positive outlook for the industry. We estimate the market size in 2025 to be $15 billion, with a CAGR of 5% projecting a market size of approximately $23 billion by 2033.
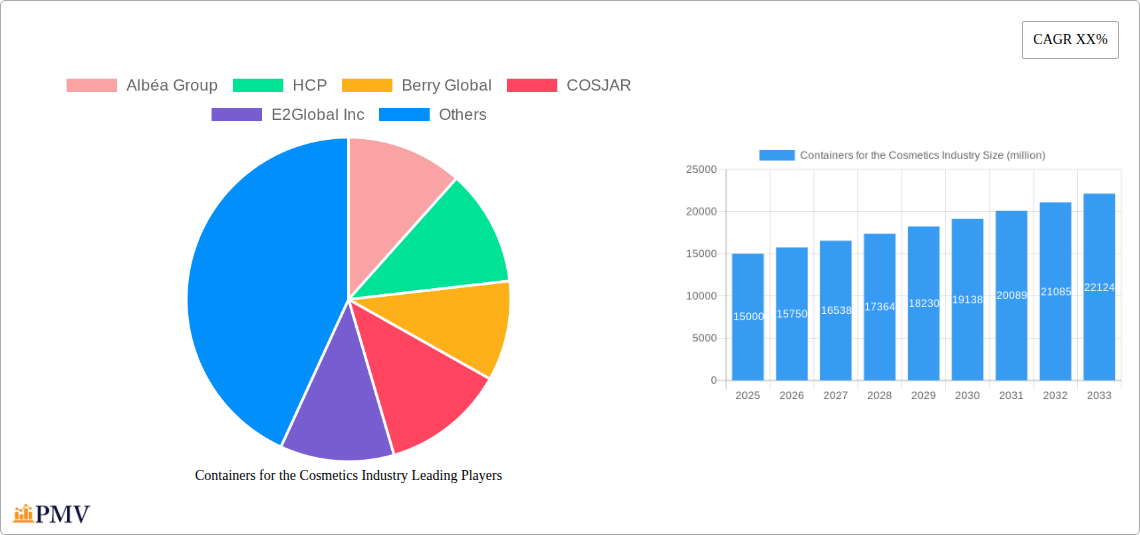
Containers for the Cosmetics Industry Company Market Share
Containers for the Cosmetics Industry: A Comprehensive Market Report (2019-2033)
This in-depth report provides a comprehensive analysis of the global Containers for the Cosmetics Industry market, offering invaluable insights for stakeholders seeking to navigate this dynamic landscape. The study period spans from 2019 to 2033, with 2025 serving as both the base and estimated year. The report meticulously analyzes market size, growth drivers, challenges, competitive dynamics, and future opportunities, incorporating data from the historical period (2019-2024) and providing detailed forecasts for the period 2025-2033. With a focus on key players such as Albéa Group, HCP, Berry Global, and others, this report is an essential resource for businesses, investors, and researchers seeking to understand and capitalize on the evolving cosmetics packaging market. The global market size is predicted to reach xx million by 2033.
Containers for the Cosmetics Industry Market Structure & Competitive Dynamics
The global Containers for the Cosmetics Industry market exhibits a moderately concentrated structure, with several major players holding significant market share. Albéa Group, HCP, and Berry Global are among the leading companies, collectively accounting for an estimated xx million in revenue and approximately xx% of the total market share in 2025. The market is characterized by intense competition, driven by product innovation, cost optimization strategies, and strategic mergers and acquisitions (M&A). Over the historical period, M&A activity within the sector totalled an estimated xx million, primarily focused on expanding product portfolios and geographical reach.
- Market Concentration: High, with top 5 players holding xx% of market share.
- Innovation Ecosystems: Significant R&D investment in sustainable and innovative packaging solutions.
- Regulatory Frameworks: Growing emphasis on compliance with environmental regulations and safety standards.
- Product Substitutes: Increased competition from bio-based and recyclable materials.
- End-User Trends: Shift towards eco-friendly and personalized packaging.
- M&A Activities: Consistent M&A activity focused on expansion and diversification, totaling xx million between 2019 and 2024.
Containers for the Cosmetics Industry Industry Trends & Insights
The Containers for the Cosmetics Industry market is experiencing robust growth, driven by several key factors. The rising demand for cosmetics and personal care products globally is a significant growth catalyst. The increasing preference for sustainable and eco-friendly packaging solutions is also pushing market expansion. Technological advancements, such as the development of lightweight and innovative materials, are further contributing to market growth. Consumer preferences are increasingly shifting towards personalized and convenient packaging formats. The market is expected to exhibit a Compound Annual Growth Rate (CAGR) of xx% during the forecast period (2025-2033), with market penetration expected to reach xx% by 2033. Competitive dynamics are shaped by continuous innovation, brand loyalty, and pricing strategies.
Dominant Markets & Segments in Containers for the Cosmetics Industry
The North American region currently dominates the Containers for the Cosmetics Industry market, accounting for approximately xx million in revenue and xx% of the global market share in 2025. This dominance is attributed to several factors:
- Strong Consumer Base: High per capita consumption of cosmetics and personal care products.
- Advanced Infrastructure: Well-established supply chains and distribution networks.
- Favorable Economic Conditions: Strong disposable incomes and consumer spending power.
- Technological Advancements: High adoption of advanced packaging technologies.
Europe and Asia Pacific are also significant markets, experiencing substantial growth fueled by rising disposable incomes and increasing awareness of beauty and personal care.
Containers for the Cosmetics Industry Product Innovations
Recent product innovations focus on sustainable materials like recycled plastics and bio-based polymers, along with improved barrier properties to enhance product shelf life. Smart packaging incorporating technologies like QR codes for enhanced consumer engagement is gaining traction. These innovations offer competitive advantages through reduced environmental impact, improved product protection, and enhanced consumer experience. The market sees a growing trend toward lightweighting, reducing transportation costs and carbon footprint.
Report Segmentation & Scope
The report segments the Containers for the Cosmetics Industry market based on material type (plastic, glass, metal, others), product type (bottles, jars, tubes, pumps, caps & closures), application (skincare, haircare, makeup, fragrances), and region (North America, Europe, Asia Pacific, Middle East & Africa, South America). Each segment's growth projections, market size, and competitive dynamics are thoroughly analyzed. For instance, the plastic segment holds the largest market share, driven by its cost-effectiveness and versatility. However, the growth of sustainable packaging options is challenging its dominance.
Key Drivers of Containers for the Cosmetics Industry Growth
Several factors fuel the market's expansion: the rising global demand for cosmetics and personal care products, driven by increasing disposable incomes and changing lifestyles; the growing preference for sustainable and eco-friendly packaging, influenced by heightened environmental awareness; continuous technological advancements leading to innovative packaging solutions; and stringent regulatory frameworks promoting sustainable practices within the industry. These factors collectively contribute to a positive growth trajectory for the Containers for the Cosmetics Industry market.
Challenges in the Containers for the Cosmetics Industry Sector
The industry faces challenges including fluctuating raw material prices impacting production costs, stringent environmental regulations demanding compliance, supply chain disruptions impacting timely product delivery, and intense competition requiring constant innovation to maintain market share. These factors can negatively impact profitability and growth, necessitating agile strategies for mitigation.
Leading Players in the Containers for the Cosmetics Industry Market
- Albéa Group
- HCP
- Berry Global
- COSJAR
- E2Global Inc
- EPOPACK Co
- Weltrade Packaging
- Silgan Holdings
- ACME Cosmetic Components
- Cosmetic Packaging Now, LLC
- CKS Packaging Inc
- Aman Industry Co
- Libo Cosmetics Co
- Integrity Cosmetic Container Industrial Co
Key Developments in Containers for the Cosmetics Industry Sector
- January 2023: Albéa Group launched a new line of sustainable, recyclable packaging.
- March 2022: Berry Global acquired a smaller packaging company, expanding its market reach.
- June 2021: HCP introduced innovative airless pumps to improve product preservation.
- (Further developments can be added here)
Strategic Containers for the Cosmetics Industry Market Outlook
The Containers for the Cosmetics Industry market presents significant growth potential, driven by increasing demand, technological advancements, and a shift towards sustainable practices. Strategic opportunities exist in developing innovative, eco-friendly packaging solutions, expanding into emerging markets, and leveraging digital technologies to enhance consumer engagement. Companies focused on sustainability and personalization are poised for significant growth in the coming years.
Containers for the Cosmetics Industry Segmentation
-
1. Application
- 1.1. Online Sales
- 1.2. Offline Sales
-
2. Types
- 2.1. Boxes
- 2.2. Bottles
- 2.3. Tubes
- 2.4. Jars
- 2.5. Others
Containers for the Cosmetics Industry Segmentation By Geography
-
1. North America
- 1.1. United States
- 1.2. Canada
- 1.3. Mexico
-
2. South America
- 2.1. Brazil
- 2.2. Argentina
- 2.3. Rest of South America
-
3. Europe
- 3.1. United Kingdom
- 3.2. Germany
- 3.3. France
- 3.4. Italy
- 3.5. Spain
- 3.6. Russia
- 3.7. Benelux
- 3.8. Nordics
- 3.9. Rest of Europe
-
4. Middle East & Africa
- 4.1. Turkey
- 4.2. Israel
- 4.3. GCC
- 4.4. North Africa
- 4.5. South Africa
- 4.6. Rest of Middle East & Africa
-
5. Asia Pacific
- 5.1. China
- 5.2. India
- 5.3. Japan
- 5.4. South Korea
- 5.5. ASEAN
- 5.6. Oceania
- 5.7. Rest of Asia Pacific

Containers for the Cosmetics Industry Regional Market Share
Geographic Coverage of Containers for the Cosmetics Industry
Containers for the Cosmetics Industry REPORT HIGHLIGHTS
| Aspects | Details |
|---|---|
| Study Period | 2020-2034 |
| Base Year | 2025 |
| Estimated Year | 2026 |
| Forecast Period | 2026-2034 |
| Historical Period | 2020-2025 |
| Growth Rate | CAGR of 5.05% from 2020-2034 |
| Segmentation |
|
Table of Contents
- 1. Introduction
- 1.1. Research Scope
- 1.2. Market Segmentation
- 1.3. Research Methodology
- 1.4. Definitions and Assumptions
- 2. Executive Summary
- 2.1. Introduction
- 3. Market Dynamics
- 3.1. Introduction
- 3.2. Market Drivers
- 3.3. Market Restrains
- 3.4. Market Trends
- 4. Market Factor Analysis
- 4.1. Porters Five Forces
- 4.2. Supply/Value Chain
- 4.3. PESTEL analysis
- 4.4. Market Entropy
- 4.5. Patent/Trademark Analysis
- 5. Global Containers for the Cosmetics Industry Analysis, Insights and Forecast, 2020-2032
- 5.1. Market Analysis, Insights and Forecast - by Application
- 5.1.1. Online Sales
- 5.1.2. Offline Sales
- 5.2. Market Analysis, Insights and Forecast - by Types
- 5.2.1. Boxes
- 5.2.2. Bottles
- 5.2.3. Tubes
- 5.2.4. Jars
- 5.2.5. Others
- 5.3. Market Analysis, Insights and Forecast - by Region
- 5.3.1. North America
- 5.3.2. South America
- 5.3.3. Europe
- 5.3.4. Middle East & Africa
- 5.3.5. Asia Pacific
- 5.1. Market Analysis, Insights and Forecast - by Application
- 6. North America Containers for the Cosmetics Industry Analysis, Insights and Forecast, 2020-2032
- 6.1. Market Analysis, Insights and Forecast - by Application
- 6.1.1. Online Sales
- 6.1.2. Offline Sales
- 6.2. Market Analysis, Insights and Forecast - by Types
- 6.2.1. Boxes
- 6.2.2. Bottles
- 6.2.3. Tubes
- 6.2.4. Jars
- 6.2.5. Others
- 6.1. Market Analysis, Insights and Forecast - by Application
- 7. South America Containers for the Cosmetics Industry Analysis, Insights and Forecast, 2020-2032
- 7.1. Market Analysis, Insights and Forecast - by Application
- 7.1.1. Online Sales
- 7.1.2. Offline Sales
- 7.2. Market Analysis, Insights and Forecast - by Types
- 7.2.1. Boxes
- 7.2.2. Bottles
- 7.2.3. Tubes
- 7.2.4. Jars
- 7.2.5. Others
- 7.1. Market Analysis, Insights and Forecast - by Application
- 8. Europe Containers for the Cosmetics Industry Analysis, Insights and Forecast, 2020-2032
- 8.1. Market Analysis, Insights and Forecast - by Application
- 8.1.1. Online Sales
- 8.1.2. Offline Sales
- 8.2. Market Analysis, Insights and Forecast - by Types
- 8.2.1. Boxes
- 8.2.2. Bottles
- 8.2.3. Tubes
- 8.2.4. Jars
- 8.2.5. Others
- 8.1. Market Analysis, Insights and Forecast - by Application
- 9. Middle East & Africa Containers for the Cosmetics Industry Analysis, Insights and Forecast, 2020-2032
- 9.1. Market Analysis, Insights and Forecast - by Application
- 9.1.1. Online Sales
- 9.1.2. Offline Sales
- 9.2. Market Analysis, Insights and Forecast - by Types
- 9.2.1. Boxes
- 9.2.2. Bottles
- 9.2.3. Tubes
- 9.2.4. Jars
- 9.2.5. Others
- 9.1. Market Analysis, Insights and Forecast - by Application
- 10. Asia Pacific Containers for the Cosmetics Industry Analysis, Insights and Forecast, 2020-2032
- 10.1. Market Analysis, Insights and Forecast - by Application
- 10.1.1. Online Sales
- 10.1.2. Offline Sales
- 10.2. Market Analysis, Insights and Forecast - by Types
- 10.2.1. Boxes
- 10.2.2. Bottles
- 10.2.3. Tubes
- 10.2.4. Jars
- 10.2.5. Others
- 10.1. Market Analysis, Insights and Forecast - by Application
- 11. Competitive Analysis
- 11.1. Global Market Share Analysis 2025
- 11.2. Company Profiles
- 11.2.1 Albéa Group
- 11.2.1.1. Overview
- 11.2.1.2. Products
- 11.2.1.3. SWOT Analysis
- 11.2.1.4. Recent Developments
- 11.2.1.5. Financials (Based on Availability)
- 11.2.2 HCP
- 11.2.2.1. Overview
- 11.2.2.2. Products
- 11.2.2.3. SWOT Analysis
- 11.2.2.4. Recent Developments
- 11.2.2.5. Financials (Based on Availability)
- 11.2.3 Berry Global
- 11.2.3.1. Overview
- 11.2.3.2. Products
- 11.2.3.3. SWOT Analysis
- 11.2.3.4. Recent Developments
- 11.2.3.5. Financials (Based on Availability)
- 11.2.4 COSJAR
- 11.2.4.1. Overview
- 11.2.4.2. Products
- 11.2.4.3. SWOT Analysis
- 11.2.4.4. Recent Developments
- 11.2.4.5. Financials (Based on Availability)
- 11.2.5 E2Global Inc
- 11.2.5.1. Overview
- 11.2.5.2. Products
- 11.2.5.3. SWOT Analysis
- 11.2.5.4. Recent Developments
- 11.2.5.5. Financials (Based on Availability)
- 11.2.6 EPOPACK Co
- 11.2.6.1. Overview
- 11.2.6.2. Products
- 11.2.6.3. SWOT Analysis
- 11.2.6.4. Recent Developments
- 11.2.6.5. Financials (Based on Availability)
- 11.2.7 Weltrade Packaging
- 11.2.7.1. Overview
- 11.2.7.2. Products
- 11.2.7.3. SWOT Analysis
- 11.2.7.4. Recent Developments
- 11.2.7.5. Financials (Based on Availability)
- 11.2.8 Silgan Holdings
- 11.2.8.1. Overview
- 11.2.8.2. Products
- 11.2.8.3. SWOT Analysis
- 11.2.8.4. Recent Developments
- 11.2.8.5. Financials (Based on Availability)
- 11.2.9 ACME Cosmetic Components
- 11.2.9.1. Overview
- 11.2.9.2. Products
- 11.2.9.3. SWOT Analysis
- 11.2.9.4. Recent Developments
- 11.2.9.5. Financials (Based on Availability)
- 11.2.10 Cosmetic Packaging Now
- 11.2.10.1. Overview
- 11.2.10.2. Products
- 11.2.10.3. SWOT Analysis
- 11.2.10.4. Recent Developments
- 11.2.10.5. Financials (Based on Availability)
- 11.2.11 LLC
- 11.2.11.1. Overview
- 11.2.11.2. Products
- 11.2.11.3. SWOT Analysis
- 11.2.11.4. Recent Developments
- 11.2.11.5. Financials (Based on Availability)
- 11.2.12 CKS Packaging Inc
- 11.2.12.1. Overview
- 11.2.12.2. Products
- 11.2.12.3. SWOT Analysis
- 11.2.12.4. Recent Developments
- 11.2.12.5. Financials (Based on Availability)
- 11.2.13 Aman Industry Co
- 11.2.13.1. Overview
- 11.2.13.2. Products
- 11.2.13.3. SWOT Analysis
- 11.2.13.4. Recent Developments
- 11.2.13.5. Financials (Based on Availability)
- 11.2.14 Libo Cosmetics Co
- 11.2.14.1. Overview
- 11.2.14.2. Products
- 11.2.14.3. SWOT Analysis
- 11.2.14.4. Recent Developments
- 11.2.14.5. Financials (Based on Availability)
- 11.2.15 Integrity Cosmetic Container Industrial Co
- 11.2.15.1. Overview
- 11.2.15.2. Products
- 11.2.15.3. SWOT Analysis
- 11.2.15.4. Recent Developments
- 11.2.15.5. Financials (Based on Availability)
- 11.2.1 Albéa Group
List of Figures
- Figure 1: Global Containers for the Cosmetics Industry Revenue Breakdown (undefined, %) by Region 2025 & 2033
- Figure 2: Global Containers for the Cosmetics Industry Volume Breakdown (K, %) by Region 2025 & 2033
- Figure 3: North America Containers for the Cosmetics Industry Revenue (undefined), by Application 2025 & 2033
- Figure 4: North America Containers for the Cosmetics Industry Volume (K), by Application 2025 & 2033
- Figure 5: North America Containers for the Cosmetics Industry Revenue Share (%), by Application 2025 & 2033
- Figure 6: North America Containers for the Cosmetics Industry Volume Share (%), by Application 2025 & 2033
- Figure 7: North America Containers for the Cosmetics Industry Revenue (undefined), by Types 2025 & 2033
- Figure 8: North America Containers for the Cosmetics Industry Volume (K), by Types 2025 & 2033
- Figure 9: North America Containers for the Cosmetics Industry Revenue Share (%), by Types 2025 & 2033
- Figure 10: North America Containers for the Cosmetics Industry Volume Share (%), by Types 2025 & 2033
- Figure 11: North America Containers for the Cosmetics Industry Revenue (undefined), by Country 2025 & 2033
- Figure 12: North America Containers for the Cosmetics Industry Volume (K), by Country 2025 & 2033
- Figure 13: North America Containers for the Cosmetics Industry Revenue Share (%), by Country 2025 & 2033
- Figure 14: North America Containers for the Cosmetics Industry Volume Share (%), by Country 2025 & 2033
- Figure 15: South America Containers for the Cosmetics Industry Revenue (undefined), by Application 2025 & 2033
- Figure 16: South America Containers for the Cosmetics Industry Volume (K), by Application 2025 & 2033
- Figure 17: South America Containers for the Cosmetics Industry Revenue Share (%), by Application 2025 & 2033
- Figure 18: South America Containers for the Cosmetics Industry Volume Share (%), by Application 2025 & 2033
- Figure 19: South America Containers for the Cosmetics Industry Revenue (undefined), by Types 2025 & 2033
- Figure 20: South America Containers for the Cosmetics Industry Volume (K), by Types 2025 & 2033
- Figure 21: South America Containers for the Cosmetics Industry Revenue Share (%), by Types 2025 & 2033
- Figure 22: South America Containers for the Cosmetics Industry Volume Share (%), by Types 2025 & 2033
- Figure 23: South America Containers for the Cosmetics Industry Revenue (undefined), by Country 2025 & 2033
- Figure 24: South America Containers for the Cosmetics Industry Volume (K), by Country 2025 & 2033
- Figure 25: South America Containers for the Cosmetics Industry Revenue Share (%), by Country 2025 & 2033
- Figure 26: South America Containers for the Cosmetics Industry Volume Share (%), by Country 2025 & 2033
- Figure 27: Europe Containers for the Cosmetics Industry Revenue (undefined), by Application 2025 & 2033
- Figure 28: Europe Containers for the Cosmetics Industry Volume (K), by Application 2025 & 2033
- Figure 29: Europe Containers for the Cosmetics Industry Revenue Share (%), by Application 2025 & 2033
- Figure 30: Europe Containers for the Cosmetics Industry Volume Share (%), by Application 2025 & 2033
- Figure 31: Europe Containers for the Cosmetics Industry Revenue (undefined), by Types 2025 & 2033
- Figure 32: Europe Containers for the Cosmetics Industry Volume (K), by Types 2025 & 2033
- Figure 33: Europe Containers for the Cosmetics Industry Revenue Share (%), by Types 2025 & 2033
- Figure 34: Europe Containers for the Cosmetics Industry Volume Share (%), by Types 2025 & 2033
- Figure 35: Europe Containers for the Cosmetics Industry Revenue (undefined), by Country 2025 & 2033
- Figure 36: Europe Containers for the Cosmetics Industry Volume (K), by Country 2025 & 2033
- Figure 37: Europe Containers for the Cosmetics Industry Revenue Share (%), by Country 2025 & 2033
- Figure 38: Europe Containers for the Cosmetics Industry Volume Share (%), by Country 2025 & 2033
- Figure 39: Middle East & Africa Containers for the Cosmetics Industry Revenue (undefined), by Application 2025 & 2033
- Figure 40: Middle East & Africa Containers for the Cosmetics Industry Volume (K), by Application 2025 & 2033
- Figure 41: Middle East & Africa Containers for the Cosmetics Industry Revenue Share (%), by Application 2025 & 2033
- Figure 42: Middle East & Africa Containers for the Cosmetics Industry Volume Share (%), by Application 2025 & 2033
- Figure 43: Middle East & Africa Containers for the Cosmetics Industry Revenue (undefined), by Types 2025 & 2033
- Figure 44: Middle East & Africa Containers for the Cosmetics Industry Volume (K), by Types 2025 & 2033
- Figure 45: Middle East & Africa Containers for the Cosmetics Industry Revenue Share (%), by Types 2025 & 2033
- Figure 46: Middle East & Africa Containers for the Cosmetics Industry Volume Share (%), by Types 2025 & 2033
- Figure 47: Middle East & Africa Containers for the Cosmetics Industry Revenue (undefined), by Country 2025 & 2033
- Figure 48: Middle East & Africa Containers for the Cosmetics Industry Volume (K), by Country 2025 & 2033
- Figure 49: Middle East & Africa Containers for the Cosmetics Industry Revenue Share (%), by Country 2025 & 2033
- Figure 50: Middle East & Africa Containers for the Cosmetics Industry Volume Share (%), by Country 2025 & 2033
- Figure 51: Asia Pacific Containers for the Cosmetics Industry Revenue (undefined), by Application 2025 & 2033
- Figure 52: Asia Pacific Containers for the Cosmetics Industry Volume (K), by Application 2025 & 2033
- Figure 53: Asia Pacific Containers for the Cosmetics Industry Revenue Share (%), by Application 2025 & 2033
- Figure 54: Asia Pacific Containers for the Cosmetics Industry Volume Share (%), by Application 2025 & 2033
- Figure 55: Asia Pacific Containers for the Cosmetics Industry Revenue (undefined), by Types 2025 & 2033
- Figure 56: Asia Pacific Containers for the Cosmetics Industry Volume (K), by Types 2025 & 2033
- Figure 57: Asia Pacific Containers for the Cosmetics Industry Revenue Share (%), by Types 2025 & 2033
- Figure 58: Asia Pacific Containers for the Cosmetics Industry Volume Share (%), by Types 2025 & 2033
- Figure 59: Asia Pacific Containers for the Cosmetics Industry Revenue (undefined), by Country 2025 & 2033
- Figure 60: Asia Pacific Containers for the Cosmetics Industry Volume (K), by Country 2025 & 2033
- Figure 61: Asia Pacific Containers for the Cosmetics Industry Revenue Share (%), by Country 2025 & 2033
- Figure 62: Asia Pacific Containers for the Cosmetics Industry Volume Share (%), by Country 2025 & 2033
List of Tables
- Table 1: Global Containers for the Cosmetics Industry Revenue undefined Forecast, by Application 2020 & 2033
- Table 2: Global Containers for the Cosmetics Industry Volume K Forecast, by Application 2020 & 2033
- Table 3: Global Containers for the Cosmetics Industry Revenue undefined Forecast, by Types 2020 & 2033
- Table 4: Global Containers for the Cosmetics Industry Volume K Forecast, by Types 2020 & 2033
- Table 5: Global Containers for the Cosmetics Industry Revenue undefined Forecast, by Region 2020 & 2033
- Table 6: Global Containers for the Cosmetics Industry Volume K Forecast, by Region 2020 & 2033
- Table 7: Global Containers for the Cosmetics Industry Revenue undefined Forecast, by Application 2020 & 2033
- Table 8: Global Containers for the Cosmetics Industry Volume K Forecast, by Application 2020 & 2033
- Table 9: Global Containers for the Cosmetics Industry Revenue undefined Forecast, by Types 2020 & 2033
- Table 10: Global Containers for the Cosmetics Industry Volume K Forecast, by Types 2020 & 2033
- Table 11: Global Containers for the Cosmetics Industry Revenue undefined Forecast, by Country 2020 & 2033
- Table 12: Global Containers for the Cosmetics Industry Volume K Forecast, by Country 2020 & 2033
- Table 13: United States Containers for the Cosmetics Industry Revenue (undefined) Forecast, by Application 2020 & 2033
- Table 14: United States Containers for the Cosmetics Industry Volume (K) Forecast, by Application 2020 & 2033
- Table 15: Canada Containers for the Cosmetics Industry Revenue (undefined) Forecast, by Application 2020 & 2033
- Table 16: Canada Containers for the Cosmetics Industry Volume (K) Forecast, by Application 2020 & 2033
- Table 17: Mexico Containers for the Cosmetics Industry Revenue (undefined) Forecast, by Application 2020 & 2033
- Table 18: Mexico Containers for the Cosmetics Industry Volume (K) Forecast, by Application 2020 & 2033
- Table 19: Global Containers for the Cosmetics Industry Revenue undefined Forecast, by Application 2020 & 2033
- Table 20: Global Containers for the Cosmetics Industry Volume K Forecast, by Application 2020 & 2033
- Table 21: Global Containers for the Cosmetics Industry Revenue undefined Forecast, by Types 2020 & 2033
- Table 22: Global Containers for the Cosmetics Industry Volume K Forecast, by Types 2020 & 2033
- Table 23: Global Containers for the Cosmetics Industry Revenue undefined Forecast, by Country 2020 & 2033
- Table 24: Global Containers for the Cosmetics Industry Volume K Forecast, by Country 2020 & 2033
- Table 25: Brazil Containers for the Cosmetics Industry Revenue (undefined) Forecast, by Application 2020 & 2033
- Table 26: Brazil Containers for the Cosmetics Industry Volume (K) Forecast, by Application 2020 & 2033
- Table 27: Argentina Containers for the Cosmetics Industry Revenue (undefined) Forecast, by Application 2020 & 2033
- Table 28: Argentina Containers for the Cosmetics Industry Volume (K) Forecast, by Application 2020 & 2033
- Table 29: Rest of South America Containers for the Cosmetics Industry Revenue (undefined) Forecast, by Application 2020 & 2033
- Table 30: Rest of South America Containers for the Cosmetics Industry Volume (K) Forecast, by Application 2020 & 2033
- Table 31: Global Containers for the Cosmetics Industry Revenue undefined Forecast, by Application 2020 & 2033
- Table 32: Global Containers for the Cosmetics Industry Volume K Forecast, by Application 2020 & 2033
- Table 33: Global Containers for the Cosmetics Industry Revenue undefined Forecast, by Types 2020 & 2033
- Table 34: Global Containers for the Cosmetics Industry Volume K Forecast, by Types 2020 & 2033
- Table 35: Global Containers for the Cosmetics Industry Revenue undefined Forecast, by Country 2020 & 2033
- Table 36: Global Containers for the Cosmetics Industry Volume K Forecast, by Country 2020 & 2033
- Table 37: United Kingdom Containers for the Cosmetics Industry Revenue (undefined) Forecast, by Application 2020 & 2033
- Table 38: United Kingdom Containers for the Cosmetics Industry Volume (K) Forecast, by Application 2020 & 2033
- Table 39: Germany Containers for the Cosmetics Industry Revenue (undefined) Forecast, by Application 2020 & 2033
- Table 40: Germany Containers for the Cosmetics Industry Volume (K) Forecast, by Application 2020 & 2033
- Table 41: France Containers for the Cosmetics Industry Revenue (undefined) Forecast, by Application 2020 & 2033
- Table 42: France Containers for the Cosmetics Industry Volume (K) Forecast, by Application 2020 & 2033
- Table 43: Italy Containers for the Cosmetics Industry Revenue (undefined) Forecast, by Application 2020 & 2033
- Table 44: Italy Containers for the Cosmetics Industry Volume (K) Forecast, by Application 2020 & 2033
- Table 45: Spain Containers for the Cosmetics Industry Revenue (undefined) Forecast, by Application 2020 & 2033
- Table 46: Spain Containers for the Cosmetics Industry Volume (K) Forecast, by Application 2020 & 2033
- Table 47: Russia Containers for the Cosmetics Industry Revenue (undefined) Forecast, by Application 2020 & 2033
- Table 48: Russia Containers for the Cosmetics Industry Volume (K) Forecast, by Application 2020 & 2033
- Table 49: Benelux Containers for the Cosmetics Industry Revenue (undefined) Forecast, by Application 2020 & 2033
- Table 50: Benelux Containers for the Cosmetics Industry Volume (K) Forecast, by Application 2020 & 2033
- Table 51: Nordics Containers for the Cosmetics Industry Revenue (undefined) Forecast, by Application 2020 & 2033
- Table 52: Nordics Containers for the Cosmetics Industry Volume (K) Forecast, by Application 2020 & 2033
- Table 53: Rest of Europe Containers for the Cosmetics Industry Revenue (undefined) Forecast, by Application 2020 & 2033
- Table 54: Rest of Europe Containers for the Cosmetics Industry Volume (K) Forecast, by Application 2020 & 2033
- Table 55: Global Containers for the Cosmetics Industry Revenue undefined Forecast, by Application 2020 & 2033
- Table 56: Global Containers for the Cosmetics Industry Volume K Forecast, by Application 2020 & 2033
- Table 57: Global Containers for the Cosmetics Industry Revenue undefined Forecast, by Types 2020 & 2033
- Table 58: Global Containers for the Cosmetics Industry Volume K Forecast, by Types 2020 & 2033
- Table 59: Global Containers for the Cosmetics Industry Revenue undefined Forecast, by Country 2020 & 2033
- Table 60: Global Containers for the Cosmetics Industry Volume K Forecast, by Country 2020 & 2033
- Table 61: Turkey Containers for the Cosmetics Industry Revenue (undefined) Forecast, by Application 2020 & 2033
- Table 62: Turkey Containers for the Cosmetics Industry Volume (K) Forecast, by Application 2020 & 2033
- Table 63: Israel Containers for the Cosmetics Industry Revenue (undefined) Forecast, by Application 2020 & 2033
- Table 64: Israel Containers for the Cosmetics Industry Volume (K) Forecast, by Application 2020 & 2033
- Table 65: GCC Containers for the Cosmetics Industry Revenue (undefined) Forecast, by Application 2020 & 2033
- Table 66: GCC Containers for the Cosmetics Industry Volume (K) Forecast, by Application 2020 & 2033
- Table 67: North Africa Containers for the Cosmetics Industry Revenue (undefined) Forecast, by Application 2020 & 2033
- Table 68: North Africa Containers for the Cosmetics Industry Volume (K) Forecast, by Application 2020 & 2033
- Table 69: South Africa Containers for the Cosmetics Industry Revenue (undefined) Forecast, by Application 2020 & 2033
- Table 70: South Africa Containers for the Cosmetics Industry Volume (K) Forecast, by Application 2020 & 2033
- Table 71: Rest of Middle East & Africa Containers for the Cosmetics Industry Revenue (undefined) Forecast, by Application 2020 & 2033
- Table 72: Rest of Middle East & Africa Containers for the Cosmetics Industry Volume (K) Forecast, by Application 2020 & 2033
- Table 73: Global Containers for the Cosmetics Industry Revenue undefined Forecast, by Application 2020 & 2033
- Table 74: Global Containers for the Cosmetics Industry Volume K Forecast, by Application 2020 & 2033
- Table 75: Global Containers for the Cosmetics Industry Revenue undefined Forecast, by Types 2020 & 2033
- Table 76: Global Containers for the Cosmetics Industry Volume K Forecast, by Types 2020 & 2033
- Table 77: Global Containers for the Cosmetics Industry Revenue undefined Forecast, by Country 2020 & 2033
- Table 78: Global Containers for the Cosmetics Industry Volume K Forecast, by Country 2020 & 2033
- Table 79: China Containers for the Cosmetics Industry Revenue (undefined) Forecast, by Application 2020 & 2033
- Table 80: China Containers for the Cosmetics Industry Volume (K) Forecast, by Application 2020 & 2033
- Table 81: India Containers for the Cosmetics Industry Revenue (undefined) Forecast, by Application 2020 & 2033
- Table 82: India Containers for the Cosmetics Industry Volume (K) Forecast, by Application 2020 & 2033
- Table 83: Japan Containers for the Cosmetics Industry Revenue (undefined) Forecast, by Application 2020 & 2033
- Table 84: Japan Containers for the Cosmetics Industry Volume (K) Forecast, by Application 2020 & 2033
- Table 85: South Korea Containers for the Cosmetics Industry Revenue (undefined) Forecast, by Application 2020 & 2033
- Table 86: South Korea Containers for the Cosmetics Industry Volume (K) Forecast, by Application 2020 & 2033
- Table 87: ASEAN Containers for the Cosmetics Industry Revenue (undefined) Forecast, by Application 2020 & 2033
- Table 88: ASEAN Containers for the Cosmetics Industry Volume (K) Forecast, by Application 2020 & 2033
- Table 89: Oceania Containers for the Cosmetics Industry Revenue (undefined) Forecast, by Application 2020 & 2033
- Table 90: Oceania Containers for the Cosmetics Industry Volume (K) Forecast, by Application 2020 & 2033
- Table 91: Rest of Asia Pacific Containers for the Cosmetics Industry Revenue (undefined) Forecast, by Application 2020 & 2033
- Table 92: Rest of Asia Pacific Containers for the Cosmetics Industry Volume (K) Forecast, by Application 2020 & 2033
Frequently Asked Questions
1. What is the projected Compound Annual Growth Rate (CAGR) of the Containers for the Cosmetics Industry?
The projected CAGR is approximately 5.05%.
2. Which companies are prominent players in the Containers for the Cosmetics Industry?
Key companies in the market include Albéa Group, HCP, Berry Global, COSJAR, E2Global Inc, EPOPACK Co, Weltrade Packaging, Silgan Holdings, ACME Cosmetic Components, Cosmetic Packaging Now, LLC, CKS Packaging Inc, Aman Industry Co, Libo Cosmetics Co, Integrity Cosmetic Container Industrial Co.
3. What are the main segments of the Containers for the Cosmetics Industry?
The market segments include Application, Types.
4. Can you provide details about the market size?
The market size is estimated to be USD XXX N/A as of 2022.
5. What are some drivers contributing to market growth?
N/A
6. What are the notable trends driving market growth?
N/A
7. Are there any restraints impacting market growth?
N/A
8. Can you provide examples of recent developments in the market?
N/A
9. What pricing options are available for accessing the report?
Pricing options include single-user, multi-user, and enterprise licenses priced at USD 3950.00, USD 5925.00, and USD 7900.00 respectively.
10. Is the market size provided in terms of value or volume?
The market size is provided in terms of value, measured in N/A and volume, measured in K.
11. Are there any specific market keywords associated with the report?
Yes, the market keyword associated with the report is "Containers for the Cosmetics Industry," which aids in identifying and referencing the specific market segment covered.
12. How do I determine which pricing option suits my needs best?
The pricing options vary based on user requirements and access needs. Individual users may opt for single-user licenses, while businesses requiring broader access may choose multi-user or enterprise licenses for cost-effective access to the report.
13. Are there any additional resources or data provided in the Containers for the Cosmetics Industry report?
While the report offers comprehensive insights, it's advisable to review the specific contents or supplementary materials provided to ascertain if additional resources or data are available.
14. How can I stay updated on further developments or reports in the Containers for the Cosmetics Industry?
To stay informed about further developments, trends, and reports in the Containers for the Cosmetics Industry, consider subscribing to industry newsletters, following relevant companies and organizations, or regularly checking reputable industry news sources and publications.
Methodology
Step 1 - Identification of Relevant Samples Size from Population Database


Step 2 - Approaches for Defining Global Market Size (Value, Volume* & Price*)

Note*: In applicable scenarios
Step 3 - Data Sources
Primary Research
- Web Analytics
- Survey Reports
- Research Institute
- Latest Research Reports
- Opinion Leaders
Secondary Research
- Annual Reports
- White Paper
- Latest Press Release
- Industry Association
- Paid Database
- Investor Presentations

Step 4 - Data Triangulation
Involves using different sources of information in order to increase the validity of a study
These sources are likely to be stakeholders in a program - participants, other researchers, program staff, other community members, and so on.
Then we put all data in single framework & apply various statistical tools to find out the dynamic on the market.
During the analysis stage, feedback from the stakeholder groups would be compared to determine areas of agreement as well as areas of divergence