

Key Insights
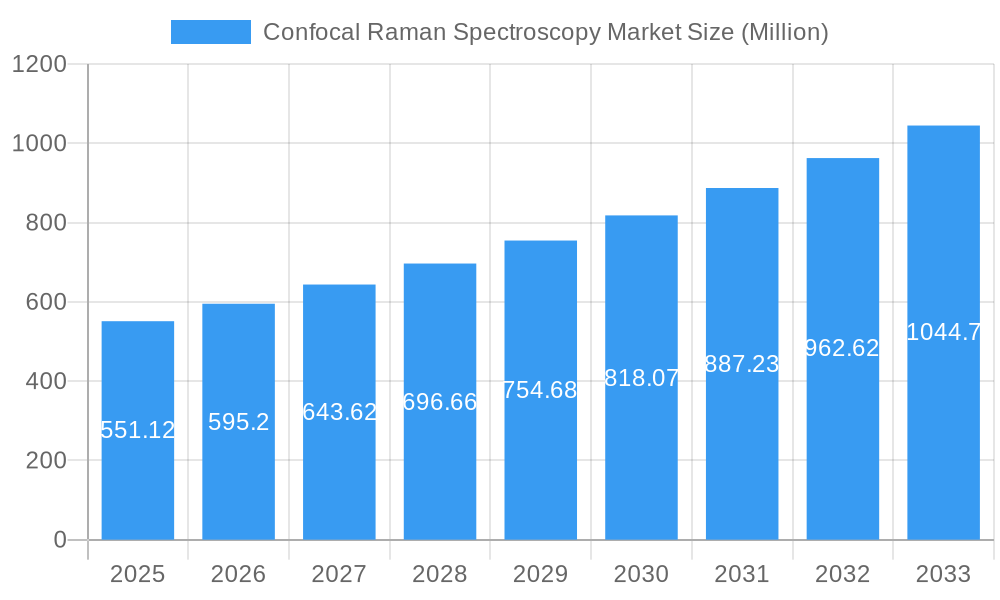
The Confocal Raman Spectroscopy market is experiencing robust growth, projected to reach \$551.12 million in 2025 and maintain a compound annual growth rate (CAGR) of 8.00% from 2025 to 2033. This expansion is driven by several key factors. Advancements in instrumentation, leading to enhanced sensitivity, resolution, and speed, are significantly impacting the market. The increasing adoption of confocal Raman spectroscopy across diverse scientific fields, including materials science, life sciences, and pharmaceutical research, is fueling demand. Specifically, the ability to perform non-destructive, high-resolution chemical imaging at the microscopic level is proving invaluable in various applications, such as drug discovery, disease diagnostics, and quality control in manufacturing. Furthermore, the development of user-friendly software and data analysis tools is making confocal Raman spectroscopy more accessible to a broader range of users, further stimulating market growth.
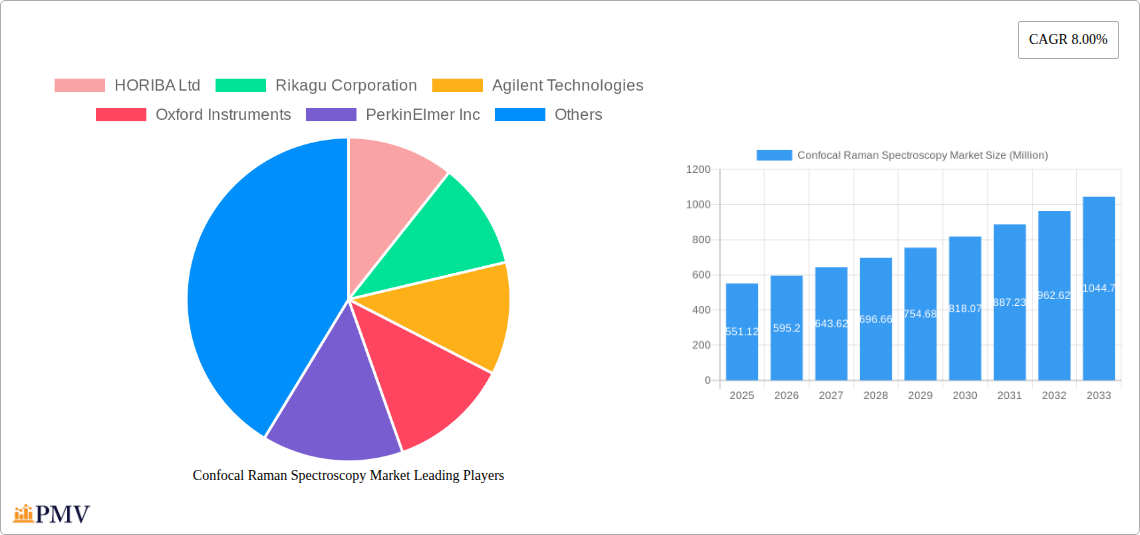
Confocal Raman Spectroscopy Market Market Size (In Million)
However, the market also faces certain challenges. High initial investment costs associated with acquiring and maintaining sophisticated confocal Raman spectroscopy systems can be a barrier to entry for smaller research groups or businesses. Additionally, the complexity of data analysis and interpretation requires specialized expertise, potentially limiting wider adoption. Despite these limitations, the continuous development of miniaturized and more affordable systems, coupled with the growing need for advanced analytical techniques across multiple sectors, is expected to overcome these restraints and drive substantial market expansion in the coming years. Key players such as HORIBA Ltd, Rigaku Corporation, Agilent Technologies, and Thermo Fisher Scientific are actively investing in R&D and strategic collaborations to solidify their market positions and capitalize on emerging opportunities.
Confocal Raman Spectroscopy Market Company Market Share
Confocal Raman Spectroscopy Market: A Comprehensive Report (2019-2033)
This detailed report provides a comprehensive analysis of the Confocal Raman Spectroscopy market, offering actionable insights for stakeholders across the industry. The study period covers 2019-2033, with 2025 as the base and estimated year. The forecast period spans 2025-2033, and the historical period encompasses 2019-2024. The report incorporates market sizing, segmentation, competitive dynamics, and future growth projections, utilizing both qualitative and quantitative data.
Confocal Raman Spectroscopy Market Market Structure & Competitive Dynamics
The Confocal Raman Spectroscopy market exhibits a moderately consolidated structure, with key players holding significant market share. The market concentration is influenced by factors like technological advancements, regulatory landscapes, and the presence of established players like HORIBA Ltd, Rigaku Corporation, Agilent Technologies, Oxford Instruments, PerkinElmer Inc, Renishaw PLC, Bruker Corporation, Thermo Fisher Scientific Inc, Mettler Toledo, and Hamamatsu Photonics KK. However, the market also witnesses the emergence of innovative startups and smaller players, leading to a dynamic competitive landscape.
The innovation ecosystem within the market is robust, driven by continuous R&D efforts focused on enhancing spectral resolution, improving sensitivity, and expanding applications. Regulatory frameworks vary across different geographies, impacting market access and product approvals. The market also faces competitive pressure from alternative analytical techniques, although Confocal Raman Spectroscopy maintains a strong position due to its unique capabilities. End-user trends reveal a growing preference for integrated, user-friendly systems with advanced data analysis capabilities.
Mergers and acquisitions (M&A) activities play a crucial role in shaping the market landscape. Recent deals, such as Bruker Corporation's acquisition of Nanophoton Corporation in February 2024, demonstrate the strategic importance of expanding product portfolios and gaining access to cutting-edge technologies. The value of these M&A transactions varies significantly, ranging from xx Million to xx Million depending on the size and strategic importance of the acquired entity. The market share held by the top 5 players is estimated at approximately xx%, indicating a moderate level of consolidation.
Confocal Raman Spectroscopy Market Industry Trends & Insights
The Confocal Raman Spectroscopy market is experiencing significant growth, driven by factors such as increasing demand from various end-use industries, technological advancements leading to improved system performance and ease of use, and rising research and development activities in fields like life sciences, materials science, and nanotechnology. The market is projected to witness a Compound Annual Growth Rate (CAGR) of xx% during the forecast period (2025-2033). This growth is further fueled by the increasing adoption of confocal Raman spectroscopy in various applications, including drug discovery, materials characterization, and environmental monitoring.
Technological disruptions are playing a key role in shaping market trends. The development of portable and handheld Raman spectrometers, along with advancements in data analysis software, is increasing the accessibility and usability of the technology. Consumer preferences are shifting towards systems offering high sensitivity, improved resolution, and faster data acquisition times. Competitive dynamics are marked by intense R&D efforts, strategic alliances, and acquisitions aimed at enhancing market share and broadening product offerings. Market penetration is steadily increasing across various sectors, with significant growth expected in emerging economies driven by rising investments in research infrastructure and technological advancements.
Dominant Markets & Segments in Confocal Raman Spectroscopy Market
The North American region currently holds the leading position in the Confocal Raman Spectroscopy market. This dominance is attributed to several key factors:
- Strong Research and Development Investments: Significant investments in research and development in the life sciences, materials science, and pharmaceutical sectors fuel the demand for advanced analytical techniques like confocal Raman spectroscopy.
- Well-Established Healthcare Infrastructure: A robust and well-established healthcare infrastructure facilitates the adoption of advanced analytical tools for disease diagnosis and treatment.
- High Adoption Rate in Academic Institutions: A high concentration of research universities and institutes significantly boosts the demand for confocal Raman spectroscopy systems.
This region's continued dominance is expected due to sustained R&D investments and the increasing adoption of the technology in various industries. However, the Asia-Pacific region is emerging as a fast-growing market due to its rapidly expanding economies and increasing focus on scientific research.
Confocal Raman Spectroscopy Market Product Innovations
Recent product developments have focused on enhancing system performance, miniaturization, and ease of use. Innovations like integrated software for advanced data analysis and the development of handheld devices have broadened the accessibility of confocal Raman spectroscopy. These advancements are driven by technological trends towards increased sensitivity, improved resolution, and faster data acquisition times, addressing market demand for cost-effective and user-friendly solutions. Competitive advantages are gained through unique features such as integrated workflows, superior signal-to-noise ratios, and versatile application options.
Report Segmentation & Scope
The Confocal Raman Spectroscopy market is segmented by several key parameters:
By Technique: This segment includes different spectroscopic techniques like point scanning, line scanning, and hyperspectral imaging. Each technique offers unique capabilities and applications, with varying growth projections and competitive dynamics. Market size and growth projections vary significantly across these techniques.
By Application: Key applications include life sciences, materials science, pharmaceuticals, and environmental monitoring. The life sciences segment is expected to hold the largest share, while others are experiencing rapid growth.
By End-User: This includes academic institutions, research laboratories, pharmaceutical companies, and industrial manufacturers. Growth projections differ significantly among these end-users.
This detailed segmentation allows for a granular understanding of the market, enabling tailored strategies for different players and industry segments.
Key Drivers of Confocal Raman Spectroscopy Market Growth
Several factors are driving the growth of the Confocal Raman Spectroscopy market. Technological advancements leading to improved sensitivity, resolution, and portability are significantly boosting adoption rates. Growing research and development activities across various sectors, particularly in life sciences and materials science, fuel demand for this advanced analytical technique. Furthermore, favorable government regulations and policies supporting scientific research and technological innovation are creating a supportive environment for market expansion. The increasing demand for high-throughput screening and sophisticated analytical tools in the pharmaceutical industry is also a significant driver.
Challenges in the Confocal Raman Spectroscopy Market Sector
Despite significant growth potential, the Confocal Raman Spectroscopy market faces certain challenges. High initial investment costs for advanced systems can limit adoption, particularly for smaller research groups or businesses. The complex nature of data analysis and interpretation requires specialized expertise, leading to a skilled labor shortage. Furthermore, competition from alternative analytical techniques and the emergence of new technologies pose ongoing challenges for market players. These factors collectively impact market penetration and growth trajectory, requiring strategic adaptation by market participants.
Leading Players in the Confocal Raman Spectroscopy Market Market
- HORIBA Ltd
- Rigaku Corporation
- Agilent Technologies
- Oxford Instruments
- PerkinElmer Inc
- Renishaw PLC
- Bruker Corporation
- Thermo Fisher Scientific Inc
- Mettler Toledo
- Hamamatsu Photonics KK
*List Not Exhaustive
Key Developments in Confocal Raman Spectroscopy Market Sector
- June 2024: Shimadzu launched the AIRsight Infrared/Raman Microscope, merging FTIR and Raman spectroscopy into a single instrument, significantly streamlining molecular analysis.
- February 2024: Bruker Corporation acquired Nanophoton Corporation, enhancing its molecular microscopy portfolio and global reach.
These developments highlight the ongoing innovation and consolidation within the Confocal Raman Spectroscopy market, impacting both technological capabilities and market competition.
Strategic Confocal Raman Spectroscopy Market Market Outlook
The Confocal Raman Spectroscopy market is poised for substantial growth, driven by continuous technological advancements, expanding applications across various industries, and increasing R&D investments. Strategic opportunities lie in developing cost-effective and user-friendly systems, expanding into emerging markets, and focusing on applications in high-growth sectors such as biopharmaceuticals and nanotechnology. The market's future growth hinges on addressing challenges related to data analysis complexity and cost, while capitalizing on emerging trends like artificial intelligence and machine learning for advanced data interpretation.
Confocal Raman Spectroscopy Market Segmentation
-
1. Type
- 1.1. Desktop
- 1.2. Portable
-
2. End User
- 2.1. Pharmaceuticals
- 2.2. R&D in Academia
- 2.3. Industrial Sectors
- 2.4. Others
Confocal Raman Spectroscopy Market Segmentation By Geography
- 1. North America
- 2. Europe
- 3. Asia
- 4. Australia and New Zealand
- 5. Latin America
- 6. Middle East and Africa
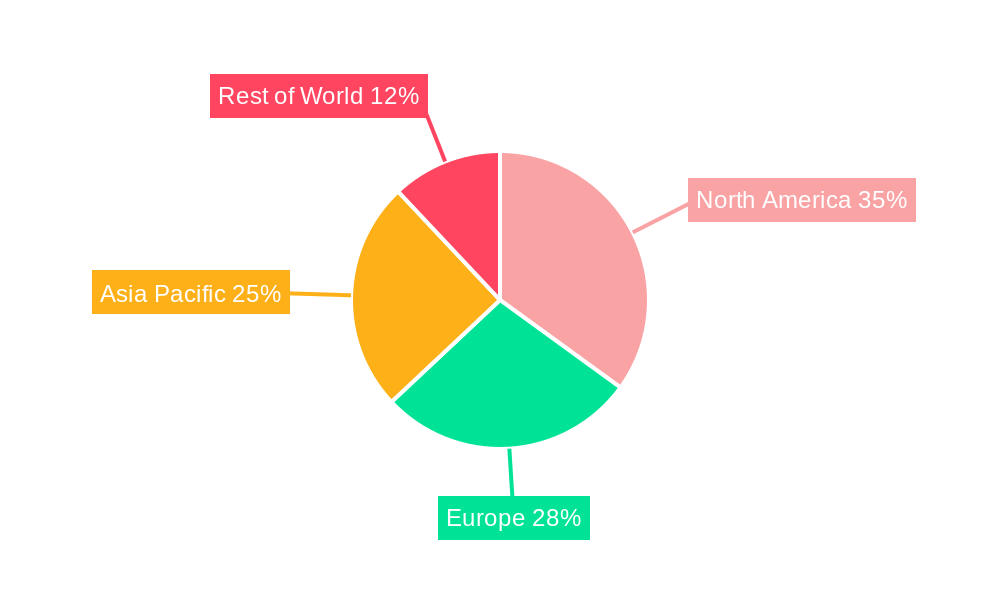
Confocal Raman Spectroscopy Market Regional Market Share
Geographic Coverage of Confocal Raman Spectroscopy Market
Confocal Raman Spectroscopy Market REPORT HIGHLIGHTS
| Aspects | Details |
|---|---|
| Study Period | 2020-2034 |
| Base Year | 2025 |
| Estimated Year | 2026 |
| Forecast Period | 2026-2034 |
| Historical Period | 2020-2025 |
| Growth Rate | CAGR of 8.00% from 2020-2034 |
| Segmentation |
|
Table of Contents
- 1. Introduction
- 1.1. Research Scope
- 1.2. Market Segmentation
- 1.3. Research Objective
- 1.4. Definitions and Assumptions
- 2. Executive Summary
- 2.1. Market Snapshot
- 3. Market Dynamics
- 3.1. Market Drivers
- 3.2. Market Restrains
- 3.3. Market Trends
- 3.4. Market Opportunities
- 4. Market Factor Analysis
- 4.1. Porters Five Forces
- 4.1.1. Bargaining Power of Suppliers
- 4.1.2. Bargaining Power of Buyers
- 4.1.3. Threat of New Entrants
- 4.1.4. Threat of Substitutes
- 4.1.5. Competitive Rivalry
- 4.2. PESTEL analysis
- 4.3. BCG Analysis
- 4.3.1. Stars (High Growth, High Market Share)
- 4.3.2. Cash Cows (Low Growth, High Market Share)
- 4.3.3. Question Mark (High Growth, Low Market Share)
- 4.3.4. Dogs (Low Growth, Low Market Share)
- 4.4. Ansoff Matrix Analysis
- 4.5. Supply Chain Analysis
- 4.6. Regulatory Landscape
- 4.7. Current Market Potential and Opportunity Assessment (TAM–SAM–SOM Framework)
- 4.8. PMV Analyst Note
- 4.1. Porters Five Forces
- 5. Market Analysis, Insights and Forecast 2021-2033
- 5.1. Market Analysis, Insights and Forecast - by Type
- 5.1.1. Desktop
- 5.1.2. Portable
- 5.2. Market Analysis, Insights and Forecast - by End User
- 5.2.1. Pharmaceuticals
- 5.2.2. R&D in Academia
- 5.2.3. Industrial Sectors
- 5.2.4. Others
- 5.3. Market Analysis, Insights and Forecast - by Region
- 5.3.1. North America
- 5.3.2. Europe
- 5.3.3. Asia
- 5.3.4. Australia and New Zealand
- 5.3.5. Latin America
- 5.3.6. Middle East and Africa
- 5.1. Market Analysis, Insights and Forecast - by Type
- 6. Global Confocal Raman Spectroscopy Market Analysis, Insights and Forecast, 2021-2033
- 6.1. Market Analysis, Insights and Forecast - by Type
- 6.1.1. Desktop
- 6.1.2. Portable
- 6.2. Market Analysis, Insights and Forecast - by End User
- 6.2.1. Pharmaceuticals
- 6.2.2. R&D in Academia
- 6.2.3. Industrial Sectors
- 6.2.4. Others
- 6.1. Market Analysis, Insights and Forecast - by Type
- 7. North America Confocal Raman Spectroscopy Market Analysis, Insights and Forecast, 2020-2032
- 7.1. Market Analysis, Insights and Forecast - by Type
- 7.1.1. Desktop
- 7.1.2. Portable
- 7.2. Market Analysis, Insights and Forecast - by End User
- 7.2.1. Pharmaceuticals
- 7.2.2. R&D in Academia
- 7.2.3. Industrial Sectors
- 7.2.4. Others
- 7.1. Market Analysis, Insights and Forecast - by Type
- 8. Europe Confocal Raman Spectroscopy Market Analysis, Insights and Forecast, 2020-2032
- 8.1. Market Analysis, Insights and Forecast - by Type
- 8.1.1. Desktop
- 8.1.2. Portable
- 8.2. Market Analysis, Insights and Forecast - by End User
- 8.2.1. Pharmaceuticals
- 8.2.2. R&D in Academia
- 8.2.3. Industrial Sectors
- 8.2.4. Others
- 8.1. Market Analysis, Insights and Forecast - by Type
- 9. Asia Confocal Raman Spectroscopy Market Analysis, Insights and Forecast, 2020-2032
- 9.1. Market Analysis, Insights and Forecast - by Type
- 9.1.1. Desktop
- 9.1.2. Portable
- 9.2. Market Analysis, Insights and Forecast - by End User
- 9.2.1. Pharmaceuticals
- 9.2.2. R&D in Academia
- 9.2.3. Industrial Sectors
- 9.2.4. Others
- 9.1. Market Analysis, Insights and Forecast - by Type
- 10. Australia and New Zealand Confocal Raman Spectroscopy Market Analysis, Insights and Forecast, 2020-2032
- 10.1. Market Analysis, Insights and Forecast - by Type
- 10.1.1. Desktop
- 10.1.2. Portable
- 10.2. Market Analysis, Insights and Forecast - by End User
- 10.2.1. Pharmaceuticals
- 10.2.2. R&D in Academia
- 10.2.3. Industrial Sectors
- 10.2.4. Others
- 10.1. Market Analysis, Insights and Forecast - by Type
- 11. Latin America Confocal Raman Spectroscopy Market Analysis, Insights and Forecast, 2020-2032
- 11.1. Market Analysis, Insights and Forecast - by Type
- 11.1.1. Desktop
- 11.1.2. Portable
- 11.2. Market Analysis, Insights and Forecast - by End User
- 11.2.1. Pharmaceuticals
- 11.2.2. R&D in Academia
- 11.2.3. Industrial Sectors
- 11.2.4. Others
- 11.1. Market Analysis, Insights and Forecast - by Type
- 12. Middle East and Africa Confocal Raman Spectroscopy Market Analysis, Insights and Forecast, 2020-2032
- 12.1. Market Analysis, Insights and Forecast - by Type
- 12.1.1. Desktop
- 12.1.2. Portable
- 12.2. Market Analysis, Insights and Forecast - by End User
- 12.2.1. Pharmaceuticals
- 12.2.2. R&D in Academia
- 12.2.3. Industrial Sectors
- 12.2.4. Others
- 12.1. Market Analysis, Insights and Forecast - by Type
- 13. Competitive Analysis
- 13.1. Company Profiles
- 13.1.1 HORIBA Ltd
- 13.1.1.1. Company Overview
- 13.1.1.2. Products
- 13.1.1.3. Company Financials
- 13.1.1.4. SWOT Analysis
- 13.1.2 Rikagu Corporation
- 13.1.2.1. Company Overview
- 13.1.2.2. Products
- 13.1.2.3. Company Financials
- 13.1.2.4. SWOT Analysis
- 13.1.3 Agilent Technologies
- 13.1.3.1. Company Overview
- 13.1.3.2. Products
- 13.1.3.3. Company Financials
- 13.1.3.4. SWOT Analysis
- 13.1.4 Oxford Instruments
- 13.1.4.1. Company Overview
- 13.1.4.2. Products
- 13.1.4.3. Company Financials
- 13.1.4.4. SWOT Analysis
- 13.1.5 PerkinElmer Inc
- 13.1.5.1. Company Overview
- 13.1.5.2. Products
- 13.1.5.3. Company Financials
- 13.1.5.4. SWOT Analysis
- 13.1.6 Renishaw PLC
- 13.1.6.1. Company Overview
- 13.1.6.2. Products
- 13.1.6.3. Company Financials
- 13.1.6.4. SWOT Analysis
- 13.1.7 Bruker Corporation
- 13.1.7.1. Company Overview
- 13.1.7.2. Products
- 13.1.7.3. Company Financials
- 13.1.7.4. SWOT Analysis
- 13.1.8 Thermo Fisher Scientific Inc
- 13.1.8.1. Company Overview
- 13.1.8.2. Products
- 13.1.8.3. Company Financials
- 13.1.8.4. SWOT Analysis
- 13.1.9 Mettler Toledo
- 13.1.9.1. Company Overview
- 13.1.9.2. Products
- 13.1.9.3. Company Financials
- 13.1.9.4. SWOT Analysis
- 13.1.10 Hamamatsu Photonics KK*List Not Exhaustive
- 13.1.10.1. Company Overview
- 13.1.10.2. Products
- 13.1.10.3. Company Financials
- 13.1.10.4. SWOT Analysis
- 13.1.1 HORIBA Ltd
- 13.2. Market Entropy
- 13.2.1 Company's Key Areas Served
- 13.2.2 Recent Developments
- 13.3. Company Market Share Analysis 2025
- 13.3.1 Top 5 Companies Market Share Analysis
- 13.3.2 Top 3 Companies Market Share Analysis
- 13.4. List of Potential Customers
- 14. Research Methodology
List of Figures
- Figure 1: Global Confocal Raman Spectroscopy Market Revenue Breakdown (Million, %) by Region 2025 & 2033
- Figure 2: Global Confocal Raman Spectroscopy Market Volume Breakdown (Million, %) by Region 2025 & 2033
- Figure 3: North America Confocal Raman Spectroscopy Market Revenue (Million), by Type 2025 & 2033
- Figure 4: North America Confocal Raman Spectroscopy Market Volume (Million), by Type 2025 & 2033
- Figure 5: North America Confocal Raman Spectroscopy Market Revenue Share (%), by Type 2025 & 2033
- Figure 6: North America Confocal Raman Spectroscopy Market Volume Share (%), by Type 2025 & 2033
- Figure 7: North America Confocal Raman Spectroscopy Market Revenue (Million), by End User 2025 & 2033
- Figure 8: North America Confocal Raman Spectroscopy Market Volume (Million), by End User 2025 & 2033
- Figure 9: North America Confocal Raman Spectroscopy Market Revenue Share (%), by End User 2025 & 2033
- Figure 10: North America Confocal Raman Spectroscopy Market Volume Share (%), by End User 2025 & 2033
- Figure 11: North America Confocal Raman Spectroscopy Market Revenue (Million), by Country 2025 & 2033
- Figure 12: North America Confocal Raman Spectroscopy Market Volume (Million), by Country 2025 & 2033
- Figure 13: North America Confocal Raman Spectroscopy Market Revenue Share (%), by Country 2025 & 2033
- Figure 14: North America Confocal Raman Spectroscopy Market Volume Share (%), by Country 2025 & 2033
- Figure 15: Europe Confocal Raman Spectroscopy Market Revenue (Million), by Type 2025 & 2033
- Figure 16: Europe Confocal Raman Spectroscopy Market Volume (Million), by Type 2025 & 2033
- Figure 17: Europe Confocal Raman Spectroscopy Market Revenue Share (%), by Type 2025 & 2033
- Figure 18: Europe Confocal Raman Spectroscopy Market Volume Share (%), by Type 2025 & 2033
- Figure 19: Europe Confocal Raman Spectroscopy Market Revenue (Million), by End User 2025 & 2033
- Figure 20: Europe Confocal Raman Spectroscopy Market Volume (Million), by End User 2025 & 2033
- Figure 21: Europe Confocal Raman Spectroscopy Market Revenue Share (%), by End User 2025 & 2033
- Figure 22: Europe Confocal Raman Spectroscopy Market Volume Share (%), by End User 2025 & 2033
- Figure 23: Europe Confocal Raman Spectroscopy Market Revenue (Million), by Country 2025 & 2033
- Figure 24: Europe Confocal Raman Spectroscopy Market Volume (Million), by Country 2025 & 2033
- Figure 25: Europe Confocal Raman Spectroscopy Market Revenue Share (%), by Country 2025 & 2033
- Figure 26: Europe Confocal Raman Spectroscopy Market Volume Share (%), by Country 2025 & 2033
- Figure 27: Asia Confocal Raman Spectroscopy Market Revenue (Million), by Type 2025 & 2033
- Figure 28: Asia Confocal Raman Spectroscopy Market Volume (Million), by Type 2025 & 2033
- Figure 29: Asia Confocal Raman Spectroscopy Market Revenue Share (%), by Type 2025 & 2033
- Figure 30: Asia Confocal Raman Spectroscopy Market Volume Share (%), by Type 2025 & 2033
- Figure 31: Asia Confocal Raman Spectroscopy Market Revenue (Million), by End User 2025 & 2033
- Figure 32: Asia Confocal Raman Spectroscopy Market Volume (Million), by End User 2025 & 2033
- Figure 33: Asia Confocal Raman Spectroscopy Market Revenue Share (%), by End User 2025 & 2033
- Figure 34: Asia Confocal Raman Spectroscopy Market Volume Share (%), by End User 2025 & 2033
- Figure 35: Asia Confocal Raman Spectroscopy Market Revenue (Million), by Country 2025 & 2033
- Figure 36: Asia Confocal Raman Spectroscopy Market Volume (Million), by Country 2025 & 2033
- Figure 37: Asia Confocal Raman Spectroscopy Market Revenue Share (%), by Country 2025 & 2033
- Figure 38: Asia Confocal Raman Spectroscopy Market Volume Share (%), by Country 2025 & 2033
- Figure 39: Australia and New Zealand Confocal Raman Spectroscopy Market Revenue (Million), by Type 2025 & 2033
- Figure 40: Australia and New Zealand Confocal Raman Spectroscopy Market Volume (Million), by Type 2025 & 2033
- Figure 41: Australia and New Zealand Confocal Raman Spectroscopy Market Revenue Share (%), by Type 2025 & 2033
- Figure 42: Australia and New Zealand Confocal Raman Spectroscopy Market Volume Share (%), by Type 2025 & 2033
- Figure 43: Australia and New Zealand Confocal Raman Spectroscopy Market Revenue (Million), by End User 2025 & 2033
- Figure 44: Australia and New Zealand Confocal Raman Spectroscopy Market Volume (Million), by End User 2025 & 2033
- Figure 45: Australia and New Zealand Confocal Raman Spectroscopy Market Revenue Share (%), by End User 2025 & 2033
- Figure 46: Australia and New Zealand Confocal Raman Spectroscopy Market Volume Share (%), by End User 2025 & 2033
- Figure 47: Australia and New Zealand Confocal Raman Spectroscopy Market Revenue (Million), by Country 2025 & 2033
- Figure 48: Australia and New Zealand Confocal Raman Spectroscopy Market Volume (Million), by Country 2025 & 2033
- Figure 49: Australia and New Zealand Confocal Raman Spectroscopy Market Revenue Share (%), by Country 2025 & 2033
- Figure 50: Australia and New Zealand Confocal Raman Spectroscopy Market Volume Share (%), by Country 2025 & 2033
- Figure 51: Latin America Confocal Raman Spectroscopy Market Revenue (Million), by Type 2025 & 2033
- Figure 52: Latin America Confocal Raman Spectroscopy Market Volume (Million), by Type 2025 & 2033
- Figure 53: Latin America Confocal Raman Spectroscopy Market Revenue Share (%), by Type 2025 & 2033
- Figure 54: Latin America Confocal Raman Spectroscopy Market Volume Share (%), by Type 2025 & 2033
- Figure 55: Latin America Confocal Raman Spectroscopy Market Revenue (Million), by End User 2025 & 2033
- Figure 56: Latin America Confocal Raman Spectroscopy Market Volume (Million), by End User 2025 & 2033
- Figure 57: Latin America Confocal Raman Spectroscopy Market Revenue Share (%), by End User 2025 & 2033
- Figure 58: Latin America Confocal Raman Spectroscopy Market Volume Share (%), by End User 2025 & 2033
- Figure 59: Latin America Confocal Raman Spectroscopy Market Revenue (Million), by Country 2025 & 2033
- Figure 60: Latin America Confocal Raman Spectroscopy Market Volume (Million), by Country 2025 & 2033
- Figure 61: Latin America Confocal Raman Spectroscopy Market Revenue Share (%), by Country 2025 & 2033
- Figure 62: Latin America Confocal Raman Spectroscopy Market Volume Share (%), by Country 2025 & 2033
- Figure 63: Middle East and Africa Confocal Raman Spectroscopy Market Revenue (Million), by Type 2025 & 2033
- Figure 64: Middle East and Africa Confocal Raman Spectroscopy Market Volume (Million), by Type 2025 & 2033
- Figure 65: Middle East and Africa Confocal Raman Spectroscopy Market Revenue Share (%), by Type 2025 & 2033
- Figure 66: Middle East and Africa Confocal Raman Spectroscopy Market Volume Share (%), by Type 2025 & 2033
- Figure 67: Middle East and Africa Confocal Raman Spectroscopy Market Revenue (Million), by End User 2025 & 2033
- Figure 68: Middle East and Africa Confocal Raman Spectroscopy Market Volume (Million), by End User 2025 & 2033
- Figure 69: Middle East and Africa Confocal Raman Spectroscopy Market Revenue Share (%), by End User 2025 & 2033
- Figure 70: Middle East and Africa Confocal Raman Spectroscopy Market Volume Share (%), by End User 2025 & 2033
- Figure 71: Middle East and Africa Confocal Raman Spectroscopy Market Revenue (Million), by Country 2025 & 2033
- Figure 72: Middle East and Africa Confocal Raman Spectroscopy Market Volume (Million), by Country 2025 & 2033
- Figure 73: Middle East and Africa Confocal Raman Spectroscopy Market Revenue Share (%), by Country 2025 & 2033
- Figure 74: Middle East and Africa Confocal Raman Spectroscopy Market Volume Share (%), by Country 2025 & 2033
List of Tables
- Table 1: Global Confocal Raman Spectroscopy Market Revenue Million Forecast, by Type 2020 & 2033
- Table 2: Global Confocal Raman Spectroscopy Market Volume Million Forecast, by Type 2020 & 2033
- Table 3: Global Confocal Raman Spectroscopy Market Revenue Million Forecast, by End User 2020 & 2033
- Table 4: Global Confocal Raman Spectroscopy Market Volume Million Forecast, by End User 2020 & 2033
- Table 5: Global Confocal Raman Spectroscopy Market Revenue Million Forecast, by Region 2020 & 2033
- Table 6: Global Confocal Raman Spectroscopy Market Volume Million Forecast, by Region 2020 & 2033
- Table 7: Global Confocal Raman Spectroscopy Market Revenue Million Forecast, by Type 2020 & 2033
- Table 8: Global Confocal Raman Spectroscopy Market Volume Million Forecast, by Type 2020 & 2033
- Table 9: Global Confocal Raman Spectroscopy Market Revenue Million Forecast, by End User 2020 & 2033
- Table 10: Global Confocal Raman Spectroscopy Market Volume Million Forecast, by End User 2020 & 2033
- Table 11: Global Confocal Raman Spectroscopy Market Revenue Million Forecast, by Country 2020 & 2033
- Table 12: Global Confocal Raman Spectroscopy Market Volume Million Forecast, by Country 2020 & 2033
- Table 13: Global Confocal Raman Spectroscopy Market Revenue Million Forecast, by Type 2020 & 2033
- Table 14: Global Confocal Raman Spectroscopy Market Volume Million Forecast, by Type 2020 & 2033
- Table 15: Global Confocal Raman Spectroscopy Market Revenue Million Forecast, by End User 2020 & 2033
- Table 16: Global Confocal Raman Spectroscopy Market Volume Million Forecast, by End User 2020 & 2033
- Table 17: Global Confocal Raman Spectroscopy Market Revenue Million Forecast, by Country 2020 & 2033
- Table 18: Global Confocal Raman Spectroscopy Market Volume Million Forecast, by Country 2020 & 2033
- Table 19: Global Confocal Raman Spectroscopy Market Revenue Million Forecast, by Type 2020 & 2033
- Table 20: Global Confocal Raman Spectroscopy Market Volume Million Forecast, by Type 2020 & 2033
- Table 21: Global Confocal Raman Spectroscopy Market Revenue Million Forecast, by End User 2020 & 2033
- Table 22: Global Confocal Raman Spectroscopy Market Volume Million Forecast, by End User 2020 & 2033
- Table 23: Global Confocal Raman Spectroscopy Market Revenue Million Forecast, by Country 2020 & 2033
- Table 24: Global Confocal Raman Spectroscopy Market Volume Million Forecast, by Country 2020 & 2033
- Table 25: Global Confocal Raman Spectroscopy Market Revenue Million Forecast, by Type 2020 & 2033
- Table 26: Global Confocal Raman Spectroscopy Market Volume Million Forecast, by Type 2020 & 2033
- Table 27: Global Confocal Raman Spectroscopy Market Revenue Million Forecast, by End User 2020 & 2033
- Table 28: Global Confocal Raman Spectroscopy Market Volume Million Forecast, by End User 2020 & 2033
- Table 29: Global Confocal Raman Spectroscopy Market Revenue Million Forecast, by Country 2020 & 2033
- Table 30: Global Confocal Raman Spectroscopy Market Volume Million Forecast, by Country 2020 & 2033
- Table 31: Global Confocal Raman Spectroscopy Market Revenue Million Forecast, by Type 2020 & 2033
- Table 32: Global Confocal Raman Spectroscopy Market Volume Million Forecast, by Type 2020 & 2033
- Table 33: Global Confocal Raman Spectroscopy Market Revenue Million Forecast, by End User 2020 & 2033
- Table 34: Global Confocal Raman Spectroscopy Market Volume Million Forecast, by End User 2020 & 2033
- Table 35: Global Confocal Raman Spectroscopy Market Revenue Million Forecast, by Country 2020 & 2033
- Table 36: Global Confocal Raman Spectroscopy Market Volume Million Forecast, by Country 2020 & 2033
- Table 37: Global Confocal Raman Spectroscopy Market Revenue Million Forecast, by Type 2020 & 2033
- Table 38: Global Confocal Raman Spectroscopy Market Volume Million Forecast, by Type 2020 & 2033
- Table 39: Global Confocal Raman Spectroscopy Market Revenue Million Forecast, by End User 2020 & 2033
- Table 40: Global Confocal Raman Spectroscopy Market Volume Million Forecast, by End User 2020 & 2033
- Table 41: Global Confocal Raman Spectroscopy Market Revenue Million Forecast, by Country 2020 & 2033
- Table 42: Global Confocal Raman Spectroscopy Market Volume Million Forecast, by Country 2020 & 2033
Frequently Asked Questions
1. What is the projected Compound Annual Growth Rate (CAGR) of the Confocal Raman Spectroscopy Market?
The projected CAGR is approximately 8.00%.
2. Which companies are prominent players in the Confocal Raman Spectroscopy Market?
Key companies in the market include HORIBA Ltd, Rikagu Corporation, Agilent Technologies, Oxford Instruments, PerkinElmer Inc, Renishaw PLC, Bruker Corporation, Thermo Fisher Scientific Inc, Mettler Toledo, Hamamatsu Photonics KK*List Not Exhaustive.
3. What are the main segments of the Confocal Raman Spectroscopy Market?
The market segments include Type, End User.
4. Can you provide details about the market size?
The market size is estimated to be USD 551.12 Million as of 2022.
5. What are some drivers contributing to market growth?
Rising Investment Towards Drug Development; Growing Application in Forensic Science. Food Safety. and Gemology.
6. What are the notable trends driving market growth?
The Portable Segment is Driving Popularity.
7. Are there any restraints impacting market growth?
Rising Investment Towards Drug Development; Growing Application in Forensic Science. Food Safety. and Gemology.
8. Can you provide examples of recent developments in the market?
June 2024: The Shimadzu AIRsight Infrared/Raman Microscope revolutionized molecular analysis. By merging Fourier transform infrared (FTIR) and Raman spectroscopy into a single instrument, it equips researchers with a robust tool for in-depth sample examination. This innovation allows for the simultaneous acquisition of both spectra from a stationary sample, streamlining the process and enhancing the accuracy of technique correlation.February 2024: Brukar Corporation acquired Nanophoton Corporation, which is based in Osaka and boasts a diverse range of cutting-edge Raman microscopes, catering to both academic and industrial research, predominantly in Japan. This strategic move enhanced Bruker's molecular microscopy offerings. The company aims to promote Nanophoton's rapid, adaptable, and sensitive Raman systems globally across various fields, including life sciences, biopharma, advanced materials, semiconductors, and polymers.
9. What pricing options are available for accessing the report?
Pricing options include single-user, multi-user, and enterprise licenses priced at USD 4750, USD 5250, and USD 8750 respectively.
10. Is the market size provided in terms of value or volume?
The market size is provided in terms of value, measured in Million and volume, measured in Million.
11. Are there any specific market keywords associated with the report?
Yes, the market keyword associated with the report is "Confocal Raman Spectroscopy Market," which aids in identifying and referencing the specific market segment covered.
12. How do I determine which pricing option suits my needs best?
The pricing options vary based on user requirements and access needs. Individual users may opt for single-user licenses, while businesses requiring broader access may choose multi-user or enterprise licenses for cost-effective access to the report.
13. Are there any additional resources or data provided in the Confocal Raman Spectroscopy Market report?
While the report offers comprehensive insights, it's advisable to review the specific contents or supplementary materials provided to ascertain if additional resources or data are available.
14. How can I stay updated on further developments or reports in the Confocal Raman Spectroscopy Market?
To stay informed about further developments, trends, and reports in the Confocal Raman Spectroscopy Market, consider subscribing to industry newsletters, following relevant companies and organizations, or regularly checking reputable industry news sources and publications.
Methodology
Step 1 - Identification of Relevant Samples Size from Population Database


Step 2 - Approaches for Defining Global Market Size (Value, Volume* & Price*)

Note*: In applicable scenarios
Step 3 - Data Sources
Primary Research
- Web Analytics
- Survey Reports
- Research Institute
- Latest Research Reports
- Opinion Leaders
Secondary Research
- Annual Reports
- White Paper
- Latest Press Release
- Industry Association
- Paid Database
- Investor Presentations

Step 4 - Data Triangulation
Involves using different sources of information in order to increase the validity of a study
These sources are likely to be stakeholders in a program - participants, other researchers, program staff, other community members, and so on.
Then we put all data in single framework & apply various statistical tools to find out the dynamic on the market.
During the analysis stage, feedback from the stakeholder groups would be compared to determine areas of agreement as well as areas of divergence