

Key Insights
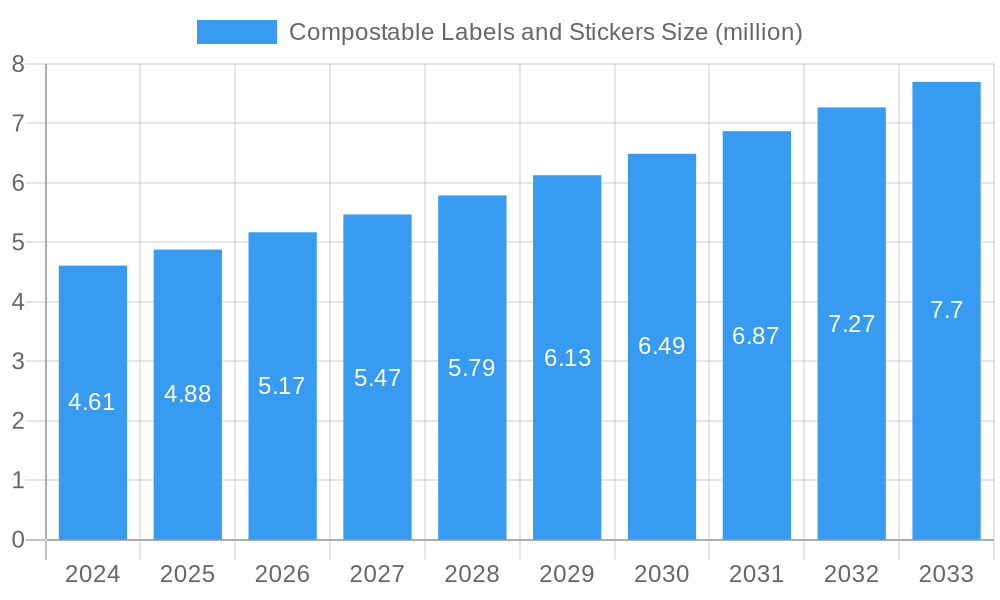
The global market for compostable labels and stickers is poised for substantial growth, driven by increasing environmental consciousness and stringent regulations promoting sustainable packaging solutions. The market was valued at USD 4.61 billion in 2024 and is projected to expand at a compound annual growth rate (CAGR) of 5.81% during the forecast period of 2025-2033. This upward trajectory is primarily fueled by rising consumer demand for eco-friendly products, forcing brands to adopt sustainable labeling to align with their corporate social responsibility goals and to meet the preferences of an environmentally aware customer base. Furthermore, the growing adoption of these labels across various industries, including food and beverage, cosmetics, and pharmaceuticals, underscores their increasing significance. The push for biodegradable and compostable alternatives to traditional petroleum-based plastics is a key market driver, supported by government initiatives and policies aimed at reducing landfill waste and promoting a circular economy. Innovations in material science are also contributing to the development of high-performance, cost-effective compostable label solutions, further stimulating market expansion.
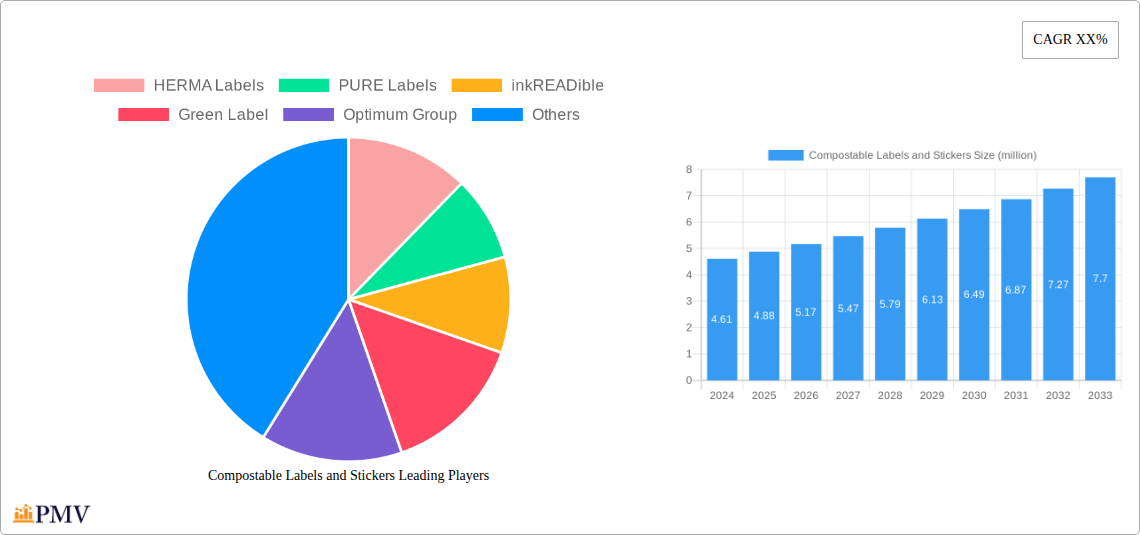
Compostable Labels and Stickers Market Size (In Million)
The compostable labels and stickers market is segmented by application into food, cosmetics, and others, with the food sector representing a significant share due to the widespread use of these labels on perishable goods and their alignment with sustainable food packaging trends. By type, the market includes corn starch, potato starch, sugarcane, and other compostable materials. While corn starch and potato starch are currently prominent, advancements in sugarcane-based materials and novel composite materials are expected to gain traction. Geographically, Asia Pacific is anticipated to lead the market growth, driven by rapid industrialization, a burgeoning population, and increasing environmental awareness in countries like China and India. North America and Europe are also significant markets, with robust regulatory frameworks and a strong consumer preference for sustainable products. However, challenges such as higher initial costs compared to conventional labels and a need for improved infrastructure for composting can temper the growth rate. Nevertheless, the overarching trend towards sustainability and the continuous development of innovative, cost-competitive compostable label solutions are expected to propel the market forward robustly.
Compostable Labels and Stickers Company Market Share
Compostable Labels and Stickers Market Report: Comprehensive Analysis and Future Outlook
This in-depth report offers a detailed examination of the global compostable labels and stickers market, a rapidly expanding sector driven by increasing environmental consciousness and stringent regulations. Covering the historical period from 2019 to 2024 and projecting growth through 2033, with a base year of 2025, this analysis provides actionable insights for stakeholders seeking to capitalize on this burgeoning industry. We delve into market structure, competitive dynamics, emerging trends, dominant segments, product innovations, growth drivers, challenges, key players, and strategic outlooks, making it an indispensable resource for sustainable packaging solutions, eco-friendly labeling, and biodegradable sticker manufacturers.
Compostable Labels and Stickers Market Structure & Competitive Dynamics
The compostable labels and stickers market exhibits a moderately consolidated structure, with a few dominant players and a growing number of innovative small and medium-sized enterprises. Market concentration is influenced by the significant capital investment required for advanced manufacturing technologies and R&D in biodegradable materials. The innovation ecosystem is vibrant, fueled by advancements in bioplastics derived from corn starch, potato starch, and sugarcane. Regulatory frameworks, particularly in regions like Europe and North America, are increasingly mandating the use of sustainable packaging, thereby shaping market entry and product development. Product substitutes, such as traditional non-compostable labels, are gradually losing ground due to environmental concerns. End-user trends reveal a strong preference for food packaging labels, cosmetics labels, and other consumer goods requiring visible sustainability credentials. Merger and acquisition (M&A) activities are on the rise as larger companies seek to expand their sustainable product portfolios and gain a competitive edge. For instance, several strategic acquisitions in the last five years have seen established label manufacturers investing billions to integrate compostable material producers. The estimated market share of key compostable label manufacturers is projected to shift significantly in the coming years, with leading companies focusing on expanding their biodegradable sticker offerings. M&A deal values in the sustainable packaging sector are expected to reach billions as companies consolidate expertise and market reach.
Compostable Labels and Stickers Industry Trends & Insights
The compostable labels and stickers industry is experiencing robust growth, projected to expand at a significant Compound Annual Growth Rate (CAGR) of approximately 8.5% from 2025 to 2033. This expansion is primarily driven by a confluence of factors, including heightened consumer demand for eco-friendly products, stringent government regulations promoting sustainability, and a growing corporate commitment to environmental, social, and governance (ESG) principles. The shift away from single-use plastics and towards more sustainable alternatives is a paramount trend, with compostable labels offering a viable solution for reducing landfill waste. Technological disruptions, particularly in the development of advanced biopolymers and innovative printing inks, are further accelerating market penetration. These innovations enable the creation of durable, high-performance compostable labels that are suitable for a wide range of applications, from food packaging to cosmetic containers.
Consumer preferences are increasingly leaning towards brands that demonstrate a commitment to sustainability. This has led to a surge in demand for products that are not only functional but also environmentally responsible. Compostable packaging labels have become a key differentiator for many brands looking to appeal to an environmentally conscious consumer base. The competitive dynamics within the market are characterized by an increasing emphasis on product innovation, cost-effectiveness, and supply chain reliability. Companies are investing heavily in research and development to improve the performance and reduce the cost of compostable materials, making them more accessible to a broader market.
The market penetration of compostable labels is expected to reach substantial levels within the forecast period, driven by the adoption across various industries. The development of composite material labels, which combine biodegradable substrates with specialized adhesives and coatings, is a notable trend enhancing the functionality and applicability of these solutions. Furthermore, the growing awareness of the lifecycle impact of packaging materials is compelling businesses to reassess their sourcing and disposal strategies. The compostable label market is not merely a niche segment but is rapidly evolving into a mainstream requirement for responsible businesses. The estimated market size for compostable labels is projected to reach billions by 2033, underscoring the significant economic opportunity within this sector.
Dominant Markets & Segments in Compostable Labels and Stickers
The compostable labels and stickers market is experiencing significant growth across multiple segments, with certain regions and applications demonstrating particularly strong adoption.
Application Segments
- Food: This segment is a dominant force, driven by stringent regulations on food packaging and a heightened consumer awareness regarding food safety and environmental impact. The demand for compostable food labels that can withstand various storage conditions and printing requirements is substantial. Key drivers include the need for clear ingredient and expiry date information on biodegradable packaging, as well as the desire to reduce the environmental footprint of the food industry. Economic policies promoting sustainable food production and distribution further bolster this segment.
- Cosmetics: The cosmetics industry is another major consumer of compostable labels, spurred by a discerning customer base that increasingly prioritizes natural and sustainable products. Brands are actively seeking eco-friendly cosmetic labels to align with their brand ethos and appeal to environmentally conscious consumers. Technological advancements in printing and adhesive technologies for cosmetics are crucial here, ensuring label durability and aesthetic appeal.
- Others: This broad category encompasses a wide array of applications, including e-commerce shipping labels, retail product labeling, and industrial applications where sustainability is becoming a key consideration. The growth in e-commerce and the increasing focus on reducing packaging waste in shipping operations are significant drivers.
Type Segments
- Corn Starch: Labels derived from corn starch are a popular choice due to their wide availability and relatively lower cost. This type of compostable material offers good printability and is suitable for various applications, contributing to its widespread adoption.
- Potato Starch: Similar to corn starch, potato starch-based labels provide a biodegradable and sustainable alternative. They are often used in applications where a slightly different texture or performance characteristic is desired.
- Sugarcane: Labels manufactured from sugarcane fibers are gaining traction due to their renewable resource origins and strong compostability. This type of material often offers excellent durability and a premium feel, making it suitable for high-value products.
- Composite Material: Composite material labels, which blend various biodegradable components or incorporate specialized coatings, represent a significant innovation. These labels are engineered for enhanced performance, offering improved resistance to moisture, temperature fluctuations, and mechanical stress, making them suitable for demanding applications.
- Others: This includes other emerging biodegradable materials and novel composite structures that are being developed to meet specific market needs and performance requirements.
The dominance of these segments is further amplified by supportive infrastructure development, particularly in waste management and composting facilities, which are crucial for the effective disposal of compostable products. Government initiatives and certifications for compostable materials also play a pivotal role in driving adoption and consumer confidence across these dominant markets.
Compostable Labels and Stickers Product Innovations
Product innovations in the compostable labels and stickers market are centered on enhancing performance, durability, and aesthetic appeal while maintaining biodegradability. Key developments include the creation of labels with specialized adhesives that offer strong adhesion on diverse substrates while still being compostable. Advancements in printing technologies allow for vibrant and durable graphics on eco-friendly sticker materials. Furthermore, the development of composite material labels that combine bio-based films with biodegradable inks and adhesives is expanding the application range. These innovations offer competitive advantages by meeting stringent industry requirements for food contact safety, moisture resistance, and shelf-life, making them attractive for brands prioritizing sustainable packaging.
Report Segmentation & Scope
This report segments the compostable labels and stickers market by Application and Type.
- Application: The market is analyzed across Food, Cosmetics, and Others. The Food segment is expected to witness a significant market size of billions by 2033, driven by regulatory pressures and consumer demand for sustainable food packaging. The Cosmetics segment, projected to reach billions in market value, benefits from brand differentiation strategies. The Others segment, encompassing e-commerce, retail, and industrial uses, is also projected for substantial growth, reaching billions by 2033 due to expanding e-commerce and corporate sustainability initiatives.
- Type: Segmentation includes Corn Starch, Potato Starch, Sugarcane, Composite Material, and Others. The Corn Starch and Sugarcane segments are anticipated to hold substantial market shares, projected to reach billions by 2025, due to their availability and cost-effectiveness. The Composite Material segment is expected to show the highest growth rate, with its market size projected to reach billions by 2033, as manufacturers develop advanced, high-performance compostable solutions.
Key Drivers of Compostable Labels and Stickers Growth
Several key factors are propelling the growth of the compostable labels and stickers market. Increasing global awareness and concern for environmental sustainability are paramount, leading consumers and businesses to actively seek eco-friendly alternatives. Stringent government regulations and policies mandating the reduction of non-recyclable waste and promoting the use of biodegradable materials are significant drivers. Technological advancements in bioplastic development and printing techniques are making biodegradable stickers and labels more cost-effective and performant, expanding their applicability across various industries. Furthermore, the growing corporate social responsibility (CSR) initiatives and a desire among brands to enhance their sustainability credentials to appeal to environmentally conscious consumers are also contributing significantly to market expansion. The economic viability of compostable packaging solutions is improving, making them a more attractive option for businesses of all sizes.
Challenges in the Compostable Labels and Stickers Sector
Despite the robust growth, the compostable labels and stickers sector faces several challenges. High initial production costs compared to conventional labels can be a barrier to widespread adoption, particularly for small and medium-sized enterprises. Ensuring the complete biodegradability and compostability of labels requires specific industrial composting facilities, which are not universally available, leading to potential confusion and improper disposal. Consumer education regarding the correct disposal methods for compostable products remains a significant hurdle. Supply chain complexities and the availability of raw materials for bioplastics can also pose challenges. Furthermore, maintaining the performance characteristics, such as durability, adhesion, and print quality, to match or exceed those of traditional labels requires continuous innovation and investment. Competitive pressures from established conventional label manufacturers also exist.
Leading Players in the Compostable Labels and Stickers Market
The compostable labels and stickers market features a diverse range of leading players, including:
- HERMA Labels
- PURE Labels
- inkREADible
- Green Label
- Optimum Group
- A4Labels
- Wedderburn
- Labels Plus
- Elevate Packaging
- Xinxing Label
- Avery Dennison
- Huizhou Yito Packaging
Key Developments in Compostable Labels and Stickers Sector
- 2023-2024: Numerous product launches featuring new biodegradable sticker formulations with enhanced adhesive properties and printability for various substrates.
- 2023: Strategic partnerships formed between bioplastic manufacturers and label converters to streamline the supply chain for compostable food labels.
- 2022: Significant investment in R&D by major players to develop advanced composite material labels capable of withstanding extreme conditions.
- 2021-2022: Increased adoption of sugarcane-based and corn starch-based labeling solutions by prominent food and beverage brands.
- 2020: Expansion of production capacities for compostable labels by key manufacturers to meet growing market demand.
Strategic Compostable Labels and Stickers Market Outlook
The strategic outlook for the compostable labels and stickers market is exceptionally positive, driven by an accelerating global shift towards sustainable practices. Growth accelerators include the continuous innovation in biopolymer technology, leading to improved performance and reduced costs, making eco-friendly labeling more accessible. The increasing demand for sustainable packaging across diverse sectors, from food and cosmetics to e-commerce, presents substantial market potential. Strategic opportunities lie in developing specialized compostable labels for niche applications, investing in certifications to build consumer trust, and forming collaborations across the value chain to optimize production and distribution. The market is poised for significant expansion, with billions in projected growth by 2033, making it a critical area for investment and strategic focus for companies committed to sustainability.
Compostable Labels and Stickers Segmentation
-
1. Application
- 1.1. Food
- 1.2. Cosmetics
- 1.3. Others
-
2. Types
- 2.1. Corn Starch
- 2.2. Potato Starch
- 2.3. Sugarcane
- 2.4. Composite Material
- 2.5. Others
Compostable Labels and Stickers Segmentation By Geography
-
1. North America
- 1.1. United States
- 1.2. Canada
- 1.3. Mexico
-
2. South America
- 2.1. Brazil
- 2.2. Argentina
- 2.3. Rest of South America
-
3. Europe
- 3.1. United Kingdom
- 3.2. Germany
- 3.3. France
- 3.4. Italy
- 3.5. Spain
- 3.6. Russia
- 3.7. Benelux
- 3.8. Nordics
- 3.9. Rest of Europe
-
4. Middle East & Africa
- 4.1. Turkey
- 4.2. Israel
- 4.3. GCC
- 4.4. North Africa
- 4.5. South Africa
- 4.6. Rest of Middle East & Africa
-
5. Asia Pacific
- 5.1. China
- 5.2. India
- 5.3. Japan
- 5.4. South Korea
- 5.5. ASEAN
- 5.6. Oceania
- 5.7. Rest of Asia Pacific
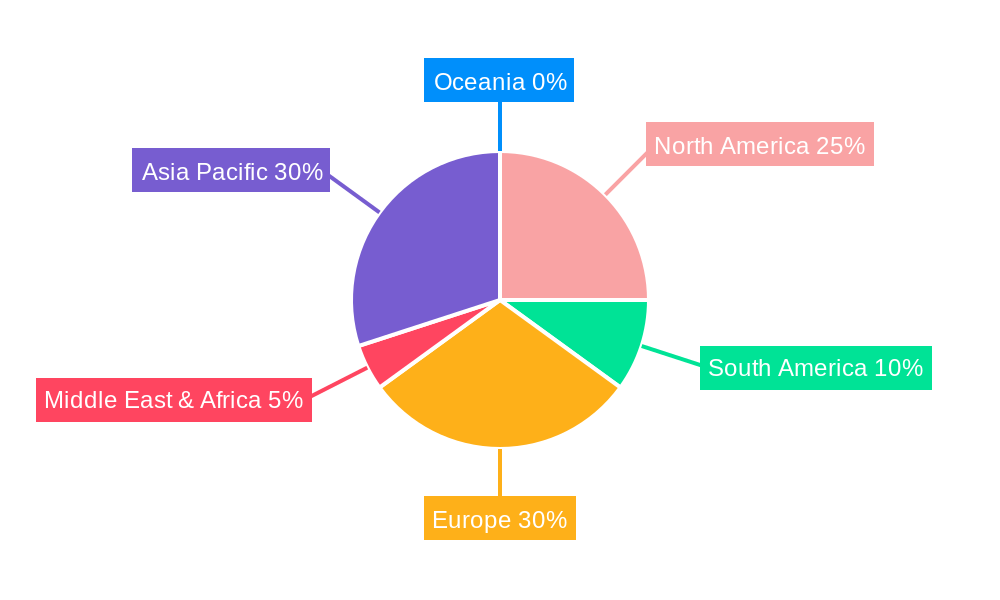
Compostable Labels and Stickers Regional Market Share
Geographic Coverage of Compostable Labels and Stickers
Compostable Labels and Stickers REPORT HIGHLIGHTS
| Aspects | Details |
|---|---|
| Study Period | 2020-2034 |
| Base Year | 2025 |
| Estimated Year | 2026 |
| Forecast Period | 2026-2034 |
| Historical Period | 2020-2025 |
| Growth Rate | CAGR of 5.81% from 2020-2034 |
| Segmentation |
|
Table of Contents
- 1. Introduction
- 1.1. Research Scope
- 1.2. Market Segmentation
- 1.3. Research Objective
- 1.4. Definitions and Assumptions
- 2. Executive Summary
- 2.1. Market Snapshot
- 3. Market Dynamics
- 3.1. Market Drivers
- 3.2. Market Restrains
- 3.3. Market Trends
- 3.4. Market Opportunities
- 4. Market Factor Analysis
- 4.1. Porters Five Forces
- 4.1.1. Bargaining Power of Suppliers
- 4.1.2. Bargaining Power of Buyers
- 4.1.3. Threat of New Entrants
- 4.1.4. Threat of Substitutes
- 4.1.5. Competitive Rivalry
- 4.2. PESTEL analysis
- 4.3. BCG Analysis
- 4.3.1. Stars (High Growth, High Market Share)
- 4.3.2. Cash Cows (Low Growth, High Market Share)
- 4.3.3. Question Mark (High Growth, Low Market Share)
- 4.3.4. Dogs (Low Growth, Low Market Share)
- 4.4. Ansoff Matrix Analysis
- 4.5. Supply Chain Analysis
- 4.6. Regulatory Landscape
- 4.7. Current Market Potential and Opportunity Assessment (TAM–SAM–SOM Framework)
- 4.8. PMV Analyst Note
- 4.1. Porters Five Forces
- 5. Market Analysis, Insights and Forecast 2021-2033
- 5.1. Market Analysis, Insights and Forecast - by Application
- 5.1.1. Food
- 5.1.2. Cosmetics
- 5.1.3. Others
- 5.2. Market Analysis, Insights and Forecast - by Types
- 5.2.1. Corn Starch
- 5.2.2. Potato Starch
- 5.2.3. Sugarcane
- 5.2.4. Composite Material
- 5.2.5. Others
- 5.3. Market Analysis, Insights and Forecast - by Region
- 5.3.1. North America
- 5.3.2. South America
- 5.3.3. Europe
- 5.3.4. Middle East & Africa
- 5.3.5. Asia Pacific
- 5.1. Market Analysis, Insights and Forecast - by Application
- 6. Global Compostable Labels and Stickers Analysis, Insights and Forecast, 2021-2033
- 6.1. Market Analysis, Insights and Forecast - by Application
- 6.1.1. Food
- 6.1.2. Cosmetics
- 6.1.3. Others
- 6.2. Market Analysis, Insights and Forecast - by Types
- 6.2.1. Corn Starch
- 6.2.2. Potato Starch
- 6.2.3. Sugarcane
- 6.2.4. Composite Material
- 6.2.5. Others
- 6.1. Market Analysis, Insights and Forecast - by Application
- 7. North America Compostable Labels and Stickers Analysis, Insights and Forecast, 2020-2032
- 7.1. Market Analysis, Insights and Forecast - by Application
- 7.1.1. Food
- 7.1.2. Cosmetics
- 7.1.3. Others
- 7.2. Market Analysis, Insights and Forecast - by Types
- 7.2.1. Corn Starch
- 7.2.2. Potato Starch
- 7.2.3. Sugarcane
- 7.2.4. Composite Material
- 7.2.5. Others
- 7.1. Market Analysis, Insights and Forecast - by Application
- 8. South America Compostable Labels and Stickers Analysis, Insights and Forecast, 2020-2032
- 8.1. Market Analysis, Insights and Forecast - by Application
- 8.1.1. Food
- 8.1.2. Cosmetics
- 8.1.3. Others
- 8.2. Market Analysis, Insights and Forecast - by Types
- 8.2.1. Corn Starch
- 8.2.2. Potato Starch
- 8.2.3. Sugarcane
- 8.2.4. Composite Material
- 8.2.5. Others
- 8.1. Market Analysis, Insights and Forecast - by Application
- 9. Europe Compostable Labels and Stickers Analysis, Insights and Forecast, 2020-2032
- 9.1. Market Analysis, Insights and Forecast - by Application
- 9.1.1. Food
- 9.1.2. Cosmetics
- 9.1.3. Others
- 9.2. Market Analysis, Insights and Forecast - by Types
- 9.2.1. Corn Starch
- 9.2.2. Potato Starch
- 9.2.3. Sugarcane
- 9.2.4. Composite Material
- 9.2.5. Others
- 9.1. Market Analysis, Insights and Forecast - by Application
- 10. Middle East & Africa Compostable Labels and Stickers Analysis, Insights and Forecast, 2020-2032
- 10.1. Market Analysis, Insights and Forecast - by Application
- 10.1.1. Food
- 10.1.2. Cosmetics
- 10.1.3. Others
- 10.2. Market Analysis, Insights and Forecast - by Types
- 10.2.1. Corn Starch
- 10.2.2. Potato Starch
- 10.2.3. Sugarcane
- 10.2.4. Composite Material
- 10.2.5. Others
- 10.1. Market Analysis, Insights and Forecast - by Application
- 11. Asia Pacific Compostable Labels and Stickers Analysis, Insights and Forecast, 2020-2032
- 11.1. Market Analysis, Insights and Forecast - by Application
- 11.1.1. Food
- 11.1.2. Cosmetics
- 11.1.3. Others
- 11.2. Market Analysis, Insights and Forecast - by Types
- 11.2.1. Corn Starch
- 11.2.2. Potato Starch
- 11.2.3. Sugarcane
- 11.2.4. Composite Material
- 11.2.5. Others
- 11.1. Market Analysis, Insights and Forecast - by Application
- 12. Competitive Analysis
- 12.1. Company Profiles
- 12.1.1 HERMA Labels
- 12.1.1.1. Company Overview
- 12.1.1.2. Products
- 12.1.1.3. Company Financials
- 12.1.1.4. SWOT Analysis
- 12.1.2 PURE Labels
- 12.1.2.1. Company Overview
- 12.1.2.2. Products
- 12.1.2.3. Company Financials
- 12.1.2.4. SWOT Analysis
- 12.1.3 inkREADible
- 12.1.3.1. Company Overview
- 12.1.3.2. Products
- 12.1.3.3. Company Financials
- 12.1.3.4. SWOT Analysis
- 12.1.4 Green Label
- 12.1.4.1. Company Overview
- 12.1.4.2. Products
- 12.1.4.3. Company Financials
- 12.1.4.4. SWOT Analysis
- 12.1.5 Optimum Group
- 12.1.5.1. Company Overview
- 12.1.5.2. Products
- 12.1.5.3. Company Financials
- 12.1.5.4. SWOT Analysis
- 12.1.6 A4Labels
- 12.1.6.1. Company Overview
- 12.1.6.2. Products
- 12.1.6.3. Company Financials
- 12.1.6.4. SWOT Analysis
- 12.1.7 Wedderburn
- 12.1.7.1. Company Overview
- 12.1.7.2. Products
- 12.1.7.3. Company Financials
- 12.1.7.4. SWOT Analysis
- 12.1.8 Labels Plus
- 12.1.8.1. Company Overview
- 12.1.8.2. Products
- 12.1.8.3. Company Financials
- 12.1.8.4. SWOT Analysis
- 12.1.9 Elevate Packaging
- 12.1.9.1. Company Overview
- 12.1.9.2. Products
- 12.1.9.3. Company Financials
- 12.1.9.4. SWOT Analysis
- 12.1.10 Xinxing Label
- 12.1.10.1. Company Overview
- 12.1.10.2. Products
- 12.1.10.3. Company Financials
- 12.1.10.4. SWOT Analysis
- 12.1.11 Avery Dennison
- 12.1.11.1. Company Overview
- 12.1.11.2. Products
- 12.1.11.3. Company Financials
- 12.1.11.4. SWOT Analysis
- 12.1.12 Huizhou Yito Packaging
- 12.1.12.1. Company Overview
- 12.1.12.2. Products
- 12.1.12.3. Company Financials
- 12.1.12.4. SWOT Analysis
- 12.1.1 HERMA Labels
- 12.2. Market Entropy
- 12.2.1 Company's Key Areas Served
- 12.2.2 Recent Developments
- 12.3. Company Market Share Analysis 2025
- 12.3.1 Top 5 Companies Market Share Analysis
- 12.3.2 Top 3 Companies Market Share Analysis
- 12.4. List of Potential Customers
- 13. Research Methodology
List of Figures
- Figure 1: Global Compostable Labels and Stickers Revenue Breakdown (undefined, %) by Region 2025 & 2033
- Figure 2: Global Compostable Labels and Stickers Volume Breakdown (K, %) by Region 2025 & 2033
- Figure 3: North America Compostable Labels and Stickers Revenue (undefined), by Application 2025 & 2033
- Figure 4: North America Compostable Labels and Stickers Volume (K), by Application 2025 & 2033
- Figure 5: North America Compostable Labels and Stickers Revenue Share (%), by Application 2025 & 2033
- Figure 6: North America Compostable Labels and Stickers Volume Share (%), by Application 2025 & 2033
- Figure 7: North America Compostable Labels and Stickers Revenue (undefined), by Types 2025 & 2033
- Figure 8: North America Compostable Labels and Stickers Volume (K), by Types 2025 & 2033
- Figure 9: North America Compostable Labels and Stickers Revenue Share (%), by Types 2025 & 2033
- Figure 10: North America Compostable Labels and Stickers Volume Share (%), by Types 2025 & 2033
- Figure 11: North America Compostable Labels and Stickers Revenue (undefined), by Country 2025 & 2033
- Figure 12: North America Compostable Labels and Stickers Volume (K), by Country 2025 & 2033
- Figure 13: North America Compostable Labels and Stickers Revenue Share (%), by Country 2025 & 2033
- Figure 14: North America Compostable Labels and Stickers Volume Share (%), by Country 2025 & 2033
- Figure 15: South America Compostable Labels and Stickers Revenue (undefined), by Application 2025 & 2033
- Figure 16: South America Compostable Labels and Stickers Volume (K), by Application 2025 & 2033
- Figure 17: South America Compostable Labels and Stickers Revenue Share (%), by Application 2025 & 2033
- Figure 18: South America Compostable Labels and Stickers Volume Share (%), by Application 2025 & 2033
- Figure 19: South America Compostable Labels and Stickers Revenue (undefined), by Types 2025 & 2033
- Figure 20: South America Compostable Labels and Stickers Volume (K), by Types 2025 & 2033
- Figure 21: South America Compostable Labels and Stickers Revenue Share (%), by Types 2025 & 2033
- Figure 22: South America Compostable Labels and Stickers Volume Share (%), by Types 2025 & 2033
- Figure 23: South America Compostable Labels and Stickers Revenue (undefined), by Country 2025 & 2033
- Figure 24: South America Compostable Labels and Stickers Volume (K), by Country 2025 & 2033
- Figure 25: South America Compostable Labels and Stickers Revenue Share (%), by Country 2025 & 2033
- Figure 26: South America Compostable Labels and Stickers Volume Share (%), by Country 2025 & 2033
- Figure 27: Europe Compostable Labels and Stickers Revenue (undefined), by Application 2025 & 2033
- Figure 28: Europe Compostable Labels and Stickers Volume (K), by Application 2025 & 2033
- Figure 29: Europe Compostable Labels and Stickers Revenue Share (%), by Application 2025 & 2033
- Figure 30: Europe Compostable Labels and Stickers Volume Share (%), by Application 2025 & 2033
- Figure 31: Europe Compostable Labels and Stickers Revenue (undefined), by Types 2025 & 2033
- Figure 32: Europe Compostable Labels and Stickers Volume (K), by Types 2025 & 2033
- Figure 33: Europe Compostable Labels and Stickers Revenue Share (%), by Types 2025 & 2033
- Figure 34: Europe Compostable Labels and Stickers Volume Share (%), by Types 2025 & 2033
- Figure 35: Europe Compostable Labels and Stickers Revenue (undefined), by Country 2025 & 2033
- Figure 36: Europe Compostable Labels and Stickers Volume (K), by Country 2025 & 2033
- Figure 37: Europe Compostable Labels and Stickers Revenue Share (%), by Country 2025 & 2033
- Figure 38: Europe Compostable Labels and Stickers Volume Share (%), by Country 2025 & 2033
- Figure 39: Middle East & Africa Compostable Labels and Stickers Revenue (undefined), by Application 2025 & 2033
- Figure 40: Middle East & Africa Compostable Labels and Stickers Volume (K), by Application 2025 & 2033
- Figure 41: Middle East & Africa Compostable Labels and Stickers Revenue Share (%), by Application 2025 & 2033
- Figure 42: Middle East & Africa Compostable Labels and Stickers Volume Share (%), by Application 2025 & 2033
- Figure 43: Middle East & Africa Compostable Labels and Stickers Revenue (undefined), by Types 2025 & 2033
- Figure 44: Middle East & Africa Compostable Labels and Stickers Volume (K), by Types 2025 & 2033
- Figure 45: Middle East & Africa Compostable Labels and Stickers Revenue Share (%), by Types 2025 & 2033
- Figure 46: Middle East & Africa Compostable Labels and Stickers Volume Share (%), by Types 2025 & 2033
- Figure 47: Middle East & Africa Compostable Labels and Stickers Revenue (undefined), by Country 2025 & 2033
- Figure 48: Middle East & Africa Compostable Labels and Stickers Volume (K), by Country 2025 & 2033
- Figure 49: Middle East & Africa Compostable Labels and Stickers Revenue Share (%), by Country 2025 & 2033
- Figure 50: Middle East & Africa Compostable Labels and Stickers Volume Share (%), by Country 2025 & 2033
- Figure 51: Asia Pacific Compostable Labels and Stickers Revenue (undefined), by Application 2025 & 2033
- Figure 52: Asia Pacific Compostable Labels and Stickers Volume (K), by Application 2025 & 2033
- Figure 53: Asia Pacific Compostable Labels and Stickers Revenue Share (%), by Application 2025 & 2033
- Figure 54: Asia Pacific Compostable Labels and Stickers Volume Share (%), by Application 2025 & 2033
- Figure 55: Asia Pacific Compostable Labels and Stickers Revenue (undefined), by Types 2025 & 2033
- Figure 56: Asia Pacific Compostable Labels and Stickers Volume (K), by Types 2025 & 2033
- Figure 57: Asia Pacific Compostable Labels and Stickers Revenue Share (%), by Types 2025 & 2033
- Figure 58: Asia Pacific Compostable Labels and Stickers Volume Share (%), by Types 2025 & 2033
- Figure 59: Asia Pacific Compostable Labels and Stickers Revenue (undefined), by Country 2025 & 2033
- Figure 60: Asia Pacific Compostable Labels and Stickers Volume (K), by Country 2025 & 2033
- Figure 61: Asia Pacific Compostable Labels and Stickers Revenue Share (%), by Country 2025 & 2033
- Figure 62: Asia Pacific Compostable Labels and Stickers Volume Share (%), by Country 2025 & 2033
List of Tables
- Table 1: Global Compostable Labels and Stickers Revenue undefined Forecast, by Application 2020 & 2033
- Table 2: Global Compostable Labels and Stickers Volume K Forecast, by Application 2020 & 2033
- Table 3: Global Compostable Labels and Stickers Revenue undefined Forecast, by Types 2020 & 2033
- Table 4: Global Compostable Labels and Stickers Volume K Forecast, by Types 2020 & 2033
- Table 5: Global Compostable Labels and Stickers Revenue undefined Forecast, by Region 2020 & 2033
- Table 6: Global Compostable Labels and Stickers Volume K Forecast, by Region 2020 & 2033
- Table 7: Global Compostable Labels and Stickers Revenue undefined Forecast, by Application 2020 & 2033
- Table 8: Global Compostable Labels and Stickers Volume K Forecast, by Application 2020 & 2033
- Table 9: Global Compostable Labels and Stickers Revenue undefined Forecast, by Types 2020 & 2033
- Table 10: Global Compostable Labels and Stickers Volume K Forecast, by Types 2020 & 2033
- Table 11: Global Compostable Labels and Stickers Revenue undefined Forecast, by Country 2020 & 2033
- Table 12: Global Compostable Labels and Stickers Volume K Forecast, by Country 2020 & 2033
- Table 13: United States Compostable Labels and Stickers Revenue (undefined) Forecast, by Application 2020 & 2033
- Table 14: United States Compostable Labels and Stickers Volume (K) Forecast, by Application 2020 & 2033
- Table 15: Canada Compostable Labels and Stickers Revenue (undefined) Forecast, by Application 2020 & 2033
- Table 16: Canada Compostable Labels and Stickers Volume (K) Forecast, by Application 2020 & 2033
- Table 17: Mexico Compostable Labels and Stickers Revenue (undefined) Forecast, by Application 2020 & 2033
- Table 18: Mexico Compostable Labels and Stickers Volume (K) Forecast, by Application 2020 & 2033
- Table 19: Global Compostable Labels and Stickers Revenue undefined Forecast, by Application 2020 & 2033
- Table 20: Global Compostable Labels and Stickers Volume K Forecast, by Application 2020 & 2033
- Table 21: Global Compostable Labels and Stickers Revenue undefined Forecast, by Types 2020 & 2033
- Table 22: Global Compostable Labels and Stickers Volume K Forecast, by Types 2020 & 2033
- Table 23: Global Compostable Labels and Stickers Revenue undefined Forecast, by Country 2020 & 2033
- Table 24: Global Compostable Labels and Stickers Volume K Forecast, by Country 2020 & 2033
- Table 25: Brazil Compostable Labels and Stickers Revenue (undefined) Forecast, by Application 2020 & 2033
- Table 26: Brazil Compostable Labels and Stickers Volume (K) Forecast, by Application 2020 & 2033
- Table 27: Argentina Compostable Labels and Stickers Revenue (undefined) Forecast, by Application 2020 & 2033
- Table 28: Argentina Compostable Labels and Stickers Volume (K) Forecast, by Application 2020 & 2033
- Table 29: Rest of South America Compostable Labels and Stickers Revenue (undefined) Forecast, by Application 2020 & 2033
- Table 30: Rest of South America Compostable Labels and Stickers Volume (K) Forecast, by Application 2020 & 2033
- Table 31: Global Compostable Labels and Stickers Revenue undefined Forecast, by Application 2020 & 2033
- Table 32: Global Compostable Labels and Stickers Volume K Forecast, by Application 2020 & 2033
- Table 33: Global Compostable Labels and Stickers Revenue undefined Forecast, by Types 2020 & 2033
- Table 34: Global Compostable Labels and Stickers Volume K Forecast, by Types 2020 & 2033
- Table 35: Global Compostable Labels and Stickers Revenue undefined Forecast, by Country 2020 & 2033
- Table 36: Global Compostable Labels and Stickers Volume K Forecast, by Country 2020 & 2033
- Table 37: United Kingdom Compostable Labels and Stickers Revenue (undefined) Forecast, by Application 2020 & 2033
- Table 38: United Kingdom Compostable Labels and Stickers Volume (K) Forecast, by Application 2020 & 2033
- Table 39: Germany Compostable Labels and Stickers Revenue (undefined) Forecast, by Application 2020 & 2033
- Table 40: Germany Compostable Labels and Stickers Volume (K) Forecast, by Application 2020 & 2033
- Table 41: France Compostable Labels and Stickers Revenue (undefined) Forecast, by Application 2020 & 2033
- Table 42: France Compostable Labels and Stickers Volume (K) Forecast, by Application 2020 & 2033
- Table 43: Italy Compostable Labels and Stickers Revenue (undefined) Forecast, by Application 2020 & 2033
- Table 44: Italy Compostable Labels and Stickers Volume (K) Forecast, by Application 2020 & 2033
- Table 45: Spain Compostable Labels and Stickers Revenue (undefined) Forecast, by Application 2020 & 2033
- Table 46: Spain Compostable Labels and Stickers Volume (K) Forecast, by Application 2020 & 2033
- Table 47: Russia Compostable Labels and Stickers Revenue (undefined) Forecast, by Application 2020 & 2033
- Table 48: Russia Compostable Labels and Stickers Volume (K) Forecast, by Application 2020 & 2033
- Table 49: Benelux Compostable Labels and Stickers Revenue (undefined) Forecast, by Application 2020 & 2033
- Table 50: Benelux Compostable Labels and Stickers Volume (K) Forecast, by Application 2020 & 2033
- Table 51: Nordics Compostable Labels and Stickers Revenue (undefined) Forecast, by Application 2020 & 2033
- Table 52: Nordics Compostable Labels and Stickers Volume (K) Forecast, by Application 2020 & 2033
- Table 53: Rest of Europe Compostable Labels and Stickers Revenue (undefined) Forecast, by Application 2020 & 2033
- Table 54: Rest of Europe Compostable Labels and Stickers Volume (K) Forecast, by Application 2020 & 2033
- Table 55: Global Compostable Labels and Stickers Revenue undefined Forecast, by Application 2020 & 2033
- Table 56: Global Compostable Labels and Stickers Volume K Forecast, by Application 2020 & 2033
- Table 57: Global Compostable Labels and Stickers Revenue undefined Forecast, by Types 2020 & 2033
- Table 58: Global Compostable Labels and Stickers Volume K Forecast, by Types 2020 & 2033
- Table 59: Global Compostable Labels and Stickers Revenue undefined Forecast, by Country 2020 & 2033
- Table 60: Global Compostable Labels and Stickers Volume K Forecast, by Country 2020 & 2033
- Table 61: Turkey Compostable Labels and Stickers Revenue (undefined) Forecast, by Application 2020 & 2033
- Table 62: Turkey Compostable Labels and Stickers Volume (K) Forecast, by Application 2020 & 2033
- Table 63: Israel Compostable Labels and Stickers Revenue (undefined) Forecast, by Application 2020 & 2033
- Table 64: Israel Compostable Labels and Stickers Volume (K) Forecast, by Application 2020 & 2033
- Table 65: GCC Compostable Labels and Stickers Revenue (undefined) Forecast, by Application 2020 & 2033
- Table 66: GCC Compostable Labels and Stickers Volume (K) Forecast, by Application 2020 & 2033
- Table 67: North Africa Compostable Labels and Stickers Revenue (undefined) Forecast, by Application 2020 & 2033
- Table 68: North Africa Compostable Labels and Stickers Volume (K) Forecast, by Application 2020 & 2033
- Table 69: South Africa Compostable Labels and Stickers Revenue (undefined) Forecast, by Application 2020 & 2033
- Table 70: South Africa Compostable Labels and Stickers Volume (K) Forecast, by Application 2020 & 2033
- Table 71: Rest of Middle East & Africa Compostable Labels and Stickers Revenue (undefined) Forecast, by Application 2020 & 2033
- Table 72: Rest of Middle East & Africa Compostable Labels and Stickers Volume (K) Forecast, by Application 2020 & 2033
- Table 73: Global Compostable Labels and Stickers Revenue undefined Forecast, by Application 2020 & 2033
- Table 74: Global Compostable Labels and Stickers Volume K Forecast, by Application 2020 & 2033
- Table 75: Global Compostable Labels and Stickers Revenue undefined Forecast, by Types 2020 & 2033
- Table 76: Global Compostable Labels and Stickers Volume K Forecast, by Types 2020 & 2033
- Table 77: Global Compostable Labels and Stickers Revenue undefined Forecast, by Country 2020 & 2033
- Table 78: Global Compostable Labels and Stickers Volume K Forecast, by Country 2020 & 2033
- Table 79: China Compostable Labels and Stickers Revenue (undefined) Forecast, by Application 2020 & 2033
- Table 80: China Compostable Labels and Stickers Volume (K) Forecast, by Application 2020 & 2033
- Table 81: India Compostable Labels and Stickers Revenue (undefined) Forecast, by Application 2020 & 2033
- Table 82: India Compostable Labels and Stickers Volume (K) Forecast, by Application 2020 & 2033
- Table 83: Japan Compostable Labels and Stickers Revenue (undefined) Forecast, by Application 2020 & 2033
- Table 84: Japan Compostable Labels and Stickers Volume (K) Forecast, by Application 2020 & 2033
- Table 85: South Korea Compostable Labels and Stickers Revenue (undefined) Forecast, by Application 2020 & 2033
- Table 86: South Korea Compostable Labels and Stickers Volume (K) Forecast, by Application 2020 & 2033
- Table 87: ASEAN Compostable Labels and Stickers Revenue (undefined) Forecast, by Application 2020 & 2033
- Table 88: ASEAN Compostable Labels and Stickers Volume (K) Forecast, by Application 2020 & 2033
- Table 89: Oceania Compostable Labels and Stickers Revenue (undefined) Forecast, by Application 2020 & 2033
- Table 90: Oceania Compostable Labels and Stickers Volume (K) Forecast, by Application 2020 & 2033
- Table 91: Rest of Asia Pacific Compostable Labels and Stickers Revenue (undefined) Forecast, by Application 2020 & 2033
- Table 92: Rest of Asia Pacific Compostable Labels and Stickers Volume (K) Forecast, by Application 2020 & 2033
Frequently Asked Questions
1. What is the projected Compound Annual Growth Rate (CAGR) of the Compostable Labels and Stickers?
The projected CAGR is approximately 5.81%.
2. Which companies are prominent players in the Compostable Labels and Stickers?
Key companies in the market include HERMA Labels, PURE Labels, inkREADible, Green Label, Optimum Group, A4Labels, Wedderburn, Labels Plus, Elevate Packaging, Xinxing Label, Avery Dennison, Huizhou Yito Packaging.
3. What are the main segments of the Compostable Labels and Stickers?
The market segments include Application, Types.
4. Can you provide details about the market size?
The market size is estimated to be USD XXX N/A as of 2022.
5. What are some drivers contributing to market growth?
N/A
6. What are the notable trends driving market growth?
N/A
7. Are there any restraints impacting market growth?
N/A
8. Can you provide examples of recent developments in the market?
N/A
9. What pricing options are available for accessing the report?
Pricing options include single-user, multi-user, and enterprise licenses priced at USD 3950.00, USD 5925.00, and USD 7900.00 respectively.
10. Is the market size provided in terms of value or volume?
The market size is provided in terms of value, measured in N/A and volume, measured in K.
11. Are there any specific market keywords associated with the report?
Yes, the market keyword associated with the report is "Compostable Labels and Stickers," which aids in identifying and referencing the specific market segment covered.
12. How do I determine which pricing option suits my needs best?
The pricing options vary based on user requirements and access needs. Individual users may opt for single-user licenses, while businesses requiring broader access may choose multi-user or enterprise licenses for cost-effective access to the report.
13. Are there any additional resources or data provided in the Compostable Labels and Stickers report?
While the report offers comprehensive insights, it's advisable to review the specific contents or supplementary materials provided to ascertain if additional resources or data are available.
14. How can I stay updated on further developments or reports in the Compostable Labels and Stickers?
To stay informed about further developments, trends, and reports in the Compostable Labels and Stickers, consider subscribing to industry newsletters, following relevant companies and organizations, or regularly checking reputable industry news sources and publications.
Methodology
Step 1 - Identification of Relevant Samples Size from Population Database


Step 2 - Approaches for Defining Global Market Size (Value, Volume* & Price*)

Note*: In applicable scenarios
Step 3 - Data Sources
Primary Research
- Web Analytics
- Survey Reports
- Research Institute
- Latest Research Reports
- Opinion Leaders
Secondary Research
- Annual Reports
- White Paper
- Latest Press Release
- Industry Association
- Paid Database
- Investor Presentations

Step 4 - Data Triangulation
Involves using different sources of information in order to increase the validity of a study
These sources are likely to be stakeholders in a program - participants, other researchers, program staff, other community members, and so on.
Then we put all data in single framework & apply various statistical tools to find out the dynamic on the market.
During the analysis stage, feedback from the stakeholder groups would be compared to determine areas of agreement as well as areas of divergence