
Key Insights
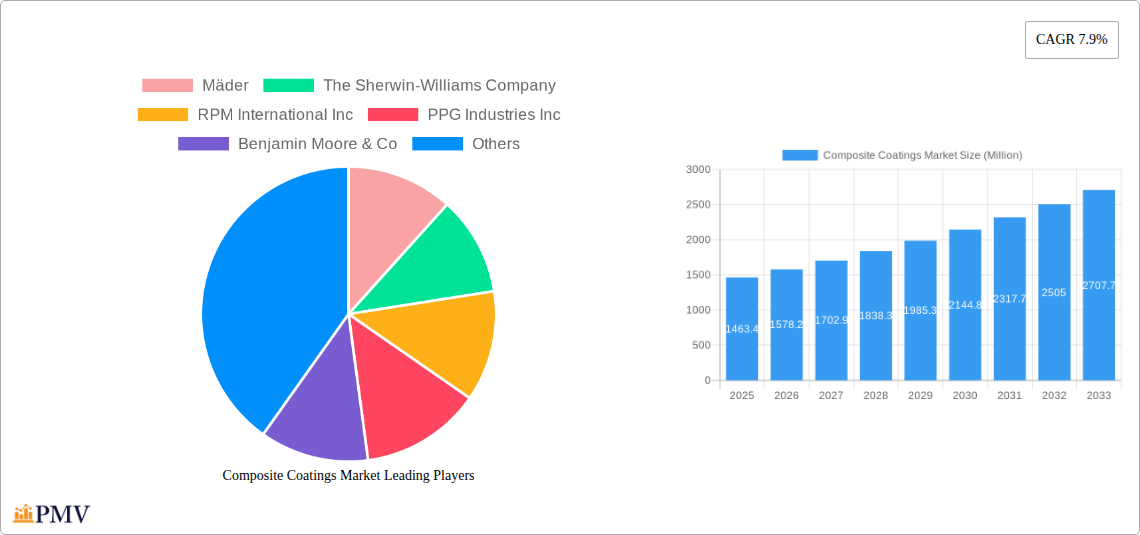
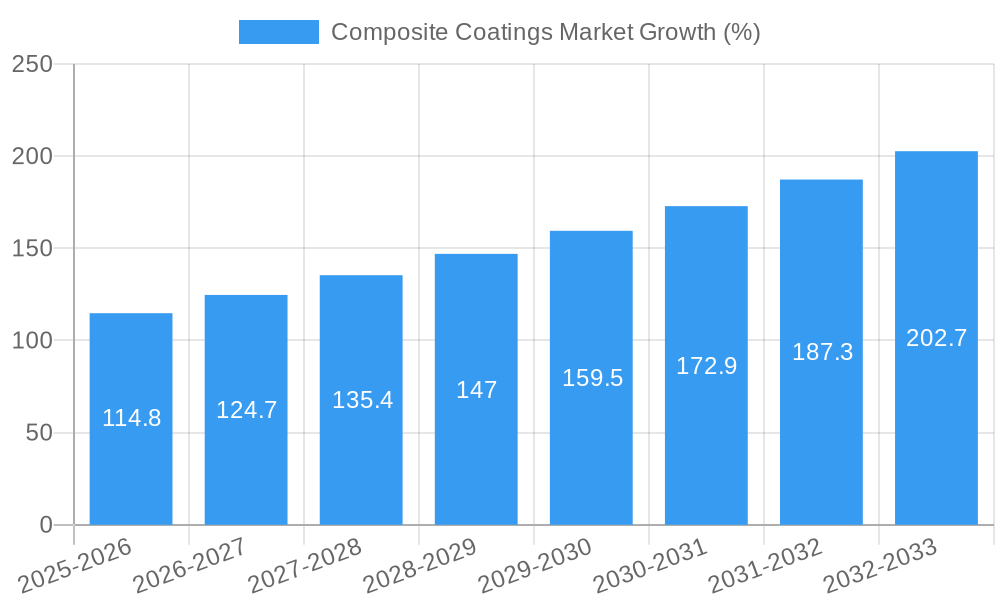
The global composite coatings market, valued at $1463.4 million in 2025, is projected to experience robust growth, driven by a Compound Annual Growth Rate (CAGR) of 7.9% from 2025 to 2033. This expansion is fueled by several key factors. The increasing demand for lightweight yet high-strength materials in diverse sectors like automotive and aerospace is a significant driver. The automotive industry's push for fuel efficiency and improved vehicle performance is stimulating the adoption of composite materials, consequently boosting the demand for protective and functional coatings. Furthermore, the infrastructure sector's ongoing investments in durable and corrosion-resistant materials for construction and bridge building are creating substantial market opportunities. Growth within the marine industry, where composite coatings provide essential protection against harsh marine environments, further contributes to this upward trajectory. Technological advancements in coating techniques, such as laser-melt injection and electroless plating, are improving coating quality and efficiency, leading to wider adoption across various applications. While challenges exist, such as the relatively high cost of some composite materials and coatings, ongoing innovation and the increasing awareness of the long-term cost benefits are mitigating these restraints. The market's segmentation reflects its diverse applications, with polyester, polyamide, and epoxy resins being prominent, and end-user industries like automotive, marine, and infrastructure contributing substantially to market volume.
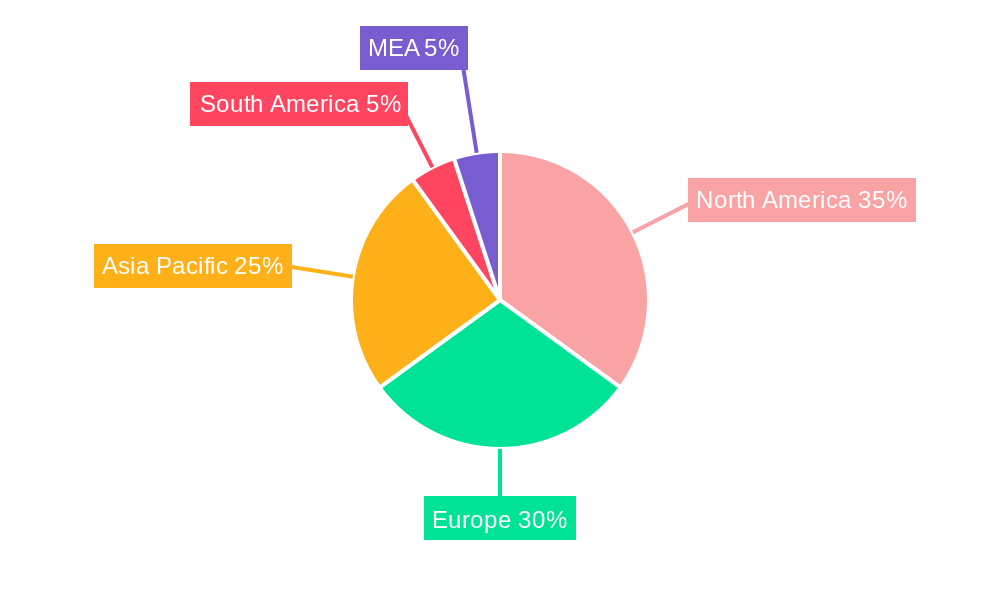
The geographical distribution of the market reflects the global nature of its applications. North America and Europe are currently major contributors, driven by established automotive and infrastructure sectors. However, the Asia-Pacific region is poised for significant growth, particularly China and India, owing to rapid industrialization and rising infrastructure development. The market's competitive landscape is characterized by both large multinational corporations and specialized coating providers. Strategic partnerships, mergers, and acquisitions are expected to reshape the market dynamics in the coming years, driving further innovation and expansion. The continued focus on sustainable and environmentally friendly coatings will likely shape future product development and market trends, favoring companies that offer eco-conscious solutions. Overall, the composite coatings market presents a lucrative opportunity for businesses that can meet the growing demand for high-performance, durable, and sustainable coating solutions across diverse industrial sectors.
Composite Coatings Market: A Comprehensive Report (2019-2033)
This detailed report provides a comprehensive analysis of the global Composite Coatings Market, offering invaluable insights for businesses, investors, and researchers. Covering the period from 2019 to 2033, with a focus on 2025, this study dissects market dynamics, competitive landscapes, and future growth potential. The report utilizes a robust methodology incorporating historical data (2019-2024), current estimations (2025), and future projections (2025-2033) to deliver actionable intelligence.
Composite Coatings Market Structure & Competitive Dynamics
This section analyzes the competitive intensity of the composite coatings market, examining market concentration, innovation ecosystems, regulatory frameworks, and the influence of substitute products. We explore end-user trends, M&A activities, and their impact on market share. The report includes quantitative data on market share held by key players such as Mäder, The Sherwin-Williams Company, RPM International Inc, PPG Industries Inc, Benjamin Moore & Co, AkzoNobel NV, FUSION MINERAL PAINT, KEIM Mineral Coatings of America Inc, K C Jones Plating Company, and BEECK Mineral Paints. The analysis considers the value of significant M&A deals, revealing strategic shifts and market consolidation. We delve into the regulatory landscape, highlighting its impact on innovation and market access. Furthermore, the report assesses the competitive pressures stemming from substitute products and identifies emerging trends shaping the market's competitive dynamics. The overall market concentration is estimated at xx%, with the top 5 players holding approximately xx% of the market share in 2025. Several M&A deals exceeding $xx Million have shaped the market landscape in the past five years, driving consolidation and influencing market pricing.
Composite Coatings Market Industry Trends & Insights
This section presents a detailed analysis of the key trends shaping the Composite Coatings Market. We explore market growth drivers, technological advancements, shifts in consumer preferences, and the evolving competitive landscape. The report will provide a comprehensive understanding of the factors driving market growth, including increasing demand from key end-user industries, advancements in composite material technology, and the development of more sustainable and high-performance coatings. Furthermore, we examine the impact of technological disruptions, such as the adoption of advanced manufacturing techniques and the rise of digital technologies on the market. The report quantifies market growth using the Compound Annual Growth Rate (CAGR), projecting a CAGR of xx% during the forecast period (2025-2033). Market penetration rates for different coating types across various end-user industries are also analyzed, providing valuable insights into market dynamics.
Dominant Markets & Segments in Composite Coatings Market
This section identifies the leading regions, countries, and segments within the Composite Coatings Market. We analyze dominant segments across resin types (Polyester, Polyamide, Epoxy, Others), application techniques (Laser-melt Injection, Electroless Plating, Brazing, Others), and end-user industries (Marine, Automotive and Other Transportation, Infrastructure, Oil and Gas, Others (Including Medical)). The analysis reveals the key drivers of dominance for each segment, including economic policies, infrastructure development, and technological advancements.
- Leading Region: North America is projected to be the dominant region in 2025, driven by robust infrastructure investments and strong demand from the automotive and marine sectors.
- Leading Resin Type: Polyester resin is expected to hold the largest market share in 2025 due to its cost-effectiveness and versatility.
- Leading Application Technique: Electroless plating is expected to dominate the application technique segment owing to its ability to provide uniform and durable coatings.
- Leading End-User Industry: The automotive and other transportation sectors are projected to drive significant market growth due to the increasing demand for lightweight and high-performance vehicles.
The report delves into a detailed analysis of each leading segment, providing comprehensive insights into market dynamics and future growth prospects.
Composite Coatings Market Product Innovations
Recent years have witnessed significant innovations in composite coatings, focusing on enhanced durability, improved aesthetics, and the integration of advanced functionalities. New coatings offer superior corrosion resistance, UV protection, and improved scratch resistance, expanding application possibilities in diverse sectors. The development of eco-friendly, low-VOC formulations reflects growing environmental consciousness and regulatory pressures. These innovations are improving market fit by addressing specific needs within various industries, driving adoption and market expansion.
Report Segmentation & Scope
This report segments the Composite Coatings market by resin type (Polyester, Polyamide, Epoxy, Others), application technique (Laser-melt Injection, Electroless Plating, Brazing, Others), and end-user industry (Marine, Automotive and Other Transportation, Infrastructure, Oil and Gas, Others (Including Medical)). Each segment's growth projections, market size estimates (in Million), and competitive dynamics are detailed. The market size for each segment is provided for the historical period (2019-2024), the base year (2025), and the forecast period (2025-2033). Competitive analyses within each segment highlight key players and their market positions.
Key Drivers of Composite Coatings Market Growth
Several factors are propelling the growth of the Composite Coatings Market. Technological advancements in coating materials and application techniques are leading to improved performance and durability. Stringent environmental regulations are promoting the adoption of eco-friendly coatings. Expanding infrastructure projects and the growth of the automotive and marine industries are driving significant demand. Government initiatives supporting the development of advanced materials further contribute to market expansion.
Challenges in the Composite Coatings Market Sector
The Composite Coatings Market faces challenges such as fluctuating raw material prices, supply chain disruptions, and intense competition among established players. Stringent regulatory requirements regarding volatile organic compounds (VOCs) and other environmental concerns necessitate compliance investments. The need for continuous innovation to meet evolving end-user demands and maintain competitive advantage presents an ongoing challenge for market participants.
Leading Players in the Composite Coatings Market
- Mäder
- The Sherwin-Williams Company
- RPM International Inc
- PPG Industries Inc
- Benjamin Moore & Co
- AkzoNobel NV
- FUSION MINERAL PAINT
- KEIM Mineral Coatings of America Inc
- K C Jones Plating Company
- BEECK Mineral Paints
Key Developments in Composite Coatings Market Sector
- January 2023: AkzoNobel launched a new range of sustainable composite coatings.
- June 2022: PPG Industries acquired a smaller composite coatings manufacturer, expanding its market reach.
- October 2021: Mäder introduced a new high-performance epoxy coating for marine applications. (Further developments will be detailed in the full report)
Strategic Composite Coatings Market Outlook
The Composite Coatings Market exhibits strong growth potential driven by the expanding adoption of composite materials across various industries, coupled with continuous innovation in coating technologies. Strategic opportunities exist in developing sustainable and high-performance coatings tailored to meet the specific demands of niche markets. Focusing on research and development to enhance product capabilities and exploring strategic partnerships can significantly strengthen market positioning. The market's future outlook is positive, with significant opportunities for growth and expansion.
Composite Coatings Market Segmentation
-
1. Resin
- 1.1. Polyester
- 1.2. Polyamide
- 1.3. Epoxy
- 1.4. Others
-
2. Technique
- 2.1. Laser-melt Injection
- 2.2. Electroless Plating
- 2.3. Brazing
- 2.4. Others
-
3. End-User Industry
- 3.1. Marine
- 3.2. Automotive and Other Transportation
- 3.3. Infrastructure
- 3.4. Oil and Gas
- 3.5. Others (Including Medical)
Composite Coatings Market Segmentation By Geography
-
1. Asia Pacific
- 1.1. China
- 1.2. India
- 1.3. Japan
- 1.4. South Korea
- 1.5. Rest of Asia Pacific
-
2. North America
- 2.1. United States
- 2.2. Canada
- 2.3. Mexico
-
3. Europe
- 3.1. Germany
- 3.2. United Kingdom
- 3.3. Italy
- 3.4. France
- 3.5. Rest of Europe
-
4. South America
- 4.1. Brazil
- 4.2. Argentina
- 4.3. Rest of South America
- 5. Middle East
-
6. Saudi Arabia
- 6.1. South Africa
- 6.2. Rest of Middle East
Composite Coatings Market REPORT HIGHLIGHTS
| Aspects | Details |
|---|---|
| Study Period | 2019-2033 |
| Base Year | 2024 |
| Estimated Year | 2025 |
| Forecast Period | 2025-2033 |
| Historical Period | 2019-2024 |
| Growth Rate | CAGR of 7.9% from 2019-2033 |
| Segmentation |
|
Table of Contents
- 1. Introduction
- 1.1. Research Scope
- 1.2. Market Segmentation
- 1.3. Research Methodology
- 1.4. Definitions and Assumptions
- 2. Executive Summary
- 2.1. Introduction
- 3. Market Dynamics
- 3.1. Introduction
- 3.2. Market Drivers
- 3.2.1. ; Growth in Oil & Gas Exploration Activities; Others
- 3.3. Market Restrains
- 3.3.1. ; High Processing Cost
- 3.4. Market Trends
- 3.4.1. Increasing Demand for Oil and Gas
- 4. Market Factor Analysis
- 4.1. Porters Five Forces
- 4.2. Supply/Value Chain
- 4.3. PESTEL analysis
- 4.4. Market Entropy
- 4.5. Patent/Trademark Analysis
- 5. Global Composite Coatings Market Analysis, Insights and Forecast, 2019-2031
- 5.1. Market Analysis, Insights and Forecast - by Resin
- 5.1.1. Polyester
- 5.1.2. Polyamide
- 5.1.3. Epoxy
- 5.1.4. Others
- 5.2. Market Analysis, Insights and Forecast - by Technique
- 5.2.1. Laser-melt Injection
- 5.2.2. Electroless Plating
- 5.2.3. Brazing
- 5.2.4. Others
- 5.3. Market Analysis, Insights and Forecast - by End-User Industry
- 5.3.1. Marine
- 5.3.2. Automotive and Other Transportation
- 5.3.3. Infrastructure
- 5.3.4. Oil and Gas
- 5.3.5. Others (Including Medical)
- 5.4. Market Analysis, Insights and Forecast - by Region
- 5.4.1. Asia Pacific
- 5.4.2. North America
- 5.4.3. Europe
- 5.4.4. South America
- 5.4.5. Middle East
- 5.4.6. Saudi Arabia
- 5.1. Market Analysis, Insights and Forecast - by Resin
- 6. Asia Pacific Composite Coatings Market Analysis, Insights and Forecast, 2019-2031
- 6.1. Market Analysis, Insights and Forecast - by Resin
- 6.1.1. Polyester
- 6.1.2. Polyamide
- 6.1.3. Epoxy
- 6.1.4. Others
- 6.2. Market Analysis, Insights and Forecast - by Technique
- 6.2.1. Laser-melt Injection
- 6.2.2. Electroless Plating
- 6.2.3. Brazing
- 6.2.4. Others
- 6.3. Market Analysis, Insights and Forecast - by End-User Industry
- 6.3.1. Marine
- 6.3.2. Automotive and Other Transportation
- 6.3.3. Infrastructure
- 6.3.4. Oil and Gas
- 6.3.5. Others (Including Medical)
- 6.1. Market Analysis, Insights and Forecast - by Resin
- 7. North America Composite Coatings Market Analysis, Insights and Forecast, 2019-2031
- 7.1. Market Analysis, Insights and Forecast - by Resin
- 7.1.1. Polyester
- 7.1.2. Polyamide
- 7.1.3. Epoxy
- 7.1.4. Others
- 7.2. Market Analysis, Insights and Forecast - by Technique
- 7.2.1. Laser-melt Injection
- 7.2.2. Electroless Plating
- 7.2.3. Brazing
- 7.2.4. Others
- 7.3. Market Analysis, Insights and Forecast - by End-User Industry
- 7.3.1. Marine
- 7.3.2. Automotive and Other Transportation
- 7.3.3. Infrastructure
- 7.3.4. Oil and Gas
- 7.3.5. Others (Including Medical)
- 7.1. Market Analysis, Insights and Forecast - by Resin
- 8. Europe Composite Coatings Market Analysis, Insights and Forecast, 2019-2031
- 8.1. Market Analysis, Insights and Forecast - by Resin
- 8.1.1. Polyester
- 8.1.2. Polyamide
- 8.1.3. Epoxy
- 8.1.4. Others
- 8.2. Market Analysis, Insights and Forecast - by Technique
- 8.2.1. Laser-melt Injection
- 8.2.2. Electroless Plating
- 8.2.3. Brazing
- 8.2.4. Others
- 8.3. Market Analysis, Insights and Forecast - by End-User Industry
- 8.3.1. Marine
- 8.3.2. Automotive and Other Transportation
- 8.3.3. Infrastructure
- 8.3.4. Oil and Gas
- 8.3.5. Others (Including Medical)
- 8.1. Market Analysis, Insights and Forecast - by Resin
- 9. South America Composite Coatings Market Analysis, Insights and Forecast, 2019-2031
- 9.1. Market Analysis, Insights and Forecast - by Resin
- 9.1.1. Polyester
- 9.1.2. Polyamide
- 9.1.3. Epoxy
- 9.1.4. Others
- 9.2. Market Analysis, Insights and Forecast - by Technique
- 9.2.1. Laser-melt Injection
- 9.2.2. Electroless Plating
- 9.2.3. Brazing
- 9.2.4. Others
- 9.3. Market Analysis, Insights and Forecast - by End-User Industry
- 9.3.1. Marine
- 9.3.2. Automotive and Other Transportation
- 9.3.3. Infrastructure
- 9.3.4. Oil and Gas
- 9.3.5. Others (Including Medical)
- 9.1. Market Analysis, Insights and Forecast - by Resin
- 10. Middle East Composite Coatings Market Analysis, Insights and Forecast, 2019-2031
- 10.1. Market Analysis, Insights and Forecast - by Resin
- 10.1.1. Polyester
- 10.1.2. Polyamide
- 10.1.3. Epoxy
- 10.1.4. Others
- 10.2. Market Analysis, Insights and Forecast - by Technique
- 10.2.1. Laser-melt Injection
- 10.2.2. Electroless Plating
- 10.2.3. Brazing
- 10.2.4. Others
- 10.3. Market Analysis, Insights and Forecast - by End-User Industry
- 10.3.1. Marine
- 10.3.2. Automotive and Other Transportation
- 10.3.3. Infrastructure
- 10.3.4. Oil and Gas
- 10.3.5. Others (Including Medical)
- 10.1. Market Analysis, Insights and Forecast - by Resin
- 11. Saudi Arabia Composite Coatings Market Analysis, Insights and Forecast, 2019-2031
- 11.1. Market Analysis, Insights and Forecast - by Resin
- 11.1.1. Polyester
- 11.1.2. Polyamide
- 11.1.3. Epoxy
- 11.1.4. Others
- 11.2. Market Analysis, Insights and Forecast - by Technique
- 11.2.1. Laser-melt Injection
- 11.2.2. Electroless Plating
- 11.2.3. Brazing
- 11.2.4. Others
- 11.3. Market Analysis, Insights and Forecast - by End-User Industry
- 11.3.1. Marine
- 11.3.2. Automotive and Other Transportation
- 11.3.3. Infrastructure
- 11.3.4. Oil and Gas
- 11.3.5. Others (Including Medical)
- 11.1. Market Analysis, Insights and Forecast - by Resin
- 12. North America Composite Coatings Market Analysis, Insights and Forecast, 2019-2031
- 12.1. Market Analysis, Insights and Forecast - By Country/Sub-region
- 12.1.1 United States
- 12.1.2 Canada
- 12.1.3 Mexico
- 13. Europe Composite Coatings Market Analysis, Insights and Forecast, 2019-2031
- 13.1. Market Analysis, Insights and Forecast - By Country/Sub-region
- 13.1.1 Germany
- 13.1.2 France
- 13.1.3 Italy
- 13.1.4 United Kingdom
- 13.1.5 Netherlands
- 13.1.6 Rest of Europe
- 14. Asia Pacific Composite Coatings Market Analysis, Insights and Forecast, 2019-2031
- 14.1. Market Analysis, Insights and Forecast - By Country/Sub-region
- 14.1.1 China
- 14.1.2 Japan
- 14.1.3 India
- 14.1.4 South Korea
- 14.1.5 Taiwan
- 14.1.6 Australia
- 14.1.7 Rest of Asia-Pacific
- 15. South America Composite Coatings Market Analysis, Insights and Forecast, 2019-2031
- 15.1. Market Analysis, Insights and Forecast - By Country/Sub-region
- 15.1.1 Brazil
- 15.1.2 Argentina
- 15.1.3 Rest of South America
- 16. MEA Composite Coatings Market Analysis, Insights and Forecast, 2019-2031
- 16.1. Market Analysis, Insights and Forecast - By Country/Sub-region
- 16.1.1 Middle East
- 16.1.2 Africa
- 17. Competitive Analysis
- 17.1. Global Market Share Analysis 2024
- 17.2. Company Profiles
- 17.2.1 Mäder
- 17.2.1.1. Overview
- 17.2.1.2. Products
- 17.2.1.3. SWOT Analysis
- 17.2.1.4. Recent Developments
- 17.2.1.5. Financials (Based on Availability)
- 17.2.2 The Sherwin-Williams Company
- 17.2.2.1. Overview
- 17.2.2.2. Products
- 17.2.2.3. SWOT Analysis
- 17.2.2.4. Recent Developments
- 17.2.2.5. Financials (Based on Availability)
- 17.2.3 RPM International Inc
- 17.2.3.1. Overview
- 17.2.3.2. Products
- 17.2.3.3. SWOT Analysis
- 17.2.3.4. Recent Developments
- 17.2.3.5. Financials (Based on Availability)
- 17.2.4 PPG Industries Inc
- 17.2.4.1. Overview
- 17.2.4.2. Products
- 17.2.4.3. SWOT Analysis
- 17.2.4.4. Recent Developments
- 17.2.4.5. Financials (Based on Availability)
- 17.2.5 Benjamin Moore & Co
- 17.2.5.1. Overview
- 17.2.5.2. Products
- 17.2.5.3. SWOT Analysis
- 17.2.5.4. Recent Developments
- 17.2.5.5. Financials (Based on Availability)
- 17.2.6 AkzoNobel NV
- 17.2.6.1. Overview
- 17.2.6.2. Products
- 17.2.6.3. SWOT Analysis
- 17.2.6.4. Recent Developments
- 17.2.6.5. Financials (Based on Availability)
- 17.2.7 FUSION MINERAL PAINT
- 17.2.7.1. Overview
- 17.2.7.2. Products
- 17.2.7.3. SWOT Analysis
- 17.2.7.4. Recent Developments
- 17.2.7.5. Financials (Based on Availability)
- 17.2.8 KEIM Mineral Coatings of America Inc
- 17.2.8.1. Overview
- 17.2.8.2. Products
- 17.2.8.3. SWOT Analysis
- 17.2.8.4. Recent Developments
- 17.2.8.5. Financials (Based on Availability)
- 17.2.9 K C Jones Plating Company
- 17.2.9.1. Overview
- 17.2.9.2. Products
- 17.2.9.3. SWOT Analysis
- 17.2.9.4. Recent Developments
- 17.2.9.5. Financials (Based on Availability)
- 17.2.10 BEECK Mineral Paints
- 17.2.10.1. Overview
- 17.2.10.2. Products
- 17.2.10.3. SWOT Analysis
- 17.2.10.4. Recent Developments
- 17.2.10.5. Financials (Based on Availability)
- 17.2.1 Mäder
List of Figures
- Figure 1: Global Composite Coatings Market Revenue Breakdown (Million, %) by Region 2024 & 2032
- Figure 2: Global Composite Coatings Market Volume Breakdown (K Tons, %) by Region 2024 & 2032
- Figure 3: North America Composite Coatings Market Revenue (Million), by Country 2024 & 2032
- Figure 4: North America Composite Coatings Market Volume (K Tons), by Country 2024 & 2032
- Figure 5: North America Composite Coatings Market Revenue Share (%), by Country 2024 & 2032
- Figure 6: North America Composite Coatings Market Volume Share (%), by Country 2024 & 2032
- Figure 7: Europe Composite Coatings Market Revenue (Million), by Country 2024 & 2032
- Figure 8: Europe Composite Coatings Market Volume (K Tons), by Country 2024 & 2032
- Figure 9: Europe Composite Coatings Market Revenue Share (%), by Country 2024 & 2032
- Figure 10: Europe Composite Coatings Market Volume Share (%), by Country 2024 & 2032
- Figure 11: Asia Pacific Composite Coatings Market Revenue (Million), by Country 2024 & 2032
- Figure 12: Asia Pacific Composite Coatings Market Volume (K Tons), by Country 2024 & 2032
- Figure 13: Asia Pacific Composite Coatings Market Revenue Share (%), by Country 2024 & 2032
- Figure 14: Asia Pacific Composite Coatings Market Volume Share (%), by Country 2024 & 2032
- Figure 15: South America Composite Coatings Market Revenue (Million), by Country 2024 & 2032
- Figure 16: South America Composite Coatings Market Volume (K Tons), by Country 2024 & 2032
- Figure 17: South America Composite Coatings Market Revenue Share (%), by Country 2024 & 2032
- Figure 18: South America Composite Coatings Market Volume Share (%), by Country 2024 & 2032
- Figure 19: MEA Composite Coatings Market Revenue (Million), by Country 2024 & 2032
- Figure 20: MEA Composite Coatings Market Volume (K Tons), by Country 2024 & 2032
- Figure 21: MEA Composite Coatings Market Revenue Share (%), by Country 2024 & 2032
- Figure 22: MEA Composite Coatings Market Volume Share (%), by Country 2024 & 2032
- Figure 23: Asia Pacific Composite Coatings Market Revenue (Million), by Resin 2024 & 2032
- Figure 24: Asia Pacific Composite Coatings Market Volume (K Tons), by Resin 2024 & 2032
- Figure 25: Asia Pacific Composite Coatings Market Revenue Share (%), by Resin 2024 & 2032
- Figure 26: Asia Pacific Composite Coatings Market Volume Share (%), by Resin 2024 & 2032
- Figure 27: Asia Pacific Composite Coatings Market Revenue (Million), by Technique 2024 & 2032
- Figure 28: Asia Pacific Composite Coatings Market Volume (K Tons), by Technique 2024 & 2032
- Figure 29: Asia Pacific Composite Coatings Market Revenue Share (%), by Technique 2024 & 2032
- Figure 30: Asia Pacific Composite Coatings Market Volume Share (%), by Technique 2024 & 2032
- Figure 31: Asia Pacific Composite Coatings Market Revenue (Million), by End-User Industry 2024 & 2032
- Figure 32: Asia Pacific Composite Coatings Market Volume (K Tons), by End-User Industry 2024 & 2032
- Figure 33: Asia Pacific Composite Coatings Market Revenue Share (%), by End-User Industry 2024 & 2032
- Figure 34: Asia Pacific Composite Coatings Market Volume Share (%), by End-User Industry 2024 & 2032
- Figure 35: Asia Pacific Composite Coatings Market Revenue (Million), by Country 2024 & 2032
- Figure 36: Asia Pacific Composite Coatings Market Volume (K Tons), by Country 2024 & 2032
- Figure 37: Asia Pacific Composite Coatings Market Revenue Share (%), by Country 2024 & 2032
- Figure 38: Asia Pacific Composite Coatings Market Volume Share (%), by Country 2024 & 2032
- Figure 39: North America Composite Coatings Market Revenue (Million), by Resin 2024 & 2032
- Figure 40: North America Composite Coatings Market Volume (K Tons), by Resin 2024 & 2032
- Figure 41: North America Composite Coatings Market Revenue Share (%), by Resin 2024 & 2032
- Figure 42: North America Composite Coatings Market Volume Share (%), by Resin 2024 & 2032
- Figure 43: North America Composite Coatings Market Revenue (Million), by Technique 2024 & 2032
- Figure 44: North America Composite Coatings Market Volume (K Tons), by Technique 2024 & 2032
- Figure 45: North America Composite Coatings Market Revenue Share (%), by Technique 2024 & 2032
- Figure 46: North America Composite Coatings Market Volume Share (%), by Technique 2024 & 2032
- Figure 47: North America Composite Coatings Market Revenue (Million), by End-User Industry 2024 & 2032
- Figure 48: North America Composite Coatings Market Volume (K Tons), by End-User Industry 2024 & 2032
- Figure 49: North America Composite Coatings Market Revenue Share (%), by End-User Industry 2024 & 2032
- Figure 50: North America Composite Coatings Market Volume Share (%), by End-User Industry 2024 & 2032
- Figure 51: North America Composite Coatings Market Revenue (Million), by Country 2024 & 2032
- Figure 52: North America Composite Coatings Market Volume (K Tons), by Country 2024 & 2032
- Figure 53: North America Composite Coatings Market Revenue Share (%), by Country 2024 & 2032
- Figure 54: North America Composite Coatings Market Volume Share (%), by Country 2024 & 2032
- Figure 55: Europe Composite Coatings Market Revenue (Million), by Resin 2024 & 2032
- Figure 56: Europe Composite Coatings Market Volume (K Tons), by Resin 2024 & 2032
- Figure 57: Europe Composite Coatings Market Revenue Share (%), by Resin 2024 & 2032
- Figure 58: Europe Composite Coatings Market Volume Share (%), by Resin 2024 & 2032
- Figure 59: Europe Composite Coatings Market Revenue (Million), by Technique 2024 & 2032
- Figure 60: Europe Composite Coatings Market Volume (K Tons), by Technique 2024 & 2032
- Figure 61: Europe Composite Coatings Market Revenue Share (%), by Technique 2024 & 2032
- Figure 62: Europe Composite Coatings Market Volume Share (%), by Technique 2024 & 2032
- Figure 63: Europe Composite Coatings Market Revenue (Million), by End-User Industry 2024 & 2032
- Figure 64: Europe Composite Coatings Market Volume (K Tons), by End-User Industry 2024 & 2032
- Figure 65: Europe Composite Coatings Market Revenue Share (%), by End-User Industry 2024 & 2032
- Figure 66: Europe Composite Coatings Market Volume Share (%), by End-User Industry 2024 & 2032
- Figure 67: Europe Composite Coatings Market Revenue (Million), by Country 2024 & 2032
- Figure 68: Europe Composite Coatings Market Volume (K Tons), by Country 2024 & 2032
- Figure 69: Europe Composite Coatings Market Revenue Share (%), by Country 2024 & 2032
- Figure 70: Europe Composite Coatings Market Volume Share (%), by Country 2024 & 2032
- Figure 71: South America Composite Coatings Market Revenue (Million), by Resin 2024 & 2032
- Figure 72: South America Composite Coatings Market Volume (K Tons), by Resin 2024 & 2032
- Figure 73: South America Composite Coatings Market Revenue Share (%), by Resin 2024 & 2032
- Figure 74: South America Composite Coatings Market Volume Share (%), by Resin 2024 & 2032
- Figure 75: South America Composite Coatings Market Revenue (Million), by Technique 2024 & 2032
- Figure 76: South America Composite Coatings Market Volume (K Tons), by Technique 2024 & 2032
- Figure 77: South America Composite Coatings Market Revenue Share (%), by Technique 2024 & 2032
- Figure 78: South America Composite Coatings Market Volume Share (%), by Technique 2024 & 2032
- Figure 79: South America Composite Coatings Market Revenue (Million), by End-User Industry 2024 & 2032
- Figure 80: South America Composite Coatings Market Volume (K Tons), by End-User Industry 2024 & 2032
- Figure 81: South America Composite Coatings Market Revenue Share (%), by End-User Industry 2024 & 2032
- Figure 82: South America Composite Coatings Market Volume Share (%), by End-User Industry 2024 & 2032
- Figure 83: South America Composite Coatings Market Revenue (Million), by Country 2024 & 2032
- Figure 84: South America Composite Coatings Market Volume (K Tons), by Country 2024 & 2032
- Figure 85: South America Composite Coatings Market Revenue Share (%), by Country 2024 & 2032
- Figure 86: South America Composite Coatings Market Volume Share (%), by Country 2024 & 2032
- Figure 87: Middle East Composite Coatings Market Revenue (Million), by Resin 2024 & 2032
- Figure 88: Middle East Composite Coatings Market Volume (K Tons), by Resin 2024 & 2032
- Figure 89: Middle East Composite Coatings Market Revenue Share (%), by Resin 2024 & 2032
- Figure 90: Middle East Composite Coatings Market Volume Share (%), by Resin 2024 & 2032
- Figure 91: Middle East Composite Coatings Market Revenue (Million), by Technique 2024 & 2032
- Figure 92: Middle East Composite Coatings Market Volume (K Tons), by Technique 2024 & 2032
- Figure 93: Middle East Composite Coatings Market Revenue Share (%), by Technique 2024 & 2032
- Figure 94: Middle East Composite Coatings Market Volume Share (%), by Technique 2024 & 2032
- Figure 95: Middle East Composite Coatings Market Revenue (Million), by End-User Industry 2024 & 2032
- Figure 96: Middle East Composite Coatings Market Volume (K Tons), by End-User Industry 2024 & 2032
- Figure 97: Middle East Composite Coatings Market Revenue Share (%), by End-User Industry 2024 & 2032
- Figure 98: Middle East Composite Coatings Market Volume Share (%), by End-User Industry 2024 & 2032
- Figure 99: Middle East Composite Coatings Market Revenue (Million), by Country 2024 & 2032
- Figure 100: Middle East Composite Coatings Market Volume (K Tons), by Country 2024 & 2032
- Figure 101: Middle East Composite Coatings Market Revenue Share (%), by Country 2024 & 2032
- Figure 102: Middle East Composite Coatings Market Volume Share (%), by Country 2024 & 2032
- Figure 103: Saudi Arabia Composite Coatings Market Revenue (Million), by Resin 2024 & 2032
- Figure 104: Saudi Arabia Composite Coatings Market Volume (K Tons), by Resin 2024 & 2032
- Figure 105: Saudi Arabia Composite Coatings Market Revenue Share (%), by Resin 2024 & 2032
- Figure 106: Saudi Arabia Composite Coatings Market Volume Share (%), by Resin 2024 & 2032
- Figure 107: Saudi Arabia Composite Coatings Market Revenue (Million), by Technique 2024 & 2032
- Figure 108: Saudi Arabia Composite Coatings Market Volume (K Tons), by Technique 2024 & 2032
- Figure 109: Saudi Arabia Composite Coatings Market Revenue Share (%), by Technique 2024 & 2032
- Figure 110: Saudi Arabia Composite Coatings Market Volume Share (%), by Technique 2024 & 2032
- Figure 111: Saudi Arabia Composite Coatings Market Revenue (Million), by End-User Industry 2024 & 2032
- Figure 112: Saudi Arabia Composite Coatings Market Volume (K Tons), by End-User Industry 2024 & 2032
- Figure 113: Saudi Arabia Composite Coatings Market Revenue Share (%), by End-User Industry 2024 & 2032
- Figure 114: Saudi Arabia Composite Coatings Market Volume Share (%), by End-User Industry 2024 & 2032
- Figure 115: Saudi Arabia Composite Coatings Market Revenue (Million), by Country 2024 & 2032
- Figure 116: Saudi Arabia Composite Coatings Market Volume (K Tons), by Country 2024 & 2032
- Figure 117: Saudi Arabia Composite Coatings Market Revenue Share (%), by Country 2024 & 2032
- Figure 118: Saudi Arabia Composite Coatings Market Volume Share (%), by Country 2024 & 2032
List of Tables
- Table 1: Global Composite Coatings Market Revenue Million Forecast, by Region 2019 & 2032
- Table 2: Global Composite Coatings Market Volume K Tons Forecast, by Region 2019 & 2032
- Table 3: Global Composite Coatings Market Revenue Million Forecast, by Resin 2019 & 2032
- Table 4: Global Composite Coatings Market Volume K Tons Forecast, by Resin 2019 & 2032
- Table 5: Global Composite Coatings Market Revenue Million Forecast, by Technique 2019 & 2032
- Table 6: Global Composite Coatings Market Volume K Tons Forecast, by Technique 2019 & 2032
- Table 7: Global Composite Coatings Market Revenue Million Forecast, by End-User Industry 2019 & 2032
- Table 8: Global Composite Coatings Market Volume K Tons Forecast, by End-User Industry 2019 & 2032
- Table 9: Global Composite Coatings Market Revenue Million Forecast, by Region 2019 & 2032
- Table 10: Global Composite Coatings Market Volume K Tons Forecast, by Region 2019 & 2032
- Table 11: Global Composite Coatings Market Revenue Million Forecast, by Country 2019 & 2032
- Table 12: Global Composite Coatings Market Volume K Tons Forecast, by Country 2019 & 2032
- Table 13: United States Composite Coatings Market Revenue (Million) Forecast, by Application 2019 & 2032
- Table 14: United States Composite Coatings Market Volume (K Tons) Forecast, by Application 2019 & 2032
- Table 15: Canada Composite Coatings Market Revenue (Million) Forecast, by Application 2019 & 2032
- Table 16: Canada Composite Coatings Market Volume (K Tons) Forecast, by Application 2019 & 2032
- Table 17: Mexico Composite Coatings Market Revenue (Million) Forecast, by Application 2019 & 2032
- Table 18: Mexico Composite Coatings Market Volume (K Tons) Forecast, by Application 2019 & 2032
- Table 19: Global Composite Coatings Market Revenue Million Forecast, by Country 2019 & 2032
- Table 20: Global Composite Coatings Market Volume K Tons Forecast, by Country 2019 & 2032
- Table 21: Germany Composite Coatings Market Revenue (Million) Forecast, by Application 2019 & 2032
- Table 22: Germany Composite Coatings Market Volume (K Tons) Forecast, by Application 2019 & 2032
- Table 23: France Composite Coatings Market Revenue (Million) Forecast, by Application 2019 & 2032
- Table 24: France Composite Coatings Market Volume (K Tons) Forecast, by Application 2019 & 2032
- Table 25: Italy Composite Coatings Market Revenue (Million) Forecast, by Application 2019 & 2032
- Table 26: Italy Composite Coatings Market Volume (K Tons) Forecast, by Application 2019 & 2032
- Table 27: United Kingdom Composite Coatings Market Revenue (Million) Forecast, by Application 2019 & 2032
- Table 28: United Kingdom Composite Coatings Market Volume (K Tons) Forecast, by Application 2019 & 2032
- Table 29: Netherlands Composite Coatings Market Revenue (Million) Forecast, by Application 2019 & 2032
- Table 30: Netherlands Composite Coatings Market Volume (K Tons) Forecast, by Application 2019 & 2032
- Table 31: Rest of Europe Composite Coatings Market Revenue (Million) Forecast, by Application 2019 & 2032
- Table 32: Rest of Europe Composite Coatings Market Volume (K Tons) Forecast, by Application 2019 & 2032
- Table 33: Global Composite Coatings Market Revenue Million Forecast, by Country 2019 & 2032
- Table 34: Global Composite Coatings Market Volume K Tons Forecast, by Country 2019 & 2032
- Table 35: China Composite Coatings Market Revenue (Million) Forecast, by Application 2019 & 2032
- Table 36: China Composite Coatings Market Volume (K Tons) Forecast, by Application 2019 & 2032
- Table 37: Japan Composite Coatings Market Revenue (Million) Forecast, by Application 2019 & 2032
- Table 38: Japan Composite Coatings Market Volume (K Tons) Forecast, by Application 2019 & 2032
- Table 39: India Composite Coatings Market Revenue (Million) Forecast, by Application 2019 & 2032
- Table 40: India Composite Coatings Market Volume (K Tons) Forecast, by Application 2019 & 2032
- Table 41: South Korea Composite Coatings Market Revenue (Million) Forecast, by Application 2019 & 2032
- Table 42: South Korea Composite Coatings Market Volume (K Tons) Forecast, by Application 2019 & 2032
- Table 43: Taiwan Composite Coatings Market Revenue (Million) Forecast, by Application 2019 & 2032
- Table 44: Taiwan Composite Coatings Market Volume (K Tons) Forecast, by Application 2019 & 2032
- Table 45: Australia Composite Coatings Market Revenue (Million) Forecast, by Application 2019 & 2032
- Table 46: Australia Composite Coatings Market Volume (K Tons) Forecast, by Application 2019 & 2032
- Table 47: Rest of Asia-Pacific Composite Coatings Market Revenue (Million) Forecast, by Application 2019 & 2032
- Table 48: Rest of Asia-Pacific Composite Coatings Market Volume (K Tons) Forecast, by Application 2019 & 2032
- Table 49: Global Composite Coatings Market Revenue Million Forecast, by Country 2019 & 2032
- Table 50: Global Composite Coatings Market Volume K Tons Forecast, by Country 2019 & 2032
- Table 51: Brazil Composite Coatings Market Revenue (Million) Forecast, by Application 2019 & 2032
- Table 52: Brazil Composite Coatings Market Volume (K Tons) Forecast, by Application 2019 & 2032
- Table 53: Argentina Composite Coatings Market Revenue (Million) Forecast, by Application 2019 & 2032
- Table 54: Argentina Composite Coatings Market Volume (K Tons) Forecast, by Application 2019 & 2032
- Table 55: Rest of South America Composite Coatings Market Revenue (Million) Forecast, by Application 2019 & 2032
- Table 56: Rest of South America Composite Coatings Market Volume (K Tons) Forecast, by Application 2019 & 2032
- Table 57: Global Composite Coatings Market Revenue Million Forecast, by Country 2019 & 2032
- Table 58: Global Composite Coatings Market Volume K Tons Forecast, by Country 2019 & 2032
- Table 59: Middle East Composite Coatings Market Revenue (Million) Forecast, by Application 2019 & 2032
- Table 60: Middle East Composite Coatings Market Volume (K Tons) Forecast, by Application 2019 & 2032
- Table 61: Africa Composite Coatings Market Revenue (Million) Forecast, by Application 2019 & 2032
- Table 62: Africa Composite Coatings Market Volume (K Tons) Forecast, by Application 2019 & 2032
- Table 63: Global Composite Coatings Market Revenue Million Forecast, by Resin 2019 & 2032
- Table 64: Global Composite Coatings Market Volume K Tons Forecast, by Resin 2019 & 2032
- Table 65: Global Composite Coatings Market Revenue Million Forecast, by Technique 2019 & 2032
- Table 66: Global Composite Coatings Market Volume K Tons Forecast, by Technique 2019 & 2032
- Table 67: Global Composite Coatings Market Revenue Million Forecast, by End-User Industry 2019 & 2032
- Table 68: Global Composite Coatings Market Volume K Tons Forecast, by End-User Industry 2019 & 2032
- Table 69: Global Composite Coatings Market Revenue Million Forecast, by Country 2019 & 2032
- Table 70: Global Composite Coatings Market Volume K Tons Forecast, by Country 2019 & 2032
- Table 71: China Composite Coatings Market Revenue (Million) Forecast, by Application 2019 & 2032
- Table 72: China Composite Coatings Market Volume (K Tons) Forecast, by Application 2019 & 2032
- Table 73: India Composite Coatings Market Revenue (Million) Forecast, by Application 2019 & 2032
- Table 74: India Composite Coatings Market Volume (K Tons) Forecast, by Application 2019 & 2032
- Table 75: Japan Composite Coatings Market Revenue (Million) Forecast, by Application 2019 & 2032
- Table 76: Japan Composite Coatings Market Volume (K Tons) Forecast, by Application 2019 & 2032
- Table 77: South Korea Composite Coatings Market Revenue (Million) Forecast, by Application 2019 & 2032
- Table 78: South Korea Composite Coatings Market Volume (K Tons) Forecast, by Application 2019 & 2032
- Table 79: Rest of Asia Pacific Composite Coatings Market Revenue (Million) Forecast, by Application 2019 & 2032
- Table 80: Rest of Asia Pacific Composite Coatings Market Volume (K Tons) Forecast, by Application 2019 & 2032
- Table 81: Global Composite Coatings Market Revenue Million Forecast, by Resin 2019 & 2032
- Table 82: Global Composite Coatings Market Volume K Tons Forecast, by Resin 2019 & 2032
- Table 83: Global Composite Coatings Market Revenue Million Forecast, by Technique 2019 & 2032
- Table 84: Global Composite Coatings Market Volume K Tons Forecast, by Technique 2019 & 2032
- Table 85: Global Composite Coatings Market Revenue Million Forecast, by End-User Industry 2019 & 2032
- Table 86: Global Composite Coatings Market Volume K Tons Forecast, by End-User Industry 2019 & 2032
- Table 87: Global Composite Coatings Market Revenue Million Forecast, by Country 2019 & 2032
- Table 88: Global Composite Coatings Market Volume K Tons Forecast, by Country 2019 & 2032
- Table 89: United States Composite Coatings Market Revenue (Million) Forecast, by Application 2019 & 2032
- Table 90: United States Composite Coatings Market Volume (K Tons) Forecast, by Application 2019 & 2032
- Table 91: Canada Composite Coatings Market Revenue (Million) Forecast, by Application 2019 & 2032
- Table 92: Canada Composite Coatings Market Volume (K Tons) Forecast, by Application 2019 & 2032
- Table 93: Mexico Composite Coatings Market Revenue (Million) Forecast, by Application 2019 & 2032
- Table 94: Mexico Composite Coatings Market Volume (K Tons) Forecast, by Application 2019 & 2032
- Table 95: Global Composite Coatings Market Revenue Million Forecast, by Resin 2019 & 2032
- Table 96: Global Composite Coatings Market Volume K Tons Forecast, by Resin 2019 & 2032
- Table 97: Global Composite Coatings Market Revenue Million Forecast, by Technique 2019 & 2032
- Table 98: Global Composite Coatings Market Volume K Tons Forecast, by Technique 2019 & 2032
- Table 99: Global Composite Coatings Market Revenue Million Forecast, by End-User Industry 2019 & 2032
- Table 100: Global Composite Coatings Market Volume K Tons Forecast, by End-User Industry 2019 & 2032
- Table 101: Global Composite Coatings Market Revenue Million Forecast, by Country 2019 & 2032
- Table 102: Global Composite Coatings Market Volume K Tons Forecast, by Country 2019 & 2032
- Table 103: Germany Composite Coatings Market Revenue (Million) Forecast, by Application 2019 & 2032
- Table 104: Germany Composite Coatings Market Volume (K Tons) Forecast, by Application 2019 & 2032
- Table 105: United Kingdom Composite Coatings Market Revenue (Million) Forecast, by Application 2019 & 2032
- Table 106: United Kingdom Composite Coatings Market Volume (K Tons) Forecast, by Application 2019 & 2032
- Table 107: Italy Composite Coatings Market Revenue (Million) Forecast, by Application 2019 & 2032
- Table 108: Italy Composite Coatings Market Volume (K Tons) Forecast, by Application 2019 & 2032
- Table 109: France Composite Coatings Market Revenue (Million) Forecast, by Application 2019 & 2032
- Table 110: France Composite Coatings Market Volume (K Tons) Forecast, by Application 2019 & 2032
- Table 111: Rest of Europe Composite Coatings Market Revenue (Million) Forecast, by Application 2019 & 2032
- Table 112: Rest of Europe Composite Coatings Market Volume (K Tons) Forecast, by Application 2019 & 2032
- Table 113: Global Composite Coatings Market Revenue Million Forecast, by Resin 2019 & 2032
- Table 114: Global Composite Coatings Market Volume K Tons Forecast, by Resin 2019 & 2032
- Table 115: Global Composite Coatings Market Revenue Million Forecast, by Technique 2019 & 2032
- Table 116: Global Composite Coatings Market Volume K Tons Forecast, by Technique 2019 & 2032
- Table 117: Global Composite Coatings Market Revenue Million Forecast, by End-User Industry 2019 & 2032
- Table 118: Global Composite Coatings Market Volume K Tons Forecast, by End-User Industry 2019 & 2032
- Table 119: Global Composite Coatings Market Revenue Million Forecast, by Country 2019 & 2032
- Table 120: Global Composite Coatings Market Volume K Tons Forecast, by Country 2019 & 2032
- Table 121: Brazil Composite Coatings Market Revenue (Million) Forecast, by Application 2019 & 2032
- Table 122: Brazil Composite Coatings Market Volume (K Tons) Forecast, by Application 2019 & 2032
- Table 123: Argentina Composite Coatings Market Revenue (Million) Forecast, by Application 2019 & 2032
- Table 124: Argentina Composite Coatings Market Volume (K Tons) Forecast, by Application 2019 & 2032
- Table 125: Rest of South America Composite Coatings Market Revenue (Million) Forecast, by Application 2019 & 2032
- Table 126: Rest of South America Composite Coatings Market Volume (K Tons) Forecast, by Application 2019 & 2032
- Table 127: Global Composite Coatings Market Revenue Million Forecast, by Resin 2019 & 2032
- Table 128: Global Composite Coatings Market Volume K Tons Forecast, by Resin 2019 & 2032
- Table 129: Global Composite Coatings Market Revenue Million Forecast, by Technique 2019 & 2032
- Table 130: Global Composite Coatings Market Volume K Tons Forecast, by Technique 2019 & 2032
- Table 131: Global Composite Coatings Market Revenue Million Forecast, by End-User Industry 2019 & 2032
- Table 132: Global Composite Coatings Market Volume K Tons Forecast, by End-User Industry 2019 & 2032
- Table 133: Global Composite Coatings Market Revenue Million Forecast, by Country 2019 & 2032
- Table 134: Global Composite Coatings Market Volume K Tons Forecast, by Country 2019 & 2032
- Table 135: Global Composite Coatings Market Revenue Million Forecast, by Resin 2019 & 2032
- Table 136: Global Composite Coatings Market Volume K Tons Forecast, by Resin 2019 & 2032
- Table 137: Global Composite Coatings Market Revenue Million Forecast, by Technique 2019 & 2032
- Table 138: Global Composite Coatings Market Volume K Tons Forecast, by Technique 2019 & 2032
- Table 139: Global Composite Coatings Market Revenue Million Forecast, by End-User Industry 2019 & 2032
- Table 140: Global Composite Coatings Market Volume K Tons Forecast, by End-User Industry 2019 & 2032
- Table 141: Global Composite Coatings Market Revenue Million Forecast, by Country 2019 & 2032
- Table 142: Global Composite Coatings Market Volume K Tons Forecast, by Country 2019 & 2032
- Table 143: South Africa Composite Coatings Market Revenue (Million) Forecast, by Application 2019 & 2032
- Table 144: South Africa Composite Coatings Market Volume (K Tons) Forecast, by Application 2019 & 2032
- Table 145: Rest of Middle East Composite Coatings Market Revenue (Million) Forecast, by Application 2019 & 2032
- Table 146: Rest of Middle East Composite Coatings Market Volume (K Tons) Forecast, by Application 2019 & 2032
Frequently Asked Questions
1. What is the projected Compound Annual Growth Rate (CAGR) of the Composite Coatings Market?
The projected CAGR is approximately 7.9%.
2. Which companies are prominent players in the Composite Coatings Market?
Key companies in the market include Mäder, The Sherwin-Williams Company, RPM International Inc, PPG Industries Inc, Benjamin Moore & Co, AkzoNobel NV, FUSION MINERAL PAINT, KEIM Mineral Coatings of America Inc, K C Jones Plating Company, BEECK Mineral Paints.
3. What are the main segments of the Composite Coatings Market?
The market segments include Resin, Technique, End-User Industry.
4. Can you provide details about the market size?
The market size is estimated to be USD 1463.4 Million as of 2022.
5. What are some drivers contributing to market growth?
; Growth in Oil & Gas Exploration Activities; Others.
6. What are the notable trends driving market growth?
Increasing Demand for Oil and Gas.
7. Are there any restraints impacting market growth?
; High Processing Cost.
8. Can you provide examples of recent developments in the market?
N/A
9. What pricing options are available for accessing the report?
Pricing options include single-user, multi-user, and enterprise licenses priced at USD 3,950, USD 4,950, and USD 6,950 respectively.
10. Is the market size provided in terms of value or volume?
The market size is provided in terms of value, measured in Million and volume, measured in K Tons.
11. Are there any specific market keywords associated with the report?
Yes, the market keyword associated with the report is "Composite Coatings Market," which aids in identifying and referencing the specific market segment covered.
12. How do I determine which pricing option suits my needs best?
The pricing options vary based on user requirements and access needs. Individual users may opt for single-user licenses, while businesses requiring broader access may choose multi-user or enterprise licenses for cost-effective access to the report.
13. Are there any additional resources or data provided in the Composite Coatings Market report?
While the report offers comprehensive insights, it's advisable to review the specific contents or supplementary materials provided to ascertain if additional resources or data are available.
14. How can I stay updated on further developments or reports in the Composite Coatings Market?
To stay informed about further developments, trends, and reports in the Composite Coatings Market, consider subscribing to industry newsletters, following relevant companies and organizations, or regularly checking reputable industry news sources and publications.
Methodology
Step 1 - Identification of Relevant Samples Size from Population Database


Step 2 - Approaches for Defining Global Market Size (Value, Volume* & Price*)

Note*: In applicable scenarios
Step 3 - Data Sources
Primary Research
- Web Analytics
- Survey Reports
- Research Institute
- Latest Research Reports
- Opinion Leaders
Secondary Research
- Annual Reports
- White Paper
- Latest Press Release
- Industry Association
- Paid Database
- Investor Presentations

Step 4 - Data Triangulation
Involves using different sources of information in order to increase the validity of a study
These sources are likely to be stakeholders in a program - participants, other researchers, program staff, other community members, and so on.
Then we put all data in single framework & apply various statistical tools to find out the dynamic on the market.
During the analysis stage, feedback from the stakeholder groups would be compared to determine areas of agreement as well as areas of divergence


