


Key Insights
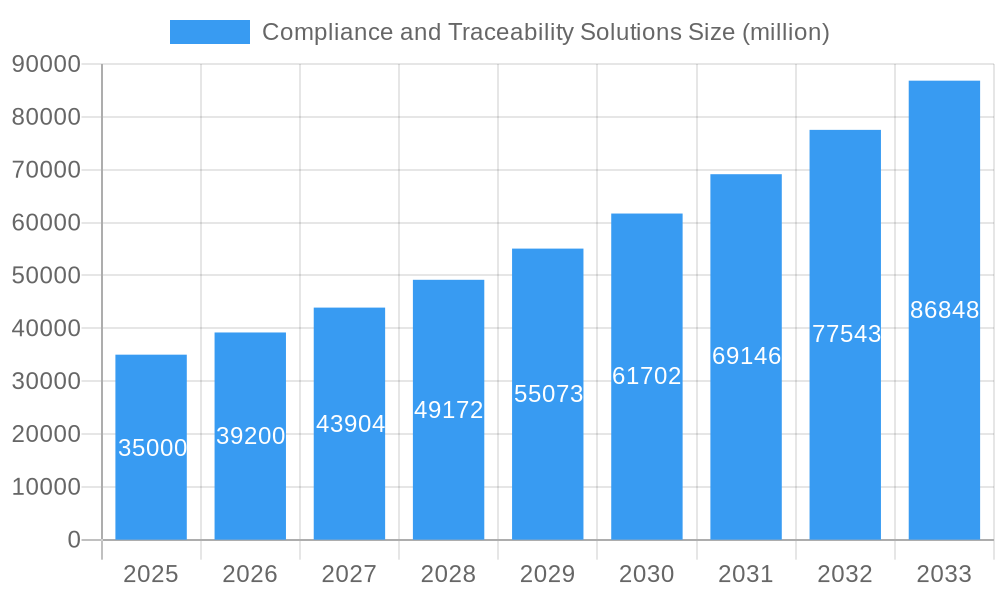
The global market for Compliance and Traceability Solutions is poised for significant expansion, projected to reach an estimated USD 35,000 million by 2025, with a robust Compound Annual Growth Rate (CAGR) of 12% through 2033. This upward trajectory is primarily fueled by the increasing regulatory scrutiny across diverse industries, demanding stringent adherence to quality standards, supply chain transparency, and product safety. The IT and Telecom sector, alongside Manufacturing and Energy & Utility, are leading the adoption of these solutions, driven by the need to manage complex data flows, prevent counterfeiting, and ensure operational integrity. The growing emphasis on sustainability and ethical sourcing further propwinds the market, as businesses leverage traceability solutions to demonstrate compliance with environmental and social governance (ESG) standards. On-premise solutions remain a strong contender, particularly for organizations with sensitive data and strict control requirements, while cloud-based offerings are rapidly gaining traction due to their scalability, cost-effectiveness, and accessibility.

Compliance and Traceability Solutions Market Size (In Billion)

The market landscape is characterized by a dynamic competitive environment, with key players like SAP, Oracle, Infosys, and Dassault Systèmes investing heavily in research and development to offer integrated and advanced compliance and traceability platforms. Emerging trends include the integration of blockchain technology for enhanced data immutability and transparency, the application of AI and machine learning for predictive compliance and risk management, and the development of IoT-enabled solutions for real-time tracking and monitoring of products throughout their lifecycle. However, the market faces certain restraints, including the high implementation costs associated with sophisticated solutions, the need for skilled personnel to manage and operate these systems, and potential data security concerns associated with cloud deployments. Despite these challenges, the increasing awareness of the benefits derived from robust compliance and traceability, such as improved brand reputation, reduced operational risks, and enhanced customer trust, will continue to drive market growth and innovation in the coming years.
Compliance and Traceability Solutions Company Market Share
This in-depth market research report provides a strategic outlook and detailed analysis of the global Compliance and Traceability Solutions market from 2019 to 2033. Covering the historical period (2019-2024), base year (2025), estimated year (2025), and forecast period (2025-2033), this report offers invaluable insights into market dynamics, growth drivers, challenges, and competitive strategies. Uncover the opportunities and threats within this critical sector, essential for stakeholders seeking to leverage supply chain traceability, regulatory compliance software, product lifecycle management, quality management systems, and data integrity solutions. Our analysis includes a comprehensive breakdown by On Premise and Cloud deployment types and key industry Segments including IT and Telecom, Energy and Utility, Manufacturing, BFSI, and Others. Gain a competitive edge with actionable intelligence on leading vendors such as SAP, Apriso, Oracle, Infosys, Tuleap, TrusTrace, Tata Consultancy Services, OPTEL GROUP, Omron Automation, Agrilyze, Dassault Systèmes, 4CRisk, and Mettler Toledo.
Compliance and Traceability Solutions Market Structure & Competitive Dynamics
The global Compliance and Traceability Solutions market exhibits a moderate to high concentration, with key players like SAP, Oracle, and Dassault Systèmes holding significant market share, estimated to be over 15% each for the top three. The innovation ecosystem is robust, driven by advancements in AI, IoT, and blockchain technologies, enabling enhanced real-time tracking, anti-counterfeiting measures, and consumer trust building. Regulatory frameworks, such as GDPR, FDA regulations, and industry-specific mandates, are pivotal in shaping market demand for auditable data, secure record-keeping, and risk management solutions. Product substitutes, including manual tracking methods and less sophisticated software, are gradually being phased out as businesses prioritize comprehensive traceability platforms and compliance automation. End-user trends indicate a strong preference for integrated solutions that offer end-to-end visibility and streamlined process control. Mergers and acquisitions (M&A) activity is a significant dynamic, with an estimated USD 500 million in M&A deal values recorded in the past two years, aimed at expanding product portfolios and market reach. Companies like Infosys and Tata Consultancy Services are actively involved in strategic acquisitions to bolster their offerings in the digital transformation space.
Compliance and Traceability Solutions Industry Trends & Insights
The Compliance and Traceability Solutions industry is experiencing a robust growth trajectory, projected to achieve a Compound Annual Growth Rate (CAGR) of approximately 12.5% during the forecast period. This expansion is fueled by an increasing awareness of the importance of product authenticity, consumer safety, and regulatory adherence across all industries. Technological disruptions, particularly the integration of the Internet of Things (IoT) for real-time data collection and blockchain for secure, immutable record-keeping, are revolutionizing how companies achieve supply chain transparency. Consumer preferences are increasingly skewed towards brands that demonstrate a commitment to ethical sourcing and product integrity, thereby driving demand for granular traceability information. For instance, the food and beverage sector, a significant market segment, is seeing a surge in demand for farm-to-fork traceability solutions. Competitive dynamics are characterized by intense innovation, with companies like TrusTrace and Agrilyze carving out niches in specific verticals. Market penetration of advanced compliance management systems is steadily increasing, with an estimated 60% of large enterprises adopting at least one form of digital traceability solution by 2025. Furthermore, the push for sustainable practices and the need to track the carbon footprint of products are emerging as critical growth accelerators, pushing the market towards more sophisticated environmental, social, and governance (ESG) reporting tools. The integration of Artificial Intelligence (AI) and Machine Learning (ML) is further enhancing predictive analytics for risk mitigation and quality control, making these solutions indispensable for modern business operations. The rise of digital product passports and enhanced serialization and track-and-trace capabilities are also key trends shaping the market landscape.
Dominant Markets & Segments in Compliance and Traceability Solutions
The Manufacturing segment is currently the dominant market for Compliance and Traceability Solutions, driven by stringent quality control regulations, complex global supply chains, and the need for operational efficiency. Key drivers within this segment include government mandates for product safety (e.g., automotive recalls, pharmaceutical regulations), the pursuit of lean manufacturing principles, and the imperative to reduce product defects and waste, estimated to be reducing operational costs by up to 18% for leading adopters. The IT and Telecom sector is also a rapidly growing segment, owing to the increasing demand for data privacy compliance, software integrity, and cybersecurity traceability. Economic policies supporting digital transformation and infrastructure development further bolster this segment. The Energy and Utility sector relies heavily on these solutions for asset tracking, safety compliance, and regulatory adherence related to environmental impact. The BFSI segment mandates robust financial compliance, anti-money laundering (AML), and Know Your Customer (KYC) tracking.
- Manufacturing: Dominance is fueled by the need for end-to-end supply chain visibility, serialization and track-and-trace, and adherence to quality standards like ISO 9001. Economic policies promoting reshoring and advanced manufacturing techniques contribute to growth. Infrastructure development for smart factories and Industry 4.0 initiatives are also key enablers.
- IT and Telecom: Growth is driven by data security regulations, the need for software version control, and auditable IT operations. Government incentives for digital infrastructure and cloud adoption play a significant role.
- Energy and Utility: Demand is propelled by safety regulations, environmental compliance, and the need for asset lifecycle management. Investment in smart grids and renewable energy projects are critical economic drivers.
- BFSI: Stringent regulatory requirements like Basel III, GDPR, and PCI DSS necessitate comprehensive financial traceability and risk management. Economic stability and digital banking initiatives are key factors.
- Cloud Deployment: The Cloud deployment type is rapidly gaining traction, offering scalability, cost-effectiveness, and accessibility, with an estimated market share exceeding 65% of new deployments by 2027. This is supported by widespread internet penetration and investments in cloud infrastructure.
- On Premise: While traditionally dominant, On Premise solutions are now primarily adopted by organizations with highly sensitive data or unique customization needs, particularly in government and defense sectors.
Compliance and Traceability Solutions Product Innovations
Recent product innovations in Compliance and Traceability Solutions are heavily focused on leveraging advanced technologies like blockchain for enhanced supply chain transparency and immutable records, and AI/ML for predictive analytics in quality control and risk assessment. Companies are developing integrated platforms that offer end-to-end product lifecycle tracking, from raw material sourcing to final disposal. Innovations also include sophisticated serialization and track-and-trace capabilities, robust document management systems for regulatory submissions, and intuitive user interfaces for easier adoption and data management. These advancements provide significant competitive advantages by improving operational efficiency, ensuring regulatory compliance, and building stronger consumer trust through verifiable product provenance. The market is also seeing advancements in digital product passports and solutions for tracking Ethical Sourcing and Sustainability Metrics.
Report Segmentation & Scope
This report segments the global Compliance and Traceability Solutions market by Application, including IT and Telecom, Energy and Utility, Manufacturing, BFSI, and Others. For the Manufacturing segment, growth is projected at 13.2% CAGR, with an estimated market size of USD 3,500 million by 2030, driven by stringent quality and safety regulations. The IT and Telecom segment is expected to grow at 11.5% CAGR, valued at USD 1,800 million by 2030, with increasing focus on data privacy and cybersecurity. The Energy and Utility sector is projected at 10.8% CAGR, reaching USD 1,200 million, driven by safety and environmental compliance needs. The BFSI segment is estimated at 9.5% CAGR, with a market value of USD 950 million, propelled by financial and regulatory compliance. The market is also segmented by Types: On Premise and Cloud. The Cloud segment is forecast to grow significantly at 14.1% CAGR, expected to capture over 65% of the market by 2030, due to its scalability and cost-effectiveness. The On Premise segment is projected to grow at 7.8% CAGR.
Key Drivers of Compliance and Traceability Solutions Growth
The growth of the Compliance and Traceability Solutions market is primarily driven by several key factors. Firstly, the increasingly stringent global regulatory landscape, including mandates for data integrity, product safety, and environmental compliance, forces businesses to adopt robust traceability systems. Secondly, the rise of complex global supply chains necessitates enhanced visibility and control to mitigate risks such as counterfeiting and product recalls. Technological advancements, particularly the integration of IoT, AI/ML, and blockchain, offer sophisticated solutions for real-time tracking, data verification, and end-to-end visibility. Furthermore, growing consumer demand for product transparency, ethical sourcing, and health & safety assurance plays a crucial role. Finally, the pursuit of operational efficiency, cost reduction through waste minimization, and improved quality control are significant internal drivers for adoption. For instance, the pharmaceutical industry's need for drug traceability to prevent counterfeit medicines is a major market catalyst, estimated to prevent losses of USD 200 million annually in major markets.
Challenges in the Compliance and Traceability Solutions Sector
Despite the strong growth prospects, the Compliance and Traceability Solutions sector faces several challenges. Implementing and integrating these solutions can be complex and costly, particularly for small and medium-sized enterprises (SMEs), leading to significant upfront investment. Interoperability issues between different systems and the need for standardization across diverse supply chains remain a hurdle. Cybersecurity threats and the risk of data breaches necessitate robust security measures, adding to the implementation complexity and cost. Resistance to change within organizations and the need for extensive employee training can also impede adoption. Furthermore, the evolving nature of regulations requires continuous updates and adaptation of the solutions, presenting an ongoing challenge for both vendors and users. Supply chain disruption, as seen in recent global events, can also impact the reliability and implementation of traceability systems, with an estimated 5% increase in implementation delays during such periods.
Leading Players in the Compliance and Traceability Solutions Market
- SAP
- Apriso
- Oracle
- Infosys
- Tuleap
- TrusTrace
- Tata Consultancy Services
- OPTEL GROUP
- Omron Automation
- Agrilyze
- Dassault Systèmes
- 4CRisk
- Mettler Toledo
Key Developments in Compliance and Traceability Solutions Sector
- 2023/Q4: SAP launched enhanced modules for its S/4HANA system, focusing on advanced supply chain traceability and compliance automation.
- 2024/Q1: Oracle announced a strategic partnership with a leading logistics provider to integrate its cloud-based traceability solutions with real-time shipment tracking, improving visibility by an estimated 25%.
- 2024/Q2: TrusTrace secured USD 50 million in Series B funding to expand its platform for sustainable and traceable supply chains in the fashion industry.
- 2024/Q3: Dassault Systèmes acquired a specialized AI firm to bolster its product lifecycle management (PLM) capabilities with advanced analytics for quality assurance and traceability.
- 2024/Q4: Tata Consultancy Services unveiled a new blockchain-based solution for enhanced pharmaceutical traceability and anti-counterfeiting.
- 2025/Q1: Mettler Toledo introduced next-generation inline inspection systems for food and beverage manufacturers, enhancing product safety and traceability with improved accuracy.
- 2025/Q2: Agrilyze expanded its agricultural traceability platform to include ESG data tracking, meeting growing demands for sustainable food production.
Strategic Compliance and Traceability Solutions Market Outlook
The strategic outlook for the Compliance and Traceability Solutions market is highly positive, driven by ongoing digital transformation initiatives and an intensifying regulatory environment. Key growth accelerators include the expanding adoption of IoT devices for real-time data capture, the increasing integration of blockchain technology for secure and transparent transactions, and the growing demand for predictive analytics to proactively identify and mitigate risks. The continued emphasis on supply chain resilience, food safety, drug authenticity, and ethical sourcing will further propel market expansion. Strategic opportunities lie in developing integrated, end-to-end traceability platforms that offer seamless data flow across the entire value chain. Partnerships and collaborations between technology providers, industry associations, and regulatory bodies will be crucial for driving standardization and fostering wider adoption. The market is poised for continued innovation, with a strong focus on delivering actionable insights and tangible business value through enhanced compliance management and product integrity.
Compliance and Traceability Solutions Segmentation
-
1. Application
- 1.1. IT and Telecom
- 1.2. Energy and Utility
- 1.3. Manufacturing
- 1.4. BFSI
- 1.5. Others
-
2. Types
- 2.1. On Premise
- 2.2. Cloud
Compliance and Traceability Solutions Segmentation By Geography
-
1. North America
- 1.1. United States
- 1.2. Canada
- 1.3. Mexico
-
2. South America
- 2.1. Brazil
- 2.2. Argentina
- 2.3. Rest of South America
-
3. Europe
- 3.1. United Kingdom
- 3.2. Germany
- 3.3. France
- 3.4. Italy
- 3.5. Spain
- 3.6. Russia
- 3.7. Benelux
- 3.8. Nordics
- 3.9. Rest of Europe
-
4. Middle East & Africa
- 4.1. Turkey
- 4.2. Israel
- 4.3. GCC
- 4.4. North Africa
- 4.5. South Africa
- 4.6. Rest of Middle East & Africa
-
5. Asia Pacific
- 5.1. China
- 5.2. India
- 5.3. Japan
- 5.4. South Korea
- 5.5. ASEAN
- 5.6. Oceania
- 5.7. Rest of Asia Pacific

Compliance and Traceability Solutions Regional Market Share
Geographic Coverage of Compliance and Traceability Solutions
Compliance and Traceability Solutions REPORT HIGHLIGHTS
| Aspects | Details |
|---|---|
| Study Period | 2020-2034 |
| Base Year | 2025 |
| Estimated Year | 2026 |
| Forecast Period | 2026-2034 |
| Historical Period | 2020-2025 |
| Growth Rate | CAGR of 10.13% from 2020-2034 |
| Segmentation |
|
Table of Contents
- 1. Introduction
- 1.1. Research Scope
- 1.2. Market Segmentation
- 1.3. Research Methodology
- 1.4. Definitions and Assumptions
- 2. Executive Summary
- 2.1. Introduction
- 3. Market Dynamics
- 3.1. Introduction
- 3.2. Market Drivers
- 3.3. Market Restrains
- 3.4. Market Trends
- 4. Market Factor Analysis
- 4.1. Porters Five Forces
- 4.2. Supply/Value Chain
- 4.3. PESTEL analysis
- 4.4. Market Entropy
- 4.5. Patent/Trademark Analysis
- 5. Global Compliance and Traceability Solutions Analysis, Insights and Forecast, 2020-2032
- 5.1. Market Analysis, Insights and Forecast - by Application
- 5.1.1. IT and Telecom
- 5.1.2. Energy and Utility
- 5.1.3. Manufacturing
- 5.1.4. BFSI
- 5.1.5. Others
- 5.2. Market Analysis, Insights and Forecast - by Types
- 5.2.1. On Premise
- 5.2.2. Cloud
- 5.3. Market Analysis, Insights and Forecast - by Region
- 5.3.1. North America
- 5.3.2. South America
- 5.3.3. Europe
- 5.3.4. Middle East & Africa
- 5.3.5. Asia Pacific
- 5.1. Market Analysis, Insights and Forecast - by Application
- 6. North America Compliance and Traceability Solutions Analysis, Insights and Forecast, 2020-2032
- 6.1. Market Analysis, Insights and Forecast - by Application
- 6.1.1. IT and Telecom
- 6.1.2. Energy and Utility
- 6.1.3. Manufacturing
- 6.1.4. BFSI
- 6.1.5. Others
- 6.2. Market Analysis, Insights and Forecast - by Types
- 6.2.1. On Premise
- 6.2.2. Cloud
- 6.1. Market Analysis, Insights and Forecast - by Application
- 7. South America Compliance and Traceability Solutions Analysis, Insights and Forecast, 2020-2032
- 7.1. Market Analysis, Insights and Forecast - by Application
- 7.1.1. IT and Telecom
- 7.1.2. Energy and Utility
- 7.1.3. Manufacturing
- 7.1.4. BFSI
- 7.1.5. Others
- 7.2. Market Analysis, Insights and Forecast - by Types
- 7.2.1. On Premise
- 7.2.2. Cloud
- 7.1. Market Analysis, Insights and Forecast - by Application
- 8. Europe Compliance and Traceability Solutions Analysis, Insights and Forecast, 2020-2032
- 8.1. Market Analysis, Insights and Forecast - by Application
- 8.1.1. IT and Telecom
- 8.1.2. Energy and Utility
- 8.1.3. Manufacturing
- 8.1.4. BFSI
- 8.1.5. Others
- 8.2. Market Analysis, Insights and Forecast - by Types
- 8.2.1. On Premise
- 8.2.2. Cloud
- 8.1. Market Analysis, Insights and Forecast - by Application
- 9. Middle East & Africa Compliance and Traceability Solutions Analysis, Insights and Forecast, 2020-2032
- 9.1. Market Analysis, Insights and Forecast - by Application
- 9.1.1. IT and Telecom
- 9.1.2. Energy and Utility
- 9.1.3. Manufacturing
- 9.1.4. BFSI
- 9.1.5. Others
- 9.2. Market Analysis, Insights and Forecast - by Types
- 9.2.1. On Premise
- 9.2.2. Cloud
- 9.1. Market Analysis, Insights and Forecast - by Application
- 10. Asia Pacific Compliance and Traceability Solutions Analysis, Insights and Forecast, 2020-2032
- 10.1. Market Analysis, Insights and Forecast - by Application
- 10.1.1. IT and Telecom
- 10.1.2. Energy and Utility
- 10.1.3. Manufacturing
- 10.1.4. BFSI
- 10.1.5. Others
- 10.2. Market Analysis, Insights and Forecast - by Types
- 10.2.1. On Premise
- 10.2.2. Cloud
- 10.1. Market Analysis, Insights and Forecast - by Application
- 11. Competitive Analysis
- 11.1. Global Market Share Analysis 2025
- 11.2. Company Profiles
- 11.2.1 SAP
- 11.2.1.1. Overview
- 11.2.1.2. Products
- 11.2.1.3. SWOT Analysis
- 11.2.1.4. Recent Developments
- 11.2.1.5. Financials (Based on Availability)
- 11.2.2 Apriso
- 11.2.2.1. Overview
- 11.2.2.2. Products
- 11.2.2.3. SWOT Analysis
- 11.2.2.4. Recent Developments
- 11.2.2.5. Financials (Based on Availability)
- 11.2.3 Oracle
- 11.2.3.1. Overview
- 11.2.3.2. Products
- 11.2.3.3. SWOT Analysis
- 11.2.3.4. Recent Developments
- 11.2.3.5. Financials (Based on Availability)
- 11.2.4 Infosys
- 11.2.4.1. Overview
- 11.2.4.2. Products
- 11.2.4.3. SWOT Analysis
- 11.2.4.4. Recent Developments
- 11.2.4.5. Financials (Based on Availability)
- 11.2.5 Tuleap
- 11.2.5.1. Overview
- 11.2.5.2. Products
- 11.2.5.3. SWOT Analysis
- 11.2.5.4. Recent Developments
- 11.2.5.5. Financials (Based on Availability)
- 11.2.6 TrusTrace
- 11.2.6.1. Overview
- 11.2.6.2. Products
- 11.2.6.3. SWOT Analysis
- 11.2.6.4. Recent Developments
- 11.2.6.5. Financials (Based on Availability)
- 11.2.7 Tata Consultancy Services
- 11.2.7.1. Overview
- 11.2.7.2. Products
- 11.2.7.3. SWOT Analysis
- 11.2.7.4. Recent Developments
- 11.2.7.5. Financials (Based on Availability)
- 11.2.8 OPTEL GROUP
- 11.2.8.1. Overview
- 11.2.8.2. Products
- 11.2.8.3. SWOT Analysis
- 11.2.8.4. Recent Developments
- 11.2.8.5. Financials (Based on Availability)
- 11.2.9 Omron Automation
- 11.2.9.1. Overview
- 11.2.9.2. Products
- 11.2.9.3. SWOT Analysis
- 11.2.9.4. Recent Developments
- 11.2.9.5. Financials (Based on Availability)
- 11.2.10 Agrilyze
- 11.2.10.1. Overview
- 11.2.10.2. Products
- 11.2.10.3. SWOT Analysis
- 11.2.10.4. Recent Developments
- 11.2.10.5. Financials (Based on Availability)
- 11.2.11 Dassault Systèmes
- 11.2.11.1. Overview
- 11.2.11.2. Products
- 11.2.11.3. SWOT Analysis
- 11.2.11.4. Recent Developments
- 11.2.11.5. Financials (Based on Availability)
- 11.2.12 4CRisk
- 11.2.12.1. Overview
- 11.2.12.2. Products
- 11.2.12.3. SWOT Analysis
- 11.2.12.4. Recent Developments
- 11.2.12.5. Financials (Based on Availability)
- 11.2.13 Mettler Toledo
- 11.2.13.1. Overview
- 11.2.13.2. Products
- 11.2.13.3. SWOT Analysis
- 11.2.13.4. Recent Developments
- 11.2.13.5. Financials (Based on Availability)
- 11.2.1 SAP
List of Figures
- Figure 1: Global Compliance and Traceability Solutions Revenue Breakdown (undefined, %) by Region 2025 & 2033
- Figure 2: North America Compliance and Traceability Solutions Revenue (undefined), by Application 2025 & 2033
- Figure 3: North America Compliance and Traceability Solutions Revenue Share (%), by Application 2025 & 2033
- Figure 4: North America Compliance and Traceability Solutions Revenue (undefined), by Types 2025 & 2033
- Figure 5: North America Compliance and Traceability Solutions Revenue Share (%), by Types 2025 & 2033
- Figure 6: North America Compliance and Traceability Solutions Revenue (undefined), by Country 2025 & 2033
- Figure 7: North America Compliance and Traceability Solutions Revenue Share (%), by Country 2025 & 2033
- Figure 8: South America Compliance and Traceability Solutions Revenue (undefined), by Application 2025 & 2033
- Figure 9: South America Compliance and Traceability Solutions Revenue Share (%), by Application 2025 & 2033
- Figure 10: South America Compliance and Traceability Solutions Revenue (undefined), by Types 2025 & 2033
- Figure 11: South America Compliance and Traceability Solutions Revenue Share (%), by Types 2025 & 2033
- Figure 12: South America Compliance and Traceability Solutions Revenue (undefined), by Country 2025 & 2033
- Figure 13: South America Compliance and Traceability Solutions Revenue Share (%), by Country 2025 & 2033
- Figure 14: Europe Compliance and Traceability Solutions Revenue (undefined), by Application 2025 & 2033
- Figure 15: Europe Compliance and Traceability Solutions Revenue Share (%), by Application 2025 & 2033
- Figure 16: Europe Compliance and Traceability Solutions Revenue (undefined), by Types 2025 & 2033
- Figure 17: Europe Compliance and Traceability Solutions Revenue Share (%), by Types 2025 & 2033
- Figure 18: Europe Compliance and Traceability Solutions Revenue (undefined), by Country 2025 & 2033
- Figure 19: Europe Compliance and Traceability Solutions Revenue Share (%), by Country 2025 & 2033
- Figure 20: Middle East & Africa Compliance and Traceability Solutions Revenue (undefined), by Application 2025 & 2033
- Figure 21: Middle East & Africa Compliance and Traceability Solutions Revenue Share (%), by Application 2025 & 2033
- Figure 22: Middle East & Africa Compliance and Traceability Solutions Revenue (undefined), by Types 2025 & 2033
- Figure 23: Middle East & Africa Compliance and Traceability Solutions Revenue Share (%), by Types 2025 & 2033
- Figure 24: Middle East & Africa Compliance and Traceability Solutions Revenue (undefined), by Country 2025 & 2033
- Figure 25: Middle East & Africa Compliance and Traceability Solutions Revenue Share (%), by Country 2025 & 2033
- Figure 26: Asia Pacific Compliance and Traceability Solutions Revenue (undefined), by Application 2025 & 2033
- Figure 27: Asia Pacific Compliance and Traceability Solutions Revenue Share (%), by Application 2025 & 2033
- Figure 28: Asia Pacific Compliance and Traceability Solutions Revenue (undefined), by Types 2025 & 2033
- Figure 29: Asia Pacific Compliance and Traceability Solutions Revenue Share (%), by Types 2025 & 2033
- Figure 30: Asia Pacific Compliance and Traceability Solutions Revenue (undefined), by Country 2025 & 2033
- Figure 31: Asia Pacific Compliance and Traceability Solutions Revenue Share (%), by Country 2025 & 2033
List of Tables
- Table 1: Global Compliance and Traceability Solutions Revenue undefined Forecast, by Application 2020 & 2033
- Table 2: Global Compliance and Traceability Solutions Revenue undefined Forecast, by Types 2020 & 2033
- Table 3: Global Compliance and Traceability Solutions Revenue undefined Forecast, by Region 2020 & 2033
- Table 4: Global Compliance and Traceability Solutions Revenue undefined Forecast, by Application 2020 & 2033
- Table 5: Global Compliance and Traceability Solutions Revenue undefined Forecast, by Types 2020 & 2033
- Table 6: Global Compliance and Traceability Solutions Revenue undefined Forecast, by Country 2020 & 2033
- Table 7: United States Compliance and Traceability Solutions Revenue (undefined) Forecast, by Application 2020 & 2033
- Table 8: Canada Compliance and Traceability Solutions Revenue (undefined) Forecast, by Application 2020 & 2033
- Table 9: Mexico Compliance and Traceability Solutions Revenue (undefined) Forecast, by Application 2020 & 2033
- Table 10: Global Compliance and Traceability Solutions Revenue undefined Forecast, by Application 2020 & 2033
- Table 11: Global Compliance and Traceability Solutions Revenue undefined Forecast, by Types 2020 & 2033
- Table 12: Global Compliance and Traceability Solutions Revenue undefined Forecast, by Country 2020 & 2033
- Table 13: Brazil Compliance and Traceability Solutions Revenue (undefined) Forecast, by Application 2020 & 2033
- Table 14: Argentina Compliance and Traceability Solutions Revenue (undefined) Forecast, by Application 2020 & 2033
- Table 15: Rest of South America Compliance and Traceability Solutions Revenue (undefined) Forecast, by Application 2020 & 2033
- Table 16: Global Compliance and Traceability Solutions Revenue undefined Forecast, by Application 2020 & 2033
- Table 17: Global Compliance and Traceability Solutions Revenue undefined Forecast, by Types 2020 & 2033
- Table 18: Global Compliance and Traceability Solutions Revenue undefined Forecast, by Country 2020 & 2033
- Table 19: United Kingdom Compliance and Traceability Solutions Revenue (undefined) Forecast, by Application 2020 & 2033
- Table 20: Germany Compliance and Traceability Solutions Revenue (undefined) Forecast, by Application 2020 & 2033
- Table 21: France Compliance and Traceability Solutions Revenue (undefined) Forecast, by Application 2020 & 2033
- Table 22: Italy Compliance and Traceability Solutions Revenue (undefined) Forecast, by Application 2020 & 2033
- Table 23: Spain Compliance and Traceability Solutions Revenue (undefined) Forecast, by Application 2020 & 2033
- Table 24: Russia Compliance and Traceability Solutions Revenue (undefined) Forecast, by Application 2020 & 2033
- Table 25: Benelux Compliance and Traceability Solutions Revenue (undefined) Forecast, by Application 2020 & 2033
- Table 26: Nordics Compliance and Traceability Solutions Revenue (undefined) Forecast, by Application 2020 & 2033
- Table 27: Rest of Europe Compliance and Traceability Solutions Revenue (undefined) Forecast, by Application 2020 & 2033
- Table 28: Global Compliance and Traceability Solutions Revenue undefined Forecast, by Application 2020 & 2033
- Table 29: Global Compliance and Traceability Solutions Revenue undefined Forecast, by Types 2020 & 2033
- Table 30: Global Compliance and Traceability Solutions Revenue undefined Forecast, by Country 2020 & 2033
- Table 31: Turkey Compliance and Traceability Solutions Revenue (undefined) Forecast, by Application 2020 & 2033
- Table 32: Israel Compliance and Traceability Solutions Revenue (undefined) Forecast, by Application 2020 & 2033
- Table 33: GCC Compliance and Traceability Solutions Revenue (undefined) Forecast, by Application 2020 & 2033
- Table 34: North Africa Compliance and Traceability Solutions Revenue (undefined) Forecast, by Application 2020 & 2033
- Table 35: South Africa Compliance and Traceability Solutions Revenue (undefined) Forecast, by Application 2020 & 2033
- Table 36: Rest of Middle East & Africa Compliance and Traceability Solutions Revenue (undefined) Forecast, by Application 2020 & 2033
- Table 37: Global Compliance and Traceability Solutions Revenue undefined Forecast, by Application 2020 & 2033
- Table 38: Global Compliance and Traceability Solutions Revenue undefined Forecast, by Types 2020 & 2033
- Table 39: Global Compliance and Traceability Solutions Revenue undefined Forecast, by Country 2020 & 2033
- Table 40: China Compliance and Traceability Solutions Revenue (undefined) Forecast, by Application 2020 & 2033
- Table 41: India Compliance and Traceability Solutions Revenue (undefined) Forecast, by Application 2020 & 2033
- Table 42: Japan Compliance and Traceability Solutions Revenue (undefined) Forecast, by Application 2020 & 2033
- Table 43: South Korea Compliance and Traceability Solutions Revenue (undefined) Forecast, by Application 2020 & 2033
- Table 44: ASEAN Compliance and Traceability Solutions Revenue (undefined) Forecast, by Application 2020 & 2033
- Table 45: Oceania Compliance and Traceability Solutions Revenue (undefined) Forecast, by Application 2020 & 2033
- Table 46: Rest of Asia Pacific Compliance and Traceability Solutions Revenue (undefined) Forecast, by Application 2020 & 2033
Frequently Asked Questions
1. What is the projected Compound Annual Growth Rate (CAGR) of the Compliance and Traceability Solutions?
The projected CAGR is approximately 10.13%.
2. Which companies are prominent players in the Compliance and Traceability Solutions?
Key companies in the market include SAP, Apriso, Oracle, Infosys, Tuleap, TrusTrace, Tata Consultancy Services, OPTEL GROUP, Omron Automation, Agrilyze, Dassault Systèmes, 4CRisk, Mettler Toledo.
3. What are the main segments of the Compliance and Traceability Solutions?
The market segments include Application, Types.
4. Can you provide details about the market size?
The market size is estimated to be USD XXX N/A as of 2022.
5. What are some drivers contributing to market growth?
N/A
6. What are the notable trends driving market growth?
N/A
7. Are there any restraints impacting market growth?
N/A
8. Can you provide examples of recent developments in the market?
N/A
9. What pricing options are available for accessing the report?
Pricing options include single-user, multi-user, and enterprise licenses priced at USD 2900.00, USD 4350.00, and USD 5800.00 respectively.
10. Is the market size provided in terms of value or volume?
The market size is provided in terms of value, measured in N/A.
11. Are there any specific market keywords associated with the report?
Yes, the market keyword associated with the report is "Compliance and Traceability Solutions," which aids in identifying and referencing the specific market segment covered.
12. How do I determine which pricing option suits my needs best?
The pricing options vary based on user requirements and access needs. Individual users may opt for single-user licenses, while businesses requiring broader access may choose multi-user or enterprise licenses for cost-effective access to the report.
13. Are there any additional resources or data provided in the Compliance and Traceability Solutions report?
While the report offers comprehensive insights, it's advisable to review the specific contents or supplementary materials provided to ascertain if additional resources or data are available.
14. How can I stay updated on further developments or reports in the Compliance and Traceability Solutions?
To stay informed about further developments, trends, and reports in the Compliance and Traceability Solutions, consider subscribing to industry newsletters, following relevant companies and organizations, or regularly checking reputable industry news sources and publications.
Methodology
Step 1 - Identification of Relevant Samples Size from Population Database


Step 2 - Approaches for Defining Global Market Size (Value, Volume* & Price*)

Note*: In applicable scenarios
Step 3 - Data Sources
Primary Research
- Web Analytics
- Survey Reports
- Research Institute
- Latest Research Reports
- Opinion Leaders
Secondary Research
- Annual Reports
- White Paper
- Latest Press Release
- Industry Association
- Paid Database
- Investor Presentations

Step 4 - Data Triangulation
Involves using different sources of information in order to increase the validity of a study
These sources are likely to be stakeholders in a program - participants, other researchers, program staff, other community members, and so on.
Then we put all data in single framework & apply various statistical tools to find out the dynamic on the market.
During the analysis stage, feedback from the stakeholder groups would be compared to determine areas of agreement as well as areas of divergence