

Key Insights
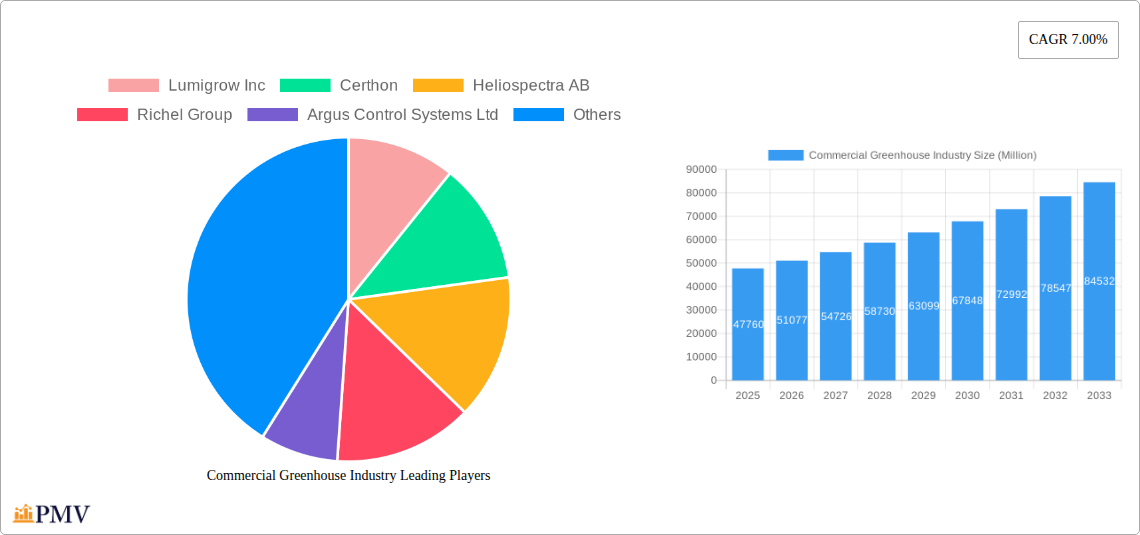
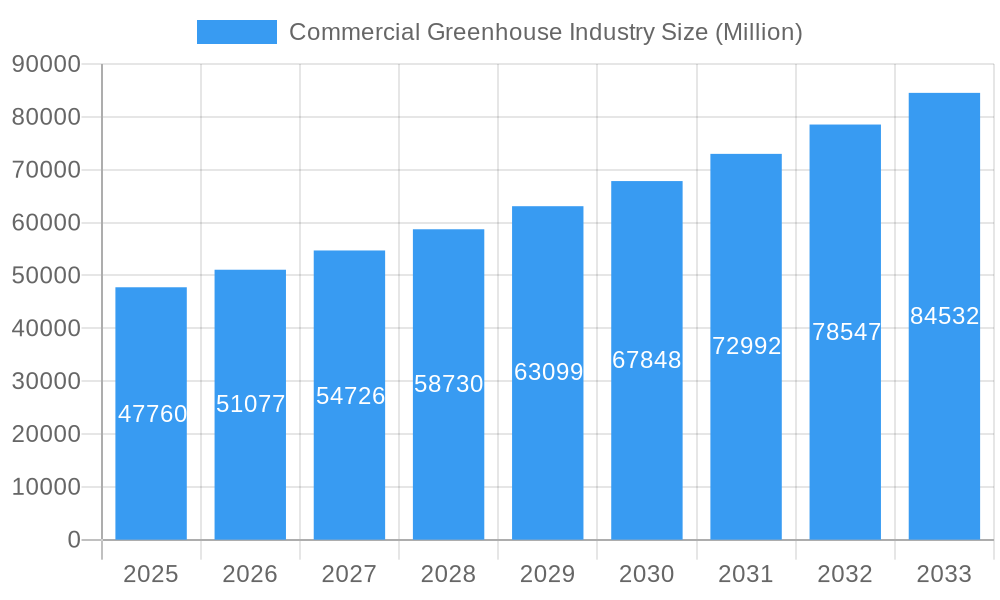
The commercial greenhouse industry, valued at $47.76 billion in 2025, is experiencing robust growth, projected to expand at a Compound Annual Growth Rate (CAGR) of 7.00% from 2025 to 2033. This expansion is driven by several key factors. Increasing consumer demand for fresh, locally sourced produce fuels the need for efficient and controlled growing environments. Technological advancements in greenhouse technologies, such as sophisticated climate control systems (heating, cooling, and lighting), automation, and data analytics, are optimizing yields and reducing operational costs. Furthermore, the growing awareness of sustainable agricultural practices and the need for year-round crop production are bolstering market growth. Specific segments experiencing significant traction include advanced glass greenhouses offering superior light transmission and climate regulation, and high-tech equipment like automated irrigation and fertigation systems. Horticultural crops, including high-value produce like berries and leafy greens, dominate the crop type segment, while the herbs segment is exhibiting strong growth fueled by increasing demand for fresh herbs in food and beverage applications. North America and Europe currently hold significant market shares, but the Asia-Pacific region is poised for substantial expansion due to rising disposable incomes and increasing agricultural investments. Competition among major players like Lumigrow Inc., Certhon, and Richel Group is fostering innovation and driving efficiency improvements.
Commercial Greenhouse Industry Market Size (In Billion)
The industry faces certain challenges, however. High initial investment costs for establishing and maintaining commercial greenhouses can be a barrier to entry for smaller businesses. Fluctuations in energy prices can significantly impact operational profitability, necessitating energy-efficient technologies and strategies. Climate change effects, such as extreme weather events, can also pose risks to greenhouse operations, highlighting the need for resilient infrastructure and adaptive farming practices. Despite these challenges, the overall outlook for the commercial greenhouse industry remains positive, with continued growth driven by technological innovation, increasing consumer demand for sustainable produce, and expansion into new geographical markets. The industry's future trajectory will largely depend on the successful adoption of advanced technologies, sustainable practices, and effective risk mitigation strategies.
Commercial Greenhouse Industry Company Market Share
Commercial Greenhouse Industry Market Report: 2019-2033
This comprehensive report provides an in-depth analysis of the global commercial greenhouse industry, offering invaluable insights for businesses, investors, and researchers. With a study period spanning 2019-2033, a base year of 2025, and a forecast period of 2025-2033, this report illuminates the market's trajectory and identifies key opportunities for growth. The report covers a market valued at $xx Million in 2025, projected to reach $xx Million by 2033, exhibiting a CAGR of xx%.
Commercial Greenhouse Industry Market Structure & Competitive Dynamics
This section analyzes the competitive landscape of the commercial greenhouse industry, encompassing market concentration, innovation ecosystems, regulatory frameworks, product substitutes, end-user trends, and mergers & acquisitions (M&A) activities. The industry exhibits a moderately concentrated structure, with key players holding significant market share. However, the presence of numerous smaller players indicates a dynamic and competitive environment.
- Market Concentration: The top five players (Lumigrow Inc, Certhon, Heliospectra AB, Richel Group, Argus Control Systems Ltd) collectively hold an estimated xx% market share, leaving significant room for smaller players and new entrants.
- Innovation Ecosystems: Strong innovation is driven by technological advancements in areas like automation, precision agriculture, and lighting systems. Collaboration between research institutions, technology providers, and greenhouse operators is crucial for innovation.
- Regulatory Frameworks: Government regulations regarding environmental sustainability, water usage, and food safety influence market dynamics. Compliance with these regulations is a key factor for successful businesses.
- Product Substitutes: Traditional farming methods present a key substitute, however, the increasing demand for year-round crop production and improved quality promotes the adoption of commercial greenhouses.
- End-User Trends: Growing consumer demand for locally sourced, fresh produce fuels industry growth. The increasing focus on sustainable and environmentally responsible food production further strengthens this trend.
- M&A Activities: The industry has witnessed significant M&A activity in recent years, with deal values exceeding $xx Million in the past five years, driving consolidation and technological integration. Examples include Richel Group's strategic partnerships and Certhon's collaboration with Living Greens Farm.
Commercial Greenhouse Industry Industry Trends & Insights
This section delves into the key trends shaping the commercial greenhouse industry. Market growth is propelled by factors such as rising consumer demand for fresh produce, technological advancements in greenhouse automation and climate control, and increasing investments in sustainable agricultural practices. A detailed analysis of these factors, alongside competitive dynamics and consumer preferences, is provided. The market is expected to experience robust growth, driven by technological advancements and increasing demand for high-quality, sustainably produced food. This includes a projected CAGR of xx% between 2025 and 2033, with notable penetration into new markets like the Middle East and Asia. The shift towards vertical farming and aeroponic techniques is also a significant trend.
Dominant Markets & Segments in Commercial Greenhouse Industry
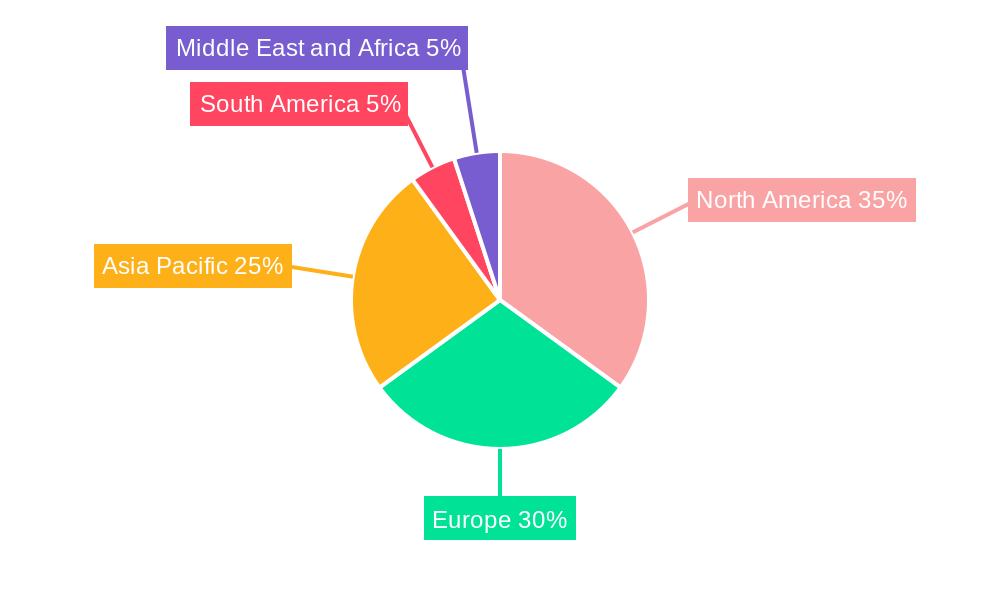
This section identifies the leading regions, countries, and segments within the commercial greenhouse industry. The market is geographically diverse, with substantial growth observed across various regions.
- Greenhouse Type: Glass greenhouses maintain a significant market share due to their durability and climate control capabilities, although plastic greenhouses are experiencing rapid growth owing to their lower cost and ease of construction.
- Equipment Type: The demand for advanced heating and cooling systems is high, driven by the need for precise climate control. The “Other Equipment Types” segment, including automation, monitoring, and lighting systems, shows significant growth potential.
- Crop Type: Horticulture crops (fruits, vegetables, and flowers) dominate the market, with herbs and other specialty crops demonstrating increasing popularity.
- Leading Regions/Countries: North America and Europe currently hold significant market share, but regions like Asia and the Middle East are experiencing rapid growth, driven by investments in advanced agricultural technologies and favorable government policies.
Commercial Greenhouse Industry Product Innovations
Recent innovations include advancements in LED lighting systems that optimize plant growth, automated climate control systems that ensure optimal growing conditions, and the rise of vertical farming and aeroponic technologies, improving efficiency and yield. These innovations cater to various market needs, addressing issues such as resource efficiency, sustainability, and crop quality.
Report Segmentation & Scope
This report segments the commercial greenhouse industry based on greenhouse type (glass, plastic), equipment type (heating, cooling, other), and crop type (horticulture, herbs, other). Each segment’s growth projections, market size, and competitive dynamics are analyzed. The detailed segmentation provides a granular understanding of the market and its constituent parts, enabling targeted analysis and strategic decision-making. Growth projections for each segment vary based on factors such as technological advancements, regional demand, and regulatory frameworks. For example, the plastic greenhouse segment is expected to show significant growth due to cost-effectiveness.
Key Drivers of Commercial Greenhouse Industry Growth
The growth of the commercial greenhouse industry is primarily driven by:
- Technological advancements: Automation, precision agriculture, and LED lighting improve efficiency and yield.
- Increasing consumer demand: Growing consumer preference for fresh, locally sourced produce boosts market demand.
- Government support: Investments in agricultural technology and supportive regulatory frameworks promote industry growth.
Challenges in the Commercial Greenhouse Industry Sector
Challenges facing the industry include:
- High initial investment costs: Setting up a commercial greenhouse requires substantial capital investment.
- Energy consumption: Greenhouse operations often require significant energy resources, increasing operational costs.
- Climate change: Extreme weather events and resource scarcity can disrupt operations.
Leading Players in the Commercial Greenhouse Industry Market
- Lumigrow Inc
- Certhon
- Heliospectra AB
- Richel Group
- Argus Control Systems Ltd
- Agra Tech Inc
- Rough Brothers Inc
- Logiqs BV
- International Greenhouse Company
- Gibraltar Industries (Nexus Corporation)
Key Developments in Commercial Greenhouse Industry Sector
- September 2023: Richel Group's three-year strategic partnership enhances its capacity for high-tech greenhouse construction in challenging climates.
- June 2023: Certhon and Living Greens Farm's partnership accelerates the global expansion of aeroponic growing technology.
- February 2023: Heliospectra AB's launch of MITRA Flex expands its product portfolio and enhances customization options for growers.
Strategic Commercial Greenhouse Industry Market Outlook
The future of the commercial greenhouse industry is bright, driven by technological advancements, growing consumer demand, and increased investment in sustainable agriculture. Strategic opportunities exist in areas such as developing innovative climate control systems, optimizing resource utilization, and expanding into new markets. The industry's focus on sustainability, coupled with technological innovation, will continue to fuel growth and reshape the global food system.
Commercial Greenhouse Industry Segmentation
- 1. Production Analysis
- 2. Consumption Analysis
- 3. Import Market Analysis (Value & Volume)
- 4. Export Market Analysis (Value & Volume)
- 5. Price Trend Analysis
Commercial Greenhouse Industry Segmentation By Geography
-
1. North America
- 1.1. United States
- 1.2. Canada
- 1.3. Mexico
-
2. South America
- 2.1. Brazil
- 2.2. Argentina
- 2.3. Rest of South America
-
3. Europe
- 3.1. United Kingdom
- 3.2. Germany
- 3.3. France
- 3.4. Italy
- 3.5. Spain
- 3.6. Russia
- 3.7. Benelux
- 3.8. Nordics
- 3.9. Rest of Europe
-
4. Middle East & Africa
- 4.1. Turkey
- 4.2. Israel
- 4.3. GCC
- 4.4. North Africa
- 4.5. South Africa
- 4.6. Rest of Middle East & Africa
-
5. Asia Pacific
- 5.1. China
- 5.2. India
- 5.3. Japan
- 5.4. South Korea
- 5.5. ASEAN
- 5.6. Oceania
- 5.7. Rest of Asia Pacific
Commercial Greenhouse Industry Regional Market Share
Geographic Coverage of Commercial Greenhouse Industry
Commercial Greenhouse Industry REPORT HIGHLIGHTS
| Aspects | Details |
|---|---|
| Study Period | 2020-2034 |
| Base Year | 2025 |
| Estimated Year | 2026 |
| Forecast Period | 2026-2034 |
| Historical Period | 2020-2025 |
| Growth Rate | CAGR of 7.00% from 2020-2034 |
| Segmentation |
|
Table of Contents
- 1. Introduction
- 1.1. Research Scope
- 1.2. Market Segmentation
- 1.3. Research Objective
- 1.4. Definitions and Assumptions
- 2. Executive Summary
- 2.1. Market Snapshot
- 3. Market Dynamics
- 3.1. Market Drivers
- 3.2. Market Restrains
- 3.3. Market Trends
- 3.4. Market Opportunities
- 4. Market Factor Analysis
- 4.1. Porters Five Forces
- 4.1.1. Bargaining Power of Suppliers
- 4.1.2. Bargaining Power of Buyers
- 4.1.3. Threat of New Entrants
- 4.1.4. Threat of Substitutes
- 4.1.5. Competitive Rivalry
- 4.2. PESTEL analysis
- 4.3. BCG Analysis
- 4.3.1. Stars (High Growth, High Market Share)
- 4.3.2. Cash Cows (Low Growth, High Market Share)
- 4.3.3. Question Mark (High Growth, Low Market Share)
- 4.3.4. Dogs (Low Growth, Low Market Share)
- 4.4. Ansoff Matrix Analysis
- 4.5. Supply Chain Analysis
- 4.6. Regulatory Landscape
- 4.7. Current Market Potential and Opportunity Assessment (TAM–SAM–SOM Framework)
- 4.8. PMV Analyst Note
- 4.1. Porters Five Forces
- 5. Market Analysis, Insights and Forecast 2021-2033
- 5.1. Market Analysis, Insights and Forecast - by Production Analysis
- 5.2. Market Analysis, Insights and Forecast - by Consumption Analysis
- 5.3. Market Analysis, Insights and Forecast - by Import Market Analysis (Value & Volume)
- 5.4. Market Analysis, Insights and Forecast - by Export Market Analysis (Value & Volume)
- 5.5. Market Analysis, Insights and Forecast - by Price Trend Analysis
- 5.6. Market Analysis, Insights and Forecast - by Region
- 5.6.1. North America
- 5.6.2. South America
- 5.6.3. Europe
- 5.6.4. Middle East & Africa
- 5.6.5. Asia Pacific
- 6. Global Commercial Greenhouse Industry Analysis, Insights and Forecast, 2021-2033
- 6.1. Market Analysis, Insights and Forecast - by Production Analysis
- 6.2. Market Analysis, Insights and Forecast - by Consumption Analysis
- 6.3. Market Analysis, Insights and Forecast - by Import Market Analysis (Value & Volume)
- 6.4. Market Analysis, Insights and Forecast - by Export Market Analysis (Value & Volume)
- 6.5. Market Analysis, Insights and Forecast - by Price Trend Analysis
- 7. North America Commercial Greenhouse Industry Analysis, Insights and Forecast, 2020-2032
- 7.1. Market Analysis, Insights and Forecast - by Production Analysis
- 7.2. Market Analysis, Insights and Forecast - by Consumption Analysis
- 7.3. Market Analysis, Insights and Forecast - by Import Market Analysis (Value & Volume)
- 7.4. Market Analysis, Insights and Forecast - by Export Market Analysis (Value & Volume)
- 7.5. Market Analysis, Insights and Forecast - by Price Trend Analysis
- 8. South America Commercial Greenhouse Industry Analysis, Insights and Forecast, 2020-2032
- 8.1. Market Analysis, Insights and Forecast - by Production Analysis
- 8.2. Market Analysis, Insights and Forecast - by Consumption Analysis
- 8.3. Market Analysis, Insights and Forecast - by Import Market Analysis (Value & Volume)
- 8.4. Market Analysis, Insights and Forecast - by Export Market Analysis (Value & Volume)
- 8.5. Market Analysis, Insights and Forecast - by Price Trend Analysis
- 9. Europe Commercial Greenhouse Industry Analysis, Insights and Forecast, 2020-2032
- 9.1. Market Analysis, Insights and Forecast - by Production Analysis
- 9.2. Market Analysis, Insights and Forecast - by Consumption Analysis
- 9.3. Market Analysis, Insights and Forecast - by Import Market Analysis (Value & Volume)
- 9.4. Market Analysis, Insights and Forecast - by Export Market Analysis (Value & Volume)
- 9.5. Market Analysis, Insights and Forecast - by Price Trend Analysis
- 10. Middle East & Africa Commercial Greenhouse Industry Analysis, Insights and Forecast, 2020-2032
- 10.1. Market Analysis, Insights and Forecast - by Production Analysis
- 10.2. Market Analysis, Insights and Forecast - by Consumption Analysis
- 10.3. Market Analysis, Insights and Forecast - by Import Market Analysis (Value & Volume)
- 10.4. Market Analysis, Insights and Forecast - by Export Market Analysis (Value & Volume)
- 10.5. Market Analysis, Insights and Forecast - by Price Trend Analysis
- 11. Asia Pacific Commercial Greenhouse Industry Analysis, Insights and Forecast, 2020-2032
- 11.1. Market Analysis, Insights and Forecast - by Production Analysis
- 11.2. Market Analysis, Insights and Forecast - by Consumption Analysis
- 11.3. Market Analysis, Insights and Forecast - by Import Market Analysis (Value & Volume)
- 11.4. Market Analysis, Insights and Forecast - by Export Market Analysis (Value & Volume)
- 11.5. Market Analysis, Insights and Forecast - by Price Trend Analysis
- 12. Competitive Analysis
- 12.1. Company Profiles
- 12.1.1 Lumigrow Inc
- 12.1.1.1. Company Overview
- 12.1.1.2. Products
- 12.1.1.3. Company Financials
- 12.1.1.4. SWOT Analysis
- 12.1.2 Certhon
- 12.1.2.1. Company Overview
- 12.1.2.2. Products
- 12.1.2.3. Company Financials
- 12.1.2.4. SWOT Analysis
- 12.1.3 Heliospectra AB
- 12.1.3.1. Company Overview
- 12.1.3.2. Products
- 12.1.3.3. Company Financials
- 12.1.3.4. SWOT Analysis
- 12.1.4 Richel Group
- 12.1.4.1. Company Overview
- 12.1.4.2. Products
- 12.1.4.3. Company Financials
- 12.1.4.4. SWOT Analysis
- 12.1.5 Argus Control Systems Ltd
- 12.1.5.1. Company Overview
- 12.1.5.2. Products
- 12.1.5.3. Company Financials
- 12.1.5.4. SWOT Analysis
- 12.1.6 Agra Tech Inc *List Not Exhaustive
- 12.1.6.1. Company Overview
- 12.1.6.2. Products
- 12.1.6.3. Company Financials
- 12.1.6.4. SWOT Analysis
- 12.1.7 Rough Brothers Inc
- 12.1.7.1. Company Overview
- 12.1.7.2. Products
- 12.1.7.3. Company Financials
- 12.1.7.4. SWOT Analysis
- 12.1.8 Logiqs BV
- 12.1.8.1. Company Overview
- 12.1.8.2. Products
- 12.1.8.3. Company Financials
- 12.1.8.4. SWOT Analysis
- 12.1.9 International Greenhouse Company
- 12.1.9.1. Company Overview
- 12.1.9.2. Products
- 12.1.9.3. Company Financials
- 12.1.9.4. SWOT Analysis
- 12.1.10 Gibraltar Industries (Nexus Corporation)
- 12.1.10.1. Company Overview
- 12.1.10.2. Products
- 12.1.10.3. Company Financials
- 12.1.10.4. SWOT Analysis
- 12.1.1 Lumigrow Inc
- 12.2. Market Entropy
- 12.2.1 Company's Key Areas Served
- 12.2.2 Recent Developments
- 12.3. Company Market Share Analysis 2025
- 12.3.1 Top 5 Companies Market Share Analysis
- 12.3.2 Top 3 Companies Market Share Analysis
- 12.4. List of Potential Customers
- 13. Research Methodology
List of Figures
- Figure 1: Global Commercial Greenhouse Industry Revenue Breakdown (Million, %) by Region 2025 & 2033
- Figure 2: Global Commercial Greenhouse Industry Volume Breakdown (Kiloton, %) by Region 2025 & 2033
- Figure 3: North America Commercial Greenhouse Industry Revenue (Million), by Production Analysis 2025 & 2033
- Figure 4: North America Commercial Greenhouse Industry Volume (Kiloton), by Production Analysis 2025 & 2033
- Figure 5: North America Commercial Greenhouse Industry Revenue Share (%), by Production Analysis 2025 & 2033
- Figure 6: North America Commercial Greenhouse Industry Volume Share (%), by Production Analysis 2025 & 2033
- Figure 7: North America Commercial Greenhouse Industry Revenue (Million), by Consumption Analysis 2025 & 2033
- Figure 8: North America Commercial Greenhouse Industry Volume (Kiloton), by Consumption Analysis 2025 & 2033
- Figure 9: North America Commercial Greenhouse Industry Revenue Share (%), by Consumption Analysis 2025 & 2033
- Figure 10: North America Commercial Greenhouse Industry Volume Share (%), by Consumption Analysis 2025 & 2033
- Figure 11: North America Commercial Greenhouse Industry Revenue (Million), by Import Market Analysis (Value & Volume) 2025 & 2033
- Figure 12: North America Commercial Greenhouse Industry Volume (Kiloton), by Import Market Analysis (Value & Volume) 2025 & 2033
- Figure 13: North America Commercial Greenhouse Industry Revenue Share (%), by Import Market Analysis (Value & Volume) 2025 & 2033
- Figure 14: North America Commercial Greenhouse Industry Volume Share (%), by Import Market Analysis (Value & Volume) 2025 & 2033
- Figure 15: North America Commercial Greenhouse Industry Revenue (Million), by Export Market Analysis (Value & Volume) 2025 & 2033
- Figure 16: North America Commercial Greenhouse Industry Volume (Kiloton), by Export Market Analysis (Value & Volume) 2025 & 2033
- Figure 17: North America Commercial Greenhouse Industry Revenue Share (%), by Export Market Analysis (Value & Volume) 2025 & 2033
- Figure 18: North America Commercial Greenhouse Industry Volume Share (%), by Export Market Analysis (Value & Volume) 2025 & 2033
- Figure 19: North America Commercial Greenhouse Industry Revenue (Million), by Price Trend Analysis 2025 & 2033
- Figure 20: North America Commercial Greenhouse Industry Volume (Kiloton), by Price Trend Analysis 2025 & 2033
- Figure 21: North America Commercial Greenhouse Industry Revenue Share (%), by Price Trend Analysis 2025 & 2033
- Figure 22: North America Commercial Greenhouse Industry Volume Share (%), by Price Trend Analysis 2025 & 2033
- Figure 23: North America Commercial Greenhouse Industry Revenue (Million), by Country 2025 & 2033
- Figure 24: North America Commercial Greenhouse Industry Volume (Kiloton), by Country 2025 & 2033
- Figure 25: North America Commercial Greenhouse Industry Revenue Share (%), by Country 2025 & 2033
- Figure 26: North America Commercial Greenhouse Industry Volume Share (%), by Country 2025 & 2033
- Figure 27: South America Commercial Greenhouse Industry Revenue (Million), by Production Analysis 2025 & 2033
- Figure 28: South America Commercial Greenhouse Industry Volume (Kiloton), by Production Analysis 2025 & 2033
- Figure 29: South America Commercial Greenhouse Industry Revenue Share (%), by Production Analysis 2025 & 2033
- Figure 30: South America Commercial Greenhouse Industry Volume Share (%), by Production Analysis 2025 & 2033
- Figure 31: South America Commercial Greenhouse Industry Revenue (Million), by Consumption Analysis 2025 & 2033
- Figure 32: South America Commercial Greenhouse Industry Volume (Kiloton), by Consumption Analysis 2025 & 2033
- Figure 33: South America Commercial Greenhouse Industry Revenue Share (%), by Consumption Analysis 2025 & 2033
- Figure 34: South America Commercial Greenhouse Industry Volume Share (%), by Consumption Analysis 2025 & 2033
- Figure 35: South America Commercial Greenhouse Industry Revenue (Million), by Import Market Analysis (Value & Volume) 2025 & 2033
- Figure 36: South America Commercial Greenhouse Industry Volume (Kiloton), by Import Market Analysis (Value & Volume) 2025 & 2033
- Figure 37: South America Commercial Greenhouse Industry Revenue Share (%), by Import Market Analysis (Value & Volume) 2025 & 2033
- Figure 38: South America Commercial Greenhouse Industry Volume Share (%), by Import Market Analysis (Value & Volume) 2025 & 2033
- Figure 39: South America Commercial Greenhouse Industry Revenue (Million), by Export Market Analysis (Value & Volume) 2025 & 2033
- Figure 40: South America Commercial Greenhouse Industry Volume (Kiloton), by Export Market Analysis (Value & Volume) 2025 & 2033
- Figure 41: South America Commercial Greenhouse Industry Revenue Share (%), by Export Market Analysis (Value & Volume) 2025 & 2033
- Figure 42: South America Commercial Greenhouse Industry Volume Share (%), by Export Market Analysis (Value & Volume) 2025 & 2033
- Figure 43: South America Commercial Greenhouse Industry Revenue (Million), by Price Trend Analysis 2025 & 2033
- Figure 44: South America Commercial Greenhouse Industry Volume (Kiloton), by Price Trend Analysis 2025 & 2033
- Figure 45: South America Commercial Greenhouse Industry Revenue Share (%), by Price Trend Analysis 2025 & 2033
- Figure 46: South America Commercial Greenhouse Industry Volume Share (%), by Price Trend Analysis 2025 & 2033
- Figure 47: South America Commercial Greenhouse Industry Revenue (Million), by Country 2025 & 2033
- Figure 48: South America Commercial Greenhouse Industry Volume (Kiloton), by Country 2025 & 2033
- Figure 49: South America Commercial Greenhouse Industry Revenue Share (%), by Country 2025 & 2033
- Figure 50: South America Commercial Greenhouse Industry Volume Share (%), by Country 2025 & 2033
- Figure 51: Europe Commercial Greenhouse Industry Revenue (Million), by Production Analysis 2025 & 2033
- Figure 52: Europe Commercial Greenhouse Industry Volume (Kiloton), by Production Analysis 2025 & 2033
- Figure 53: Europe Commercial Greenhouse Industry Revenue Share (%), by Production Analysis 2025 & 2033
- Figure 54: Europe Commercial Greenhouse Industry Volume Share (%), by Production Analysis 2025 & 2033
- Figure 55: Europe Commercial Greenhouse Industry Revenue (Million), by Consumption Analysis 2025 & 2033
- Figure 56: Europe Commercial Greenhouse Industry Volume (Kiloton), by Consumption Analysis 2025 & 2033
- Figure 57: Europe Commercial Greenhouse Industry Revenue Share (%), by Consumption Analysis 2025 & 2033
- Figure 58: Europe Commercial Greenhouse Industry Volume Share (%), by Consumption Analysis 2025 & 2033
- Figure 59: Europe Commercial Greenhouse Industry Revenue (Million), by Import Market Analysis (Value & Volume) 2025 & 2033
- Figure 60: Europe Commercial Greenhouse Industry Volume (Kiloton), by Import Market Analysis (Value & Volume) 2025 & 2033
- Figure 61: Europe Commercial Greenhouse Industry Revenue Share (%), by Import Market Analysis (Value & Volume) 2025 & 2033
- Figure 62: Europe Commercial Greenhouse Industry Volume Share (%), by Import Market Analysis (Value & Volume) 2025 & 2033
- Figure 63: Europe Commercial Greenhouse Industry Revenue (Million), by Export Market Analysis (Value & Volume) 2025 & 2033
- Figure 64: Europe Commercial Greenhouse Industry Volume (Kiloton), by Export Market Analysis (Value & Volume) 2025 & 2033
- Figure 65: Europe Commercial Greenhouse Industry Revenue Share (%), by Export Market Analysis (Value & Volume) 2025 & 2033
- Figure 66: Europe Commercial Greenhouse Industry Volume Share (%), by Export Market Analysis (Value & Volume) 2025 & 2033
- Figure 67: Europe Commercial Greenhouse Industry Revenue (Million), by Price Trend Analysis 2025 & 2033
- Figure 68: Europe Commercial Greenhouse Industry Volume (Kiloton), by Price Trend Analysis 2025 & 2033
- Figure 69: Europe Commercial Greenhouse Industry Revenue Share (%), by Price Trend Analysis 2025 & 2033
- Figure 70: Europe Commercial Greenhouse Industry Volume Share (%), by Price Trend Analysis 2025 & 2033
- Figure 71: Europe Commercial Greenhouse Industry Revenue (Million), by Country 2025 & 2033
- Figure 72: Europe Commercial Greenhouse Industry Volume (Kiloton), by Country 2025 & 2033
- Figure 73: Europe Commercial Greenhouse Industry Revenue Share (%), by Country 2025 & 2033
- Figure 74: Europe Commercial Greenhouse Industry Volume Share (%), by Country 2025 & 2033
- Figure 75: Middle East & Africa Commercial Greenhouse Industry Revenue (Million), by Production Analysis 2025 & 2033
- Figure 76: Middle East & Africa Commercial Greenhouse Industry Volume (Kiloton), by Production Analysis 2025 & 2033
- Figure 77: Middle East & Africa Commercial Greenhouse Industry Revenue Share (%), by Production Analysis 2025 & 2033
- Figure 78: Middle East & Africa Commercial Greenhouse Industry Volume Share (%), by Production Analysis 2025 & 2033
- Figure 79: Middle East & Africa Commercial Greenhouse Industry Revenue (Million), by Consumption Analysis 2025 & 2033
- Figure 80: Middle East & Africa Commercial Greenhouse Industry Volume (Kiloton), by Consumption Analysis 2025 & 2033
- Figure 81: Middle East & Africa Commercial Greenhouse Industry Revenue Share (%), by Consumption Analysis 2025 & 2033
- Figure 82: Middle East & Africa Commercial Greenhouse Industry Volume Share (%), by Consumption Analysis 2025 & 2033
- Figure 83: Middle East & Africa Commercial Greenhouse Industry Revenue (Million), by Import Market Analysis (Value & Volume) 2025 & 2033
- Figure 84: Middle East & Africa Commercial Greenhouse Industry Volume (Kiloton), by Import Market Analysis (Value & Volume) 2025 & 2033
- Figure 85: Middle East & Africa Commercial Greenhouse Industry Revenue Share (%), by Import Market Analysis (Value & Volume) 2025 & 2033
- Figure 86: Middle East & Africa Commercial Greenhouse Industry Volume Share (%), by Import Market Analysis (Value & Volume) 2025 & 2033
- Figure 87: Middle East & Africa Commercial Greenhouse Industry Revenue (Million), by Export Market Analysis (Value & Volume) 2025 & 2033
- Figure 88: Middle East & Africa Commercial Greenhouse Industry Volume (Kiloton), by Export Market Analysis (Value & Volume) 2025 & 2033
- Figure 89: Middle East & Africa Commercial Greenhouse Industry Revenue Share (%), by Export Market Analysis (Value & Volume) 2025 & 2033
- Figure 90: Middle East & Africa Commercial Greenhouse Industry Volume Share (%), by Export Market Analysis (Value & Volume) 2025 & 2033
- Figure 91: Middle East & Africa Commercial Greenhouse Industry Revenue (Million), by Price Trend Analysis 2025 & 2033
- Figure 92: Middle East & Africa Commercial Greenhouse Industry Volume (Kiloton), by Price Trend Analysis 2025 & 2033
- Figure 93: Middle East & Africa Commercial Greenhouse Industry Revenue Share (%), by Price Trend Analysis 2025 & 2033
- Figure 94: Middle East & Africa Commercial Greenhouse Industry Volume Share (%), by Price Trend Analysis 2025 & 2033
- Figure 95: Middle East & Africa Commercial Greenhouse Industry Revenue (Million), by Country 2025 & 2033
- Figure 96: Middle East & Africa Commercial Greenhouse Industry Volume (Kiloton), by Country 2025 & 2033
- Figure 97: Middle East & Africa Commercial Greenhouse Industry Revenue Share (%), by Country 2025 & 2033
- Figure 98: Middle East & Africa Commercial Greenhouse Industry Volume Share (%), by Country 2025 & 2033
- Figure 99: Asia Pacific Commercial Greenhouse Industry Revenue (Million), by Production Analysis 2025 & 2033
- Figure 100: Asia Pacific Commercial Greenhouse Industry Volume (Kiloton), by Production Analysis 2025 & 2033
- Figure 101: Asia Pacific Commercial Greenhouse Industry Revenue Share (%), by Production Analysis 2025 & 2033
- Figure 102: Asia Pacific Commercial Greenhouse Industry Volume Share (%), by Production Analysis 2025 & 2033
- Figure 103: Asia Pacific Commercial Greenhouse Industry Revenue (Million), by Consumption Analysis 2025 & 2033
- Figure 104: Asia Pacific Commercial Greenhouse Industry Volume (Kiloton), by Consumption Analysis 2025 & 2033
- Figure 105: Asia Pacific Commercial Greenhouse Industry Revenue Share (%), by Consumption Analysis 2025 & 2033
- Figure 106: Asia Pacific Commercial Greenhouse Industry Volume Share (%), by Consumption Analysis 2025 & 2033
- Figure 107: Asia Pacific Commercial Greenhouse Industry Revenue (Million), by Import Market Analysis (Value & Volume) 2025 & 2033
- Figure 108: Asia Pacific Commercial Greenhouse Industry Volume (Kiloton), by Import Market Analysis (Value & Volume) 2025 & 2033
- Figure 109: Asia Pacific Commercial Greenhouse Industry Revenue Share (%), by Import Market Analysis (Value & Volume) 2025 & 2033
- Figure 110: Asia Pacific Commercial Greenhouse Industry Volume Share (%), by Import Market Analysis (Value & Volume) 2025 & 2033
- Figure 111: Asia Pacific Commercial Greenhouse Industry Revenue (Million), by Export Market Analysis (Value & Volume) 2025 & 2033
- Figure 112: Asia Pacific Commercial Greenhouse Industry Volume (Kiloton), by Export Market Analysis (Value & Volume) 2025 & 2033
- Figure 113: Asia Pacific Commercial Greenhouse Industry Revenue Share (%), by Export Market Analysis (Value & Volume) 2025 & 2033
- Figure 114: Asia Pacific Commercial Greenhouse Industry Volume Share (%), by Export Market Analysis (Value & Volume) 2025 & 2033
- Figure 115: Asia Pacific Commercial Greenhouse Industry Revenue (Million), by Price Trend Analysis 2025 & 2033
- Figure 116: Asia Pacific Commercial Greenhouse Industry Volume (Kiloton), by Price Trend Analysis 2025 & 2033
- Figure 117: Asia Pacific Commercial Greenhouse Industry Revenue Share (%), by Price Trend Analysis 2025 & 2033
- Figure 118: Asia Pacific Commercial Greenhouse Industry Volume Share (%), by Price Trend Analysis 2025 & 2033
- Figure 119: Asia Pacific Commercial Greenhouse Industry Revenue (Million), by Country 2025 & 2033
- Figure 120: Asia Pacific Commercial Greenhouse Industry Volume (Kiloton), by Country 2025 & 2033
- Figure 121: Asia Pacific Commercial Greenhouse Industry Revenue Share (%), by Country 2025 & 2033
- Figure 122: Asia Pacific Commercial Greenhouse Industry Volume Share (%), by Country 2025 & 2033
List of Tables
- Table 1: Global Commercial Greenhouse Industry Revenue Million Forecast, by Production Analysis 2020 & 2033
- Table 2: Global Commercial Greenhouse Industry Volume Kiloton Forecast, by Production Analysis 2020 & 2033
- Table 3: Global Commercial Greenhouse Industry Revenue Million Forecast, by Consumption Analysis 2020 & 2033
- Table 4: Global Commercial Greenhouse Industry Volume Kiloton Forecast, by Consumption Analysis 2020 & 2033
- Table 5: Global Commercial Greenhouse Industry Revenue Million Forecast, by Import Market Analysis (Value & Volume) 2020 & 2033
- Table 6: Global Commercial Greenhouse Industry Volume Kiloton Forecast, by Import Market Analysis (Value & Volume) 2020 & 2033
- Table 7: Global Commercial Greenhouse Industry Revenue Million Forecast, by Export Market Analysis (Value & Volume) 2020 & 2033
- Table 8: Global Commercial Greenhouse Industry Volume Kiloton Forecast, by Export Market Analysis (Value & Volume) 2020 & 2033
- Table 9: Global Commercial Greenhouse Industry Revenue Million Forecast, by Price Trend Analysis 2020 & 2033
- Table 10: Global Commercial Greenhouse Industry Volume Kiloton Forecast, by Price Trend Analysis 2020 & 2033
- Table 11: Global Commercial Greenhouse Industry Revenue Million Forecast, by Region 2020 & 2033
- Table 12: Global Commercial Greenhouse Industry Volume Kiloton Forecast, by Region 2020 & 2033
- Table 13: Global Commercial Greenhouse Industry Revenue Million Forecast, by Production Analysis 2020 & 2033
- Table 14: Global Commercial Greenhouse Industry Volume Kiloton Forecast, by Production Analysis 2020 & 2033
- Table 15: Global Commercial Greenhouse Industry Revenue Million Forecast, by Consumption Analysis 2020 & 2033
- Table 16: Global Commercial Greenhouse Industry Volume Kiloton Forecast, by Consumption Analysis 2020 & 2033
- Table 17: Global Commercial Greenhouse Industry Revenue Million Forecast, by Import Market Analysis (Value & Volume) 2020 & 2033
- Table 18: Global Commercial Greenhouse Industry Volume Kiloton Forecast, by Import Market Analysis (Value & Volume) 2020 & 2033
- Table 19: Global Commercial Greenhouse Industry Revenue Million Forecast, by Export Market Analysis (Value & Volume) 2020 & 2033
- Table 20: Global Commercial Greenhouse Industry Volume Kiloton Forecast, by Export Market Analysis (Value & Volume) 2020 & 2033
- Table 21: Global Commercial Greenhouse Industry Revenue Million Forecast, by Price Trend Analysis 2020 & 2033
- Table 22: Global Commercial Greenhouse Industry Volume Kiloton Forecast, by Price Trend Analysis 2020 & 2033
- Table 23: Global Commercial Greenhouse Industry Revenue Million Forecast, by Country 2020 & 2033
- Table 24: Global Commercial Greenhouse Industry Volume Kiloton Forecast, by Country 2020 & 2033
- Table 25: United States Commercial Greenhouse Industry Revenue (Million) Forecast, by Application 2020 & 2033
- Table 26: United States Commercial Greenhouse Industry Volume (Kiloton) Forecast, by Application 2020 & 2033
- Table 27: Canada Commercial Greenhouse Industry Revenue (Million) Forecast, by Application 2020 & 2033
- Table 28: Canada Commercial Greenhouse Industry Volume (Kiloton) Forecast, by Application 2020 & 2033
- Table 29: Mexico Commercial Greenhouse Industry Revenue (Million) Forecast, by Application 2020 & 2033
- Table 30: Mexico Commercial Greenhouse Industry Volume (Kiloton) Forecast, by Application 2020 & 2033
- Table 31: Global Commercial Greenhouse Industry Revenue Million Forecast, by Production Analysis 2020 & 2033
- Table 32: Global Commercial Greenhouse Industry Volume Kiloton Forecast, by Production Analysis 2020 & 2033
- Table 33: Global Commercial Greenhouse Industry Revenue Million Forecast, by Consumption Analysis 2020 & 2033
- Table 34: Global Commercial Greenhouse Industry Volume Kiloton Forecast, by Consumption Analysis 2020 & 2033
- Table 35: Global Commercial Greenhouse Industry Revenue Million Forecast, by Import Market Analysis (Value & Volume) 2020 & 2033
- Table 36: Global Commercial Greenhouse Industry Volume Kiloton Forecast, by Import Market Analysis (Value & Volume) 2020 & 2033
- Table 37: Global Commercial Greenhouse Industry Revenue Million Forecast, by Export Market Analysis (Value & Volume) 2020 & 2033
- Table 38: Global Commercial Greenhouse Industry Volume Kiloton Forecast, by Export Market Analysis (Value & Volume) 2020 & 2033
- Table 39: Global Commercial Greenhouse Industry Revenue Million Forecast, by Price Trend Analysis 2020 & 2033
- Table 40: Global Commercial Greenhouse Industry Volume Kiloton Forecast, by Price Trend Analysis 2020 & 2033
- Table 41: Global Commercial Greenhouse Industry Revenue Million Forecast, by Country 2020 & 2033
- Table 42: Global Commercial Greenhouse Industry Volume Kiloton Forecast, by Country 2020 & 2033
- Table 43: Brazil Commercial Greenhouse Industry Revenue (Million) Forecast, by Application 2020 & 2033
- Table 44: Brazil Commercial Greenhouse Industry Volume (Kiloton) Forecast, by Application 2020 & 2033
- Table 45: Argentina Commercial Greenhouse Industry Revenue (Million) Forecast, by Application 2020 & 2033
- Table 46: Argentina Commercial Greenhouse Industry Volume (Kiloton) Forecast, by Application 2020 & 2033
- Table 47: Rest of South America Commercial Greenhouse Industry Revenue (Million) Forecast, by Application 2020 & 2033
- Table 48: Rest of South America Commercial Greenhouse Industry Volume (Kiloton) Forecast, by Application 2020 & 2033
- Table 49: Global Commercial Greenhouse Industry Revenue Million Forecast, by Production Analysis 2020 & 2033
- Table 50: Global Commercial Greenhouse Industry Volume Kiloton Forecast, by Production Analysis 2020 & 2033
- Table 51: Global Commercial Greenhouse Industry Revenue Million Forecast, by Consumption Analysis 2020 & 2033
- Table 52: Global Commercial Greenhouse Industry Volume Kiloton Forecast, by Consumption Analysis 2020 & 2033
- Table 53: Global Commercial Greenhouse Industry Revenue Million Forecast, by Import Market Analysis (Value & Volume) 2020 & 2033
- Table 54: Global Commercial Greenhouse Industry Volume Kiloton Forecast, by Import Market Analysis (Value & Volume) 2020 & 2033
- Table 55: Global Commercial Greenhouse Industry Revenue Million Forecast, by Export Market Analysis (Value & Volume) 2020 & 2033
- Table 56: Global Commercial Greenhouse Industry Volume Kiloton Forecast, by Export Market Analysis (Value & Volume) 2020 & 2033
- Table 57: Global Commercial Greenhouse Industry Revenue Million Forecast, by Price Trend Analysis 2020 & 2033
- Table 58: Global Commercial Greenhouse Industry Volume Kiloton Forecast, by Price Trend Analysis 2020 & 2033
- Table 59: Global Commercial Greenhouse Industry Revenue Million Forecast, by Country 2020 & 2033
- Table 60: Global Commercial Greenhouse Industry Volume Kiloton Forecast, by Country 2020 & 2033
- Table 61: United Kingdom Commercial Greenhouse Industry Revenue (Million) Forecast, by Application 2020 & 2033
- Table 62: United Kingdom Commercial Greenhouse Industry Volume (Kiloton) Forecast, by Application 2020 & 2033
- Table 63: Germany Commercial Greenhouse Industry Revenue (Million) Forecast, by Application 2020 & 2033
- Table 64: Germany Commercial Greenhouse Industry Volume (Kiloton) Forecast, by Application 2020 & 2033
- Table 65: France Commercial Greenhouse Industry Revenue (Million) Forecast, by Application 2020 & 2033
- Table 66: France Commercial Greenhouse Industry Volume (Kiloton) Forecast, by Application 2020 & 2033
- Table 67: Italy Commercial Greenhouse Industry Revenue (Million) Forecast, by Application 2020 & 2033
- Table 68: Italy Commercial Greenhouse Industry Volume (Kiloton) Forecast, by Application 2020 & 2033
- Table 69: Spain Commercial Greenhouse Industry Revenue (Million) Forecast, by Application 2020 & 2033
- Table 70: Spain Commercial Greenhouse Industry Volume (Kiloton) Forecast, by Application 2020 & 2033
- Table 71: Russia Commercial Greenhouse Industry Revenue (Million) Forecast, by Application 2020 & 2033
- Table 72: Russia Commercial Greenhouse Industry Volume (Kiloton) Forecast, by Application 2020 & 2033
- Table 73: Benelux Commercial Greenhouse Industry Revenue (Million) Forecast, by Application 2020 & 2033
- Table 74: Benelux Commercial Greenhouse Industry Volume (Kiloton) Forecast, by Application 2020 & 2033
- Table 75: Nordics Commercial Greenhouse Industry Revenue (Million) Forecast, by Application 2020 & 2033
- Table 76: Nordics Commercial Greenhouse Industry Volume (Kiloton) Forecast, by Application 2020 & 2033
- Table 77: Rest of Europe Commercial Greenhouse Industry Revenue (Million) Forecast, by Application 2020 & 2033
- Table 78: Rest of Europe Commercial Greenhouse Industry Volume (Kiloton) Forecast, by Application 2020 & 2033
- Table 79: Global Commercial Greenhouse Industry Revenue Million Forecast, by Production Analysis 2020 & 2033
- Table 80: Global Commercial Greenhouse Industry Volume Kiloton Forecast, by Production Analysis 2020 & 2033
- Table 81: Global Commercial Greenhouse Industry Revenue Million Forecast, by Consumption Analysis 2020 & 2033
- Table 82: Global Commercial Greenhouse Industry Volume Kiloton Forecast, by Consumption Analysis 2020 & 2033
- Table 83: Global Commercial Greenhouse Industry Revenue Million Forecast, by Import Market Analysis (Value & Volume) 2020 & 2033
- Table 84: Global Commercial Greenhouse Industry Volume Kiloton Forecast, by Import Market Analysis (Value & Volume) 2020 & 2033
- Table 85: Global Commercial Greenhouse Industry Revenue Million Forecast, by Export Market Analysis (Value & Volume) 2020 & 2033
- Table 86: Global Commercial Greenhouse Industry Volume Kiloton Forecast, by Export Market Analysis (Value & Volume) 2020 & 2033
- Table 87: Global Commercial Greenhouse Industry Revenue Million Forecast, by Price Trend Analysis 2020 & 2033
- Table 88: Global Commercial Greenhouse Industry Volume Kiloton Forecast, by Price Trend Analysis 2020 & 2033
- Table 89: Global Commercial Greenhouse Industry Revenue Million Forecast, by Country 2020 & 2033
- Table 90: Global Commercial Greenhouse Industry Volume Kiloton Forecast, by Country 2020 & 2033
- Table 91: Turkey Commercial Greenhouse Industry Revenue (Million) Forecast, by Application 2020 & 2033
- Table 92: Turkey Commercial Greenhouse Industry Volume (Kiloton) Forecast, by Application 2020 & 2033
- Table 93: Israel Commercial Greenhouse Industry Revenue (Million) Forecast, by Application 2020 & 2033
- Table 94: Israel Commercial Greenhouse Industry Volume (Kiloton) Forecast, by Application 2020 & 2033
- Table 95: GCC Commercial Greenhouse Industry Revenue (Million) Forecast, by Application 2020 & 2033
- Table 96: GCC Commercial Greenhouse Industry Volume (Kiloton) Forecast, by Application 2020 & 2033
- Table 97: North Africa Commercial Greenhouse Industry Revenue (Million) Forecast, by Application 2020 & 2033
- Table 98: North Africa Commercial Greenhouse Industry Volume (Kiloton) Forecast, by Application 2020 & 2033
- Table 99: South Africa Commercial Greenhouse Industry Revenue (Million) Forecast, by Application 2020 & 2033
- Table 100: South Africa Commercial Greenhouse Industry Volume (Kiloton) Forecast, by Application 2020 & 2033
- Table 101: Rest of Middle East & Africa Commercial Greenhouse Industry Revenue (Million) Forecast, by Application 2020 & 2033
- Table 102: Rest of Middle East & Africa Commercial Greenhouse Industry Volume (Kiloton) Forecast, by Application 2020 & 2033
- Table 103: Global Commercial Greenhouse Industry Revenue Million Forecast, by Production Analysis 2020 & 2033
- Table 104: Global Commercial Greenhouse Industry Volume Kiloton Forecast, by Production Analysis 2020 & 2033
- Table 105: Global Commercial Greenhouse Industry Revenue Million Forecast, by Consumption Analysis 2020 & 2033
- Table 106: Global Commercial Greenhouse Industry Volume Kiloton Forecast, by Consumption Analysis 2020 & 2033
- Table 107: Global Commercial Greenhouse Industry Revenue Million Forecast, by Import Market Analysis (Value & Volume) 2020 & 2033
- Table 108: Global Commercial Greenhouse Industry Volume Kiloton Forecast, by Import Market Analysis (Value & Volume) 2020 & 2033
- Table 109: Global Commercial Greenhouse Industry Revenue Million Forecast, by Export Market Analysis (Value & Volume) 2020 & 2033
- Table 110: Global Commercial Greenhouse Industry Volume Kiloton Forecast, by Export Market Analysis (Value & Volume) 2020 & 2033
- Table 111: Global Commercial Greenhouse Industry Revenue Million Forecast, by Price Trend Analysis 2020 & 2033
- Table 112: Global Commercial Greenhouse Industry Volume Kiloton Forecast, by Price Trend Analysis 2020 & 2033
- Table 113: Global Commercial Greenhouse Industry Revenue Million Forecast, by Country 2020 & 2033
- Table 114: Global Commercial Greenhouse Industry Volume Kiloton Forecast, by Country 2020 & 2033
- Table 115: China Commercial Greenhouse Industry Revenue (Million) Forecast, by Application 2020 & 2033
- Table 116: China Commercial Greenhouse Industry Volume (Kiloton) Forecast, by Application 2020 & 2033
- Table 117: India Commercial Greenhouse Industry Revenue (Million) Forecast, by Application 2020 & 2033
- Table 118: India Commercial Greenhouse Industry Volume (Kiloton) Forecast, by Application 2020 & 2033
- Table 119: Japan Commercial Greenhouse Industry Revenue (Million) Forecast, by Application 2020 & 2033
- Table 120: Japan Commercial Greenhouse Industry Volume (Kiloton) Forecast, by Application 2020 & 2033
- Table 121: South Korea Commercial Greenhouse Industry Revenue (Million) Forecast, by Application 2020 & 2033
- Table 122: South Korea Commercial Greenhouse Industry Volume (Kiloton) Forecast, by Application 2020 & 2033
- Table 123: ASEAN Commercial Greenhouse Industry Revenue (Million) Forecast, by Application 2020 & 2033
- Table 124: ASEAN Commercial Greenhouse Industry Volume (Kiloton) Forecast, by Application 2020 & 2033
- Table 125: Oceania Commercial Greenhouse Industry Revenue (Million) Forecast, by Application 2020 & 2033
- Table 126: Oceania Commercial Greenhouse Industry Volume (Kiloton) Forecast, by Application 2020 & 2033
- Table 127: Rest of Asia Pacific Commercial Greenhouse Industry Revenue (Million) Forecast, by Application 2020 & 2033
- Table 128: Rest of Asia Pacific Commercial Greenhouse Industry Volume (Kiloton) Forecast, by Application 2020 & 2033
Frequently Asked Questions
1. What is the projected Compound Annual Growth Rate (CAGR) of the Commercial Greenhouse Industry?
The projected CAGR is approximately 7.00%.
2. Which companies are prominent players in the Commercial Greenhouse Industry?
Key companies in the market include Lumigrow Inc, Certhon, Heliospectra AB, Richel Group, Argus Control Systems Ltd, Agra Tech Inc *List Not Exhaustive, Rough Brothers Inc, Logiqs BV, International Greenhouse Company, Gibraltar Industries (Nexus Corporation).
3. What are the main segments of the Commercial Greenhouse Industry?
The market segments include Production Analysis, Consumption Analysis, Import Market Analysis (Value & Volume), Export Market Analysis (Value & Volume), Price Trend Analysis.
4. Can you provide details about the market size?
The market size is estimated to be USD 47.76 Million as of 2022.
5. What are some drivers contributing to market growth?
Decreasing Per Capita Arable Land; Increased Demand for Food.
6. What are the notable trends driving market growth?
Horticultural Crops Are In High Demand.
7. Are there any restraints impacting market growth?
High Initial Investments; Requirement of Precision Agriculture.
8. Can you provide examples of recent developments in the market?
September 2023: Richel Group has been in a three-year, exclusive strategic partnership to increase its efficiency in designing, manufacturing, and building high-tech greenhouses in challenging climates and distant regions, including the Middle East and Asia.
9. What pricing options are available for accessing the report?
Pricing options include single-user, multi-user, and enterprise licenses priced at USD 4750, USD 5250, and USD 8750 respectively.
10. Is the market size provided in terms of value or volume?
The market size is provided in terms of value, measured in Million and volume, measured in Kiloton.
11. Are there any specific market keywords associated with the report?
Yes, the market keyword associated with the report is "Commercial Greenhouse Industry," which aids in identifying and referencing the specific market segment covered.
12. How do I determine which pricing option suits my needs best?
The pricing options vary based on user requirements and access needs. Individual users may opt for single-user licenses, while businesses requiring broader access may choose multi-user or enterprise licenses for cost-effective access to the report.
13. Are there any additional resources or data provided in the Commercial Greenhouse Industry report?
While the report offers comprehensive insights, it's advisable to review the specific contents or supplementary materials provided to ascertain if additional resources or data are available.
14. How can I stay updated on further developments or reports in the Commercial Greenhouse Industry?
To stay informed about further developments, trends, and reports in the Commercial Greenhouse Industry, consider subscribing to industry newsletters, following relevant companies and organizations, or regularly checking reputable industry news sources and publications.
Methodology
Step 1 - Identification of Relevant Samples Size from Population Database


Step 2 - Approaches for Defining Global Market Size (Value, Volume* & Price*)

Note*: In applicable scenarios
Step 3 - Data Sources
Primary Research
- Web Analytics
- Survey Reports
- Research Institute
- Latest Research Reports
- Opinion Leaders
Secondary Research
- Annual Reports
- White Paper
- Latest Press Release
- Industry Association
- Paid Database
- Investor Presentations

Step 4 - Data Triangulation
Involves using different sources of information in order to increase the validity of a study
These sources are likely to be stakeholders in a program - participants, other researchers, program staff, other community members, and so on.
Then we put all data in single framework & apply various statistical tools to find out the dynamic on the market.
During the analysis stage, feedback from the stakeholder groups would be compared to determine areas of agreement as well as areas of divergence