Key Insights
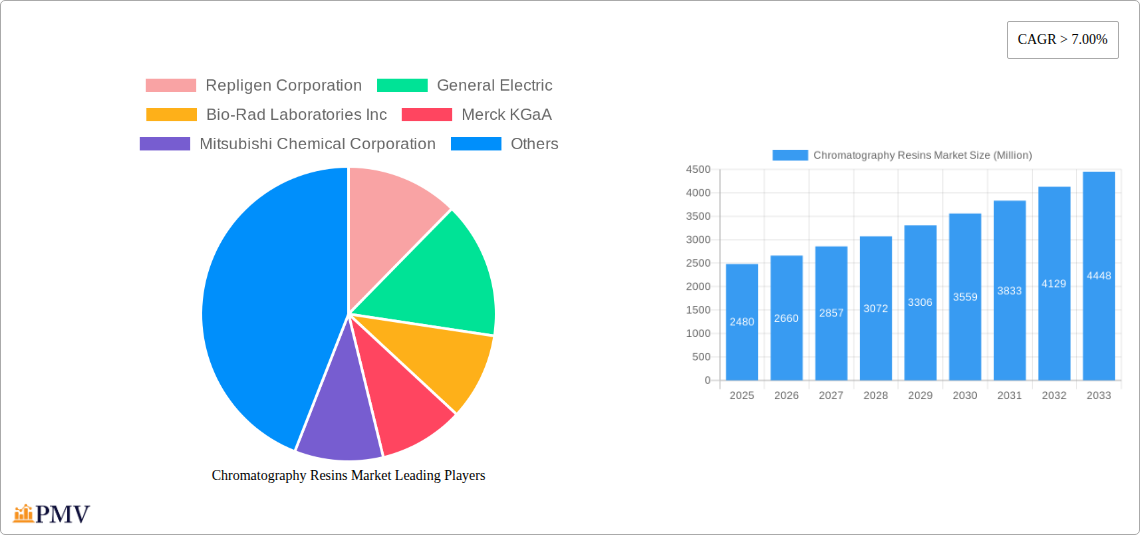
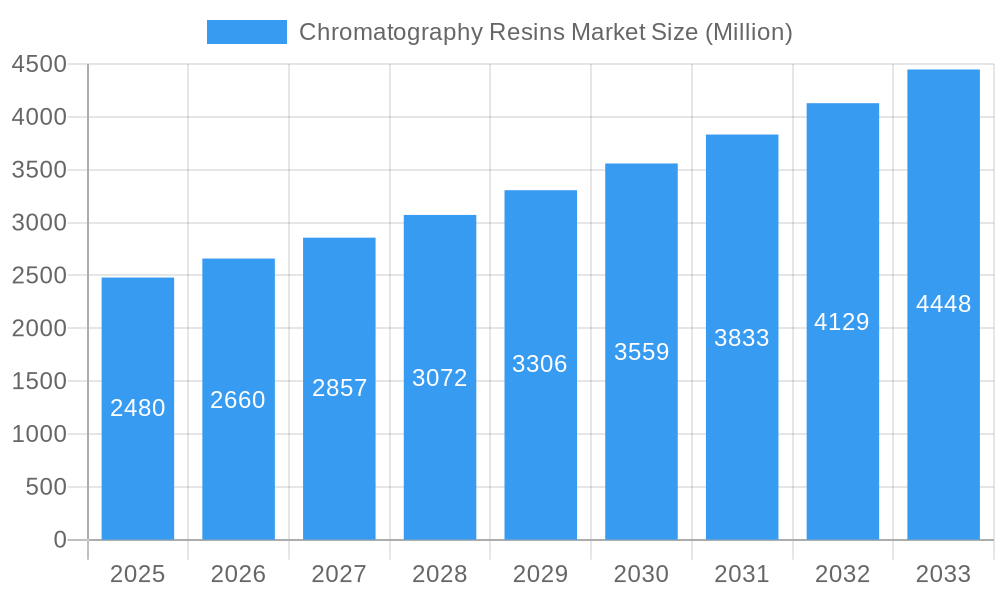
The Chromatography Resins market, currently valued at $2480 million in 2025, is projected to experience robust growth, exhibiting a Compound Annual Growth Rate (CAGR) exceeding 7% from 2025 to 2033. This expansion is driven by several key factors. The burgeoning pharmaceutical and biotechnology industries are significant contributors, relying heavily on chromatography resins for drug discovery, development, and purification. Increasing demand for high-purity products in the food and beverage sector, coupled with stringent regulatory requirements for quality control, further fuels market growth. Advancements in resin technology, including the development of more efficient and selective resins, are enhancing separation capabilities and broadening applications. The rise of personalized medicine and the growing adoption of biosimilars are also contributing to increased demand. Natural-based resins are currently a larger segment than synthetic-based ones but this may change due to technological improvements. Ion exchange chromatography resins currently dominate the technology segment, but other techniques such as affinity chromatography are experiencing significant growth.
Chromatography Resins Market Market Size (In Billion)
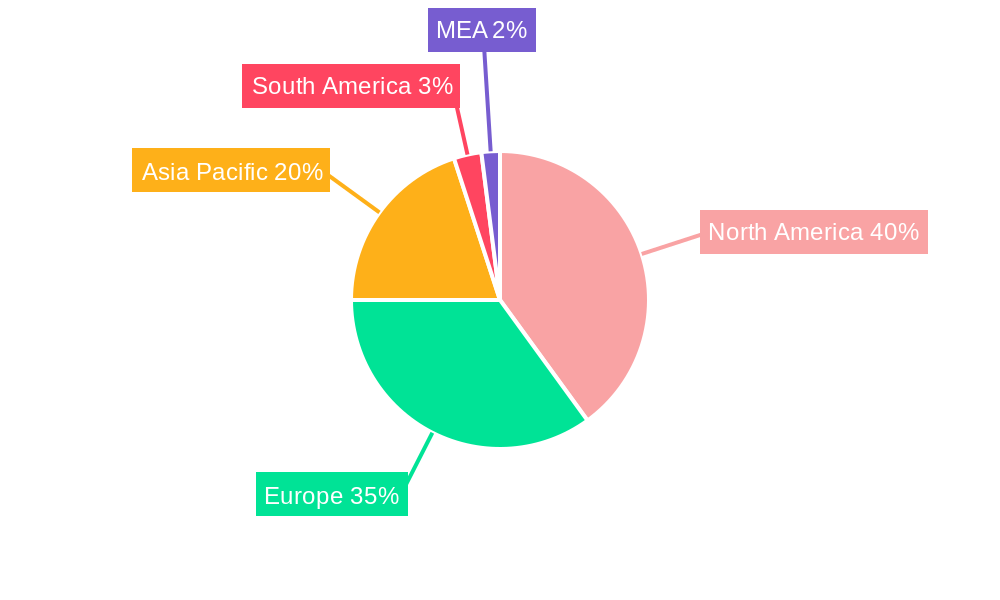
Geographical distribution reveals a substantial market presence in North America and Europe, driven by established pharmaceutical and biotech hubs and robust research infrastructure. However, the Asia-Pacific region is expected to witness significant growth owing to expanding pharmaceutical manufacturing capabilities and rising investments in healthcare infrastructure, particularly in countries like China and India. While the market faces certain restraints, such as fluctuating raw material prices and potential supply chain disruptions, the overall growth trajectory remains positive, propelled by the aforementioned drivers and the increasing reliance on chromatography techniques across diverse industries. The market's diverse segmentation, encompassing various end-user industries, resin origins, and chromatographic technologies, presents ample opportunities for market players to capitalize on specific niche applications and technological advancements. The competitive landscape is marked by the presence of both large multinational corporations and specialized resin manufacturers, resulting in continuous innovation and product development.
Chromatography Resins Market Company Market Share
This detailed report provides a comprehensive analysis of the Chromatography Resins Market, offering invaluable insights for businesses, investors, and researchers seeking to navigate this dynamic sector. The study covers the period from 2019 to 2033, with a focus on the forecast period from 2025 to 2033, using 2025 as the base year. The report incorporates extensive market sizing, segmentation, and competitive analysis, leveraging data from the historical period (2019-2024) to predict future market trends. Key players like Repligen Corporation, General Electric, Bio-Rad Laboratories Inc, Merck KGaA, and others are analyzed for their market share and strategic moves.
Chromatography Resins Market Market Structure & Competitive Dynamics
The Chromatography Resins market is characterized by a moderately concentrated landscape with several major players holding significant market share. The market structure is influenced by factors such as ongoing innovation in resin technologies, stringent regulatory frameworks, and the emergence of substitute products. End-user trends, particularly in the pharmaceutical and biotechnology sectors, significantly impact market growth. Mergers and acquisitions (M&A) play a crucial role in shaping the competitive dynamics. For instance, the acquisition of Pall Corporation's Chromatography and Filtration business by Repligen Corporation in 2021 significantly altered the market landscape. This deal, valued at approximately xx Million, illustrates the strategic importance of consolidation within the industry. Other M&A activities have contributed to market concentration, with larger companies acquiring smaller players to enhance their product portfolios and expand their market reach. The overall market concentration is estimated at xx%, with the top five players holding approximately xx% of the global market share in 2024. This level of concentration reflects the significant barriers to entry and the specialized nature of the chromatography resins technology. Innovation ecosystems, driven by ongoing research and development efforts, further influence the market structure. The regulatory frameworks vary across different regions, influencing product approvals and market access. The presence of substitute products adds to the competitive intensity. Overall, the market structure is a blend of established players and emerging companies, constantly evolving due to technological advancements and strategic acquisitions.
Chromatography Resins Market Industry Trends & Insights
The Chromatography Resins market exhibits robust growth, driven by several key factors. The increasing demand for biopharmaceuticals, coupled with advancements in protein purification techniques, fuels significant market expansion. The rising prevalence of chronic diseases and the growing focus on personalized medicine are also major growth catalysts. Technological disruptions, such as the development of novel resin materials with enhanced selectivity and binding capacity, are constantly reshaping the market. Consumer preferences, driven by the need for improved efficiency and reduced production costs, are influencing the demand for high-performance resins. The market has witnessed a Compound Annual Growth Rate (CAGR) of xx% during the historical period (2019-2024), and this is projected to continue at a CAGR of xx% during the forecast period (2025-2033). Market penetration is particularly high in developed regions, such as North America and Europe, although emerging markets are demonstrating increasing adoption rates. Competitive dynamics are influenced by factors such as pricing strategies, product differentiation, and technological innovation. The market is expected to reach xx Million by 2033, indicating substantial future growth potential. The continuous emergence of new applications across various industries further contributes to the market’s positive outlook.
Dominant Markets & Segments in Chromatography Resins Market
The pharmaceutical industry is the dominant end-user segment, accounting for the largest share of the chromatography resins market. This is driven by the critical role of chromatography in biopharmaceutical purification processes. The drug production segment within pharmaceuticals also showcases high growth, reflecting increased demand for high-purity drugs and biologics.
- Key Drivers in the Pharmaceutical Segment:
- Stringent regulatory requirements for drug purity.
- Growing demand for biosimilars and biobetters.
- Rising investment in R&D for novel drug therapies.
The synthetic-based (dextran) resins segment holds a significant market share, owing to their superior performance characteristics and versatility. Ion Exchange Chromatography Resins represent the largest technology segment, followed by Affinity Chromatography Resins.
- Key Drivers in Synthetic-Based Resins:
- Consistent and reliable performance.
- Enhanced scalability for large-scale production.
- Ability to be customized for specific applications.
North America is currently the leading region, fueled by strong R&D investments and the presence of major pharmaceutical companies. However, Asia-Pacific is expected to experience the fastest growth, driven by expanding healthcare infrastructure and increasing manufacturing capacity in emerging economies.
Chromatography Resins Market Product Innovations
Recent product innovations include the development of novel chromatography resins with enhanced selectivity, binding capacity, and stability. These advancements enable more efficient and cost-effective purification processes, particularly in the biopharmaceutical industry. For example, Thermo Fisher Scientific's launch of high-throughput resins in 2022 demonstrates a focus on improving productivity and reducing processing time. The market is witnessing the integration of advanced technologies such as automation and process analytical technologies (PAT) to further enhance efficiency and product quality. This continuous innovation leads to a competitive market landscape where companies strive to offer resins with superior performance characteristics and tailored applications.
Report Segmentation & Scope
The report segments the Chromatography Resins market based on:
End-user Industry: Pharmaceuticals, Drug Production, Water and Environmental Agencies, Food and Beverages, Other End-user Industries. Pharmaceuticals represents the largest segment, driving significant market growth.
Origin: Natural-based, Synthetic-based (Dextran). Synthetic-based resins dominate due to their consistent performance and scalability.
Technology: Ion Exchange Chromatography Resins, Affinity Chromatography Resins, Size Exclusion Chromatography Resins, Hydrophobic Interaction Chromatography Resins, Other Technologies. Ion exchange chromatography is the most widely used technology.
Each segment's growth projections, market sizes, and competitive dynamics are analyzed in detail within the report.
Key Drivers of Chromatography Resins Market Growth
The Chromatography Resins market growth is propelled by several key factors. The burgeoning biopharmaceutical industry, with its increasing demand for high-purity proteins and biologics, is a primary driver. Technological advancements, such as the development of novel resin materials with improved selectivity and efficiency, also contribute to market expansion. Stringent regulatory requirements for drug purity further drive the demand for sophisticated purification technologies, including chromatography resins. Furthermore, the growing adoption of chromatography in other industries, such as food and beverages and environmental monitoring, expands the market's reach.
Challenges in the Chromatography Resins Market Sector
Several factors pose challenges to the Chromatography Resins market. Stringent regulatory compliance requirements and the associated costs can act as barriers to market entry. Supply chain disruptions, particularly the availability of raw materials, can impact production and lead to price fluctuations. Intense competition among established players and the emergence of new entrants create pressure on pricing and profitability. The increasing demand for customized resins further challenges manufacturers to adapt their production processes and meet specific customer needs, adding complexity to the market dynamics.
Leading Players in the Chromatography Resins Market Market
- Repligen Corporation
- General Electric
- Bio-Rad Laboratories Inc
- Merck KGaA
- Mitsubishi Chemical Corporation
- Dupont
- Perkinelmer Inc
- Pall Corporation
- Tosoh Bioscience LLC
- Purolite
- Agilient Technologies
- Avantor Inc
- Thermo Fisher Scientific
Key Developments in Chromatography Resins Market Sector
- 2021: Repligen Corporation acquired Pall Corporation's Chromatography and Filtration business.
- 2022: Thermo Fisher Scientific launched a new line of chromatography resins designed for high-throughput biopharmaceutical purification.
Strategic Chromatography Resins Market Market Outlook
The Chromatography Resins market is poised for continued growth, driven by ongoing innovation in resin technologies and expanding applications across various industries. The increasing demand for biopharmaceuticals and the rise of personalized medicine will further fuel market expansion. Strategic opportunities lie in developing novel resin materials with enhanced performance characteristics and exploring new applications in emerging markets. Companies focusing on technological advancements and strategic partnerships will be well-positioned to capitalize on the market's growth potential.
Chromatography Resins Market Segmentation
-
1. Origin
-
1.1. Natural-based
- 1.1.1. Agarose
- 1.1.2. Dextran
-
1.2. Synthetic-based
- 1.2.1. Silica Gel
- 1.2.2. Aluminum Oxide
- 1.2.3. Polystyrene
- 1.2.4. Other Synthetic-based Resins
-
1.1. Natural-based
-
2. Technology
- 2.1. Ion Exchange Chromatography Resins
- 2.2. Affinity Chromatography Resins
- 2.3. Size Exclusion Chromatography Resins
- 2.4. Hydrophobic Interaction Chromatography Resins
- 2.5. Other Technologies
-
3. End-user Industry
-
3.1. Pharmaceuticals
- 3.1.1. Biotechnology
- 3.1.2. Drug Discovery
- 3.1.3. Drug Production
- 3.2. Water and Environmental Agencies
- 3.3. Food and Beverages
- 3.4. Other End-user Industries
-
3.1. Pharmaceuticals
Chromatography Resins Market Segmentation By Geography
-
1. Asia Pacific
- 1.1. China
- 1.2. India
- 1.3. Japan
- 1.4. Rest of Asia Pacific
-
2. North America
- 2.1. United States
- 2.2. Canada
- 2.3. Mexico
-
3. Europe
- 3.1. Germany
- 3.2. United Kingdom
- 3.3. Italy
- 3.4. France
- 3.5. Switzerland
- 3.6. Rest of Europe
-
4. Rest of the World
- 4.1. South America
- 4.2. Middle East and Africa
Chromatography Resins Market Regional Market Share
Geographic Coverage of Chromatography Resins Market
Chromatography Resins Market REPORT HIGHLIGHTS
| Aspects | Details |
|---|---|
| Study Period | 2020-2034 |
| Base Year | 2025 |
| Estimated Year | 2026 |
| Forecast Period | 2026-2034 |
| Historical Period | 2020-2025 |
| Growth Rate | CAGR of > 7.00% from 2020-2034 |
| Segmentation |
|
Table of Contents
- 1. Introduction
- 1.1. Research Scope
- 1.2. Market Segmentation
- 1.3. Research Objective
- 1.4. Definitions and Assumptions
- 2. Executive Summary
- 2.1. Market Snapshot
- 3. Market Dynamics
- 3.1. Market Drivers
- 3.2. Market Restrains
- 3.3. Market Trends
- 3.4. Market Opportunities
- 4. Market Factor Analysis
- 4.1. Porters Five Forces
- 4.1.1. Bargaining Power of Suppliers
- 4.1.2. Bargaining Power of Buyers
- 4.1.3. Threat of New Entrants
- 4.1.4. Threat of Substitutes
- 4.1.5. Competitive Rivalry
- 4.2. PESTEL analysis
- 4.3. BCG Analysis
- 4.3.1. Stars (High Growth, High Market Share)
- 4.3.2. Cash Cows (Low Growth, High Market Share)
- 4.3.3. Question Mark (High Growth, Low Market Share)
- 4.3.4. Dogs (Low Growth, Low Market Share)
- 4.4. Ansoff Matrix Analysis
- 4.5. Supply Chain Analysis
- 4.6. Regulatory Landscape
- 4.7. Current Market Potential and Opportunity Assessment (TAM–SAM–SOM Framework)
- 4.8. PMV Analyst Note
- 4.1. Porters Five Forces
- 5. Market Analysis, Insights and Forecast 2021-2033
- 5.1. Market Analysis, Insights and Forecast - by Origin
- 5.1.1. Natural-based
- 5.1.1.1. Agarose
- 5.1.1.2. Dextran
- 5.1.2. Synthetic-based
- 5.1.2.1. Silica Gel
- 5.1.2.2. Aluminum Oxide
- 5.1.2.3. Polystyrene
- 5.1.2.4. Other Synthetic-based Resins
- 5.1.1. Natural-based
- 5.2. Market Analysis, Insights and Forecast - by Technology
- 5.2.1. Ion Exchange Chromatography Resins
- 5.2.2. Affinity Chromatography Resins
- 5.2.3. Size Exclusion Chromatography Resins
- 5.2.4. Hydrophobic Interaction Chromatography Resins
- 5.2.5. Other Technologies
- 5.3. Market Analysis, Insights and Forecast - by End-user Industry
- 5.3.1. Pharmaceuticals
- 5.3.1.1. Biotechnology
- 5.3.1.2. Drug Discovery
- 5.3.1.3. Drug Production
- 5.3.2. Water and Environmental Agencies
- 5.3.3. Food and Beverages
- 5.3.4. Other End-user Industries
- 5.3.1. Pharmaceuticals
- 5.4. Market Analysis, Insights and Forecast - by Region
- 5.4.1. Asia Pacific
- 5.4.2. North America
- 5.4.3. Europe
- 5.4.4. Rest of the World
- 5.1. Market Analysis, Insights and Forecast - by Origin
- 6. Global Chromatography Resins Market Analysis, Insights and Forecast, 2021-2033
- 6.1. Market Analysis, Insights and Forecast - by Origin
- 6.1.1. Natural-based
- 6.1.1.1. Agarose
- 6.1.1.2. Dextran
- 6.1.2. Synthetic-based
- 6.1.2.1. Silica Gel
- 6.1.2.2. Aluminum Oxide
- 6.1.2.3. Polystyrene
- 6.1.2.4. Other Synthetic-based Resins
- 6.1.1. Natural-based
- 6.2. Market Analysis, Insights and Forecast - by Technology
- 6.2.1. Ion Exchange Chromatography Resins
- 6.2.2. Affinity Chromatography Resins
- 6.2.3. Size Exclusion Chromatography Resins
- 6.2.4. Hydrophobic Interaction Chromatography Resins
- 6.2.5. Other Technologies
- 6.3. Market Analysis, Insights and Forecast - by End-user Industry
- 6.3.1. Pharmaceuticals
- 6.3.1.1. Biotechnology
- 6.3.1.2. Drug Discovery
- 6.3.1.3. Drug Production
- 6.3.2. Water and Environmental Agencies
- 6.3.3. Food and Beverages
- 6.3.4. Other End-user Industries
- 6.3.1. Pharmaceuticals
- 6.1. Market Analysis, Insights and Forecast - by Origin
- 7. Asia Pacific Chromatography Resins Market Analysis, Insights and Forecast, 2020-2032
- 7.1. Market Analysis, Insights and Forecast - by Origin
- 7.1.1. Natural-based
- 7.1.1.1. Agarose
- 7.1.1.2. Dextran
- 7.1.2. Synthetic-based
- 7.1.2.1. Silica Gel
- 7.1.2.2. Aluminum Oxide
- 7.1.2.3. Polystyrene
- 7.1.2.4. Other Synthetic-based Resins
- 7.1.1. Natural-based
- 7.2. Market Analysis, Insights and Forecast - by Technology
- 7.2.1. Ion Exchange Chromatography Resins
- 7.2.2. Affinity Chromatography Resins
- 7.2.3. Size Exclusion Chromatography Resins
- 7.2.4. Hydrophobic Interaction Chromatography Resins
- 7.2.5. Other Technologies
- 7.3. Market Analysis, Insights and Forecast - by End-user Industry
- 7.3.1. Pharmaceuticals
- 7.3.1.1. Biotechnology
- 7.3.1.2. Drug Discovery
- 7.3.1.3. Drug Production
- 7.3.2. Water and Environmental Agencies
- 7.3.3. Food and Beverages
- 7.3.4. Other End-user Industries
- 7.3.1. Pharmaceuticals
- 7.1. Market Analysis, Insights and Forecast - by Origin
- 8. North America Chromatography Resins Market Analysis, Insights and Forecast, 2020-2032
- 8.1. Market Analysis, Insights and Forecast - by Origin
- 8.1.1. Natural-based
- 8.1.1.1. Agarose
- 8.1.1.2. Dextran
- 8.1.2. Synthetic-based
- 8.1.2.1. Silica Gel
- 8.1.2.2. Aluminum Oxide
- 8.1.2.3. Polystyrene
- 8.1.2.4. Other Synthetic-based Resins
- 8.1.1. Natural-based
- 8.2. Market Analysis, Insights and Forecast - by Technology
- 8.2.1. Ion Exchange Chromatography Resins
- 8.2.2. Affinity Chromatography Resins
- 8.2.3. Size Exclusion Chromatography Resins
- 8.2.4. Hydrophobic Interaction Chromatography Resins
- 8.2.5. Other Technologies
- 8.3. Market Analysis, Insights and Forecast - by End-user Industry
- 8.3.1. Pharmaceuticals
- 8.3.1.1. Biotechnology
- 8.3.1.2. Drug Discovery
- 8.3.1.3. Drug Production
- 8.3.2. Water and Environmental Agencies
- 8.3.3. Food and Beverages
- 8.3.4. Other End-user Industries
- 8.3.1. Pharmaceuticals
- 8.1. Market Analysis, Insights and Forecast - by Origin
- 9. Europe Chromatography Resins Market Analysis, Insights and Forecast, 2020-2032
- 9.1. Market Analysis, Insights and Forecast - by Origin
- 9.1.1. Natural-based
- 9.1.1.1. Agarose
- 9.1.1.2. Dextran
- 9.1.2. Synthetic-based
- 9.1.2.1. Silica Gel
- 9.1.2.2. Aluminum Oxide
- 9.1.2.3. Polystyrene
- 9.1.2.4. Other Synthetic-based Resins
- 9.1.1. Natural-based
- 9.2. Market Analysis, Insights and Forecast - by Technology
- 9.2.1. Ion Exchange Chromatography Resins
- 9.2.2. Affinity Chromatography Resins
- 9.2.3. Size Exclusion Chromatography Resins
- 9.2.4. Hydrophobic Interaction Chromatography Resins
- 9.2.5. Other Technologies
- 9.3. Market Analysis, Insights and Forecast - by End-user Industry
- 9.3.1. Pharmaceuticals
- 9.3.1.1. Biotechnology
- 9.3.1.2. Drug Discovery
- 9.3.1.3. Drug Production
- 9.3.2. Water and Environmental Agencies
- 9.3.3. Food and Beverages
- 9.3.4. Other End-user Industries
- 9.3.1. Pharmaceuticals
- 9.1. Market Analysis, Insights and Forecast - by Origin
- 10. Rest of the World Chromatography Resins Market Analysis, Insights and Forecast, 2020-2032
- 10.1. Market Analysis, Insights and Forecast - by Origin
- 10.1.1. Natural-based
- 10.1.1.1. Agarose
- 10.1.1.2. Dextran
- 10.1.2. Synthetic-based
- 10.1.2.1. Silica Gel
- 10.1.2.2. Aluminum Oxide
- 10.1.2.3. Polystyrene
- 10.1.2.4. Other Synthetic-based Resins
- 10.1.1. Natural-based
- 10.2. Market Analysis, Insights and Forecast - by Technology
- 10.2.1. Ion Exchange Chromatography Resins
- 10.2.2. Affinity Chromatography Resins
- 10.2.3. Size Exclusion Chromatography Resins
- 10.2.4. Hydrophobic Interaction Chromatography Resins
- 10.2.5. Other Technologies
- 10.3. Market Analysis, Insights and Forecast - by End-user Industry
- 10.3.1. Pharmaceuticals
- 10.3.1.1. Biotechnology
- 10.3.1.2. Drug Discovery
- 10.3.1.3. Drug Production
- 10.3.2. Water and Environmental Agencies
- 10.3.3. Food and Beverages
- 10.3.4. Other End-user Industries
- 10.3.1. Pharmaceuticals
- 10.1. Market Analysis, Insights and Forecast - by Origin
- 11. Competitive Analysis
- 11.1. Company Profiles
- 11.1.1 Repligen Corporation
- 11.1.1.1. Company Overview
- 11.1.1.2. Products
- 11.1.1.3. Company Financials
- 11.1.1.4. SWOT Analysis
- 11.1.2 General Electric
- 11.1.2.1. Company Overview
- 11.1.2.2. Products
- 11.1.2.3. Company Financials
- 11.1.2.4. SWOT Analysis
- 11.1.3 Bio-Rad Laboratories Inc
- 11.1.3.1. Company Overview
- 11.1.3.2. Products
- 11.1.3.3. Company Financials
- 11.1.3.4. SWOT Analysis
- 11.1.4 Merck KGaA
- 11.1.4.1. Company Overview
- 11.1.4.2. Products
- 11.1.4.3. Company Financials
- 11.1.4.4. SWOT Analysis
- 11.1.5 Mitsubishi Chemical Corporation
- 11.1.5.1. Company Overview
- 11.1.5.2. Products
- 11.1.5.3. Company Financials
- 11.1.5.4. SWOT Analysis
- 11.1.6 Dupont
- 11.1.6.1. Company Overview
- 11.1.6.2. Products
- 11.1.6.3. Company Financials
- 11.1.6.4. SWOT Analysis
- 11.1.7 Perkinelmer Inc
- 11.1.7.1. Company Overview
- 11.1.7.2. Products
- 11.1.7.3. Company Financials
- 11.1.7.4. SWOT Analysis
- 11.1.8 Pall Corporation
- 11.1.8.1. Company Overview
- 11.1.8.2. Products
- 11.1.8.3. Company Financials
- 11.1.8.4. SWOT Analysis
- 11.1.9 Tosoh Bioscience LLC*List Not Exhaustive
- 11.1.9.1. Company Overview
- 11.1.9.2. Products
- 11.1.9.3. Company Financials
- 11.1.9.4. SWOT Analysis
- 11.1.10 Purolite
- 11.1.10.1. Company Overview
- 11.1.10.2. Products
- 11.1.10.3. Company Financials
- 11.1.10.4. SWOT Analysis
- 11.1.11 Agilient Technologies
- 11.1.11.1. Company Overview
- 11.1.11.2. Products
- 11.1.11.3. Company Financials
- 11.1.11.4. SWOT Analysis
- 11.1.12 Avantor Inc
- 11.1.12.1. Company Overview
- 11.1.12.2. Products
- 11.1.12.3. Company Financials
- 11.1.12.4. SWOT Analysis
- 11.1.13 Thermo Fisher Scientific
- 11.1.13.1. Company Overview
- 11.1.13.2. Products
- 11.1.13.3. Company Financials
- 11.1.13.4. SWOT Analysis
- 11.1.1 Repligen Corporation
- 11.2. Market Entropy
- 11.2.1 Company's Key Areas Served
- 11.2.2 Recent Developments
- 11.3. Company Market Share Analysis 2025
- 11.3.1 Top 5 Companies Market Share Analysis
- 11.3.2 Top 3 Companies Market Share Analysis
- 11.4. List of Potential Customers
- 12. Research Methodology
List of Figures
- Figure 1: Global Chromatography Resins Market Revenue Breakdown (Million, %) by Region 2025 & 2033
- Figure 2: Global Chromatography Resins Market Volume Breakdown (K Tons, %) by Region 2025 & 2033
- Figure 3: Asia Pacific Chromatography Resins Market Revenue (Million), by Origin 2025 & 2033
- Figure 4: Asia Pacific Chromatography Resins Market Volume (K Tons), by Origin 2025 & 2033
- Figure 5: Asia Pacific Chromatography Resins Market Revenue Share (%), by Origin 2025 & 2033
- Figure 6: Asia Pacific Chromatography Resins Market Volume Share (%), by Origin 2025 & 2033
- Figure 7: Asia Pacific Chromatography Resins Market Revenue (Million), by Technology 2025 & 2033
- Figure 8: Asia Pacific Chromatography Resins Market Volume (K Tons), by Technology 2025 & 2033
- Figure 9: Asia Pacific Chromatography Resins Market Revenue Share (%), by Technology 2025 & 2033
- Figure 10: Asia Pacific Chromatography Resins Market Volume Share (%), by Technology 2025 & 2033
- Figure 11: Asia Pacific Chromatography Resins Market Revenue (Million), by End-user Industry 2025 & 2033
- Figure 12: Asia Pacific Chromatography Resins Market Volume (K Tons), by End-user Industry 2025 & 2033
- Figure 13: Asia Pacific Chromatography Resins Market Revenue Share (%), by End-user Industry 2025 & 2033
- Figure 14: Asia Pacific Chromatography Resins Market Volume Share (%), by End-user Industry 2025 & 2033
- Figure 15: Asia Pacific Chromatography Resins Market Revenue (Million), by Country 2025 & 2033
- Figure 16: Asia Pacific Chromatography Resins Market Volume (K Tons), by Country 2025 & 2033
- Figure 17: Asia Pacific Chromatography Resins Market Revenue Share (%), by Country 2025 & 2033
- Figure 18: Asia Pacific Chromatography Resins Market Volume Share (%), by Country 2025 & 2033
- Figure 19: North America Chromatography Resins Market Revenue (Million), by Origin 2025 & 2033
- Figure 20: North America Chromatography Resins Market Volume (K Tons), by Origin 2025 & 2033
- Figure 21: North America Chromatography Resins Market Revenue Share (%), by Origin 2025 & 2033
- Figure 22: North America Chromatography Resins Market Volume Share (%), by Origin 2025 & 2033
- Figure 23: North America Chromatography Resins Market Revenue (Million), by Technology 2025 & 2033
- Figure 24: North America Chromatography Resins Market Volume (K Tons), by Technology 2025 & 2033
- Figure 25: North America Chromatography Resins Market Revenue Share (%), by Technology 2025 & 2033
- Figure 26: North America Chromatography Resins Market Volume Share (%), by Technology 2025 & 2033
- Figure 27: North America Chromatography Resins Market Revenue (Million), by End-user Industry 2025 & 2033
- Figure 28: North America Chromatography Resins Market Volume (K Tons), by End-user Industry 2025 & 2033
- Figure 29: North America Chromatography Resins Market Revenue Share (%), by End-user Industry 2025 & 2033
- Figure 30: North America Chromatography Resins Market Volume Share (%), by End-user Industry 2025 & 2033
- Figure 31: North America Chromatography Resins Market Revenue (Million), by Country 2025 & 2033
- Figure 32: North America Chromatography Resins Market Volume (K Tons), by Country 2025 & 2033
- Figure 33: North America Chromatography Resins Market Revenue Share (%), by Country 2025 & 2033
- Figure 34: North America Chromatography Resins Market Volume Share (%), by Country 2025 & 2033
- Figure 35: Europe Chromatography Resins Market Revenue (Million), by Origin 2025 & 2033
- Figure 36: Europe Chromatography Resins Market Volume (K Tons), by Origin 2025 & 2033
- Figure 37: Europe Chromatography Resins Market Revenue Share (%), by Origin 2025 & 2033
- Figure 38: Europe Chromatography Resins Market Volume Share (%), by Origin 2025 & 2033
- Figure 39: Europe Chromatography Resins Market Revenue (Million), by Technology 2025 & 2033
- Figure 40: Europe Chromatography Resins Market Volume (K Tons), by Technology 2025 & 2033
- Figure 41: Europe Chromatography Resins Market Revenue Share (%), by Technology 2025 & 2033
- Figure 42: Europe Chromatography Resins Market Volume Share (%), by Technology 2025 & 2033
- Figure 43: Europe Chromatography Resins Market Revenue (Million), by End-user Industry 2025 & 2033
- Figure 44: Europe Chromatography Resins Market Volume (K Tons), by End-user Industry 2025 & 2033
- Figure 45: Europe Chromatography Resins Market Revenue Share (%), by End-user Industry 2025 & 2033
- Figure 46: Europe Chromatography Resins Market Volume Share (%), by End-user Industry 2025 & 2033
- Figure 47: Europe Chromatography Resins Market Revenue (Million), by Country 2025 & 2033
- Figure 48: Europe Chromatography Resins Market Volume (K Tons), by Country 2025 & 2033
- Figure 49: Europe Chromatography Resins Market Revenue Share (%), by Country 2025 & 2033
- Figure 50: Europe Chromatography Resins Market Volume Share (%), by Country 2025 & 2033
- Figure 51: Rest of the World Chromatography Resins Market Revenue (Million), by Origin 2025 & 2033
- Figure 52: Rest of the World Chromatography Resins Market Volume (K Tons), by Origin 2025 & 2033
- Figure 53: Rest of the World Chromatography Resins Market Revenue Share (%), by Origin 2025 & 2033
- Figure 54: Rest of the World Chromatography Resins Market Volume Share (%), by Origin 2025 & 2033
- Figure 55: Rest of the World Chromatography Resins Market Revenue (Million), by Technology 2025 & 2033
- Figure 56: Rest of the World Chromatography Resins Market Volume (K Tons), by Technology 2025 & 2033
- Figure 57: Rest of the World Chromatography Resins Market Revenue Share (%), by Technology 2025 & 2033
- Figure 58: Rest of the World Chromatography Resins Market Volume Share (%), by Technology 2025 & 2033
- Figure 59: Rest of the World Chromatography Resins Market Revenue (Million), by End-user Industry 2025 & 2033
- Figure 60: Rest of the World Chromatography Resins Market Volume (K Tons), by End-user Industry 2025 & 2033
- Figure 61: Rest of the World Chromatography Resins Market Revenue Share (%), by End-user Industry 2025 & 2033
- Figure 62: Rest of the World Chromatography Resins Market Volume Share (%), by End-user Industry 2025 & 2033
- Figure 63: Rest of the World Chromatography Resins Market Revenue (Million), by Country 2025 & 2033
- Figure 64: Rest of the World Chromatography Resins Market Volume (K Tons), by Country 2025 & 2033
- Figure 65: Rest of the World Chromatography Resins Market Revenue Share (%), by Country 2025 & 2033
- Figure 66: Rest of the World Chromatography Resins Market Volume Share (%), by Country 2025 & 2033
List of Tables
- Table 1: Global Chromatography Resins Market Revenue Million Forecast, by Origin 2020 & 2033
- Table 2: Global Chromatography Resins Market Volume K Tons Forecast, by Origin 2020 & 2033
- Table 3: Global Chromatography Resins Market Revenue Million Forecast, by Technology 2020 & 2033
- Table 4: Global Chromatography Resins Market Volume K Tons Forecast, by Technology 2020 & 2033
- Table 5: Global Chromatography Resins Market Revenue Million Forecast, by End-user Industry 2020 & 2033
- Table 6: Global Chromatography Resins Market Volume K Tons Forecast, by End-user Industry 2020 & 2033
- Table 7: Global Chromatography Resins Market Revenue Million Forecast, by Region 2020 & 2033
- Table 8: Global Chromatography Resins Market Volume K Tons Forecast, by Region 2020 & 2033
- Table 9: Global Chromatography Resins Market Revenue Million Forecast, by Origin 2020 & 2033
- Table 10: Global Chromatography Resins Market Volume K Tons Forecast, by Origin 2020 & 2033
- Table 11: Global Chromatography Resins Market Revenue Million Forecast, by Technology 2020 & 2033
- Table 12: Global Chromatography Resins Market Volume K Tons Forecast, by Technology 2020 & 2033
- Table 13: Global Chromatography Resins Market Revenue Million Forecast, by End-user Industry 2020 & 2033
- Table 14: Global Chromatography Resins Market Volume K Tons Forecast, by End-user Industry 2020 & 2033
- Table 15: Global Chromatography Resins Market Revenue Million Forecast, by Country 2020 & 2033
- Table 16: Global Chromatography Resins Market Volume K Tons Forecast, by Country 2020 & 2033
- Table 17: China Chromatography Resins Market Revenue (Million) Forecast, by Application 2020 & 2033
- Table 18: China Chromatography Resins Market Volume (K Tons) Forecast, by Application 2020 & 2033
- Table 19: India Chromatography Resins Market Revenue (Million) Forecast, by Application 2020 & 2033
- Table 20: India Chromatography Resins Market Volume (K Tons) Forecast, by Application 2020 & 2033
- Table 21: Japan Chromatography Resins Market Revenue (Million) Forecast, by Application 2020 & 2033
- Table 22: Japan Chromatography Resins Market Volume (K Tons) Forecast, by Application 2020 & 2033
- Table 23: Rest of Asia Pacific Chromatography Resins Market Revenue (Million) Forecast, by Application 2020 & 2033
- Table 24: Rest of Asia Pacific Chromatography Resins Market Volume (K Tons) Forecast, by Application 2020 & 2033
- Table 25: Global Chromatography Resins Market Revenue Million Forecast, by Origin 2020 & 2033
- Table 26: Global Chromatography Resins Market Volume K Tons Forecast, by Origin 2020 & 2033
- Table 27: Global Chromatography Resins Market Revenue Million Forecast, by Technology 2020 & 2033
- Table 28: Global Chromatography Resins Market Volume K Tons Forecast, by Technology 2020 & 2033
- Table 29: Global Chromatography Resins Market Revenue Million Forecast, by End-user Industry 2020 & 2033
- Table 30: Global Chromatography Resins Market Volume K Tons Forecast, by End-user Industry 2020 & 2033
- Table 31: Global Chromatography Resins Market Revenue Million Forecast, by Country 2020 & 2033
- Table 32: Global Chromatography Resins Market Volume K Tons Forecast, by Country 2020 & 2033
- Table 33: United States Chromatography Resins Market Revenue (Million) Forecast, by Application 2020 & 2033
- Table 34: United States Chromatography Resins Market Volume (K Tons) Forecast, by Application 2020 & 2033
- Table 35: Canada Chromatography Resins Market Revenue (Million) Forecast, by Application 2020 & 2033
- Table 36: Canada Chromatography Resins Market Volume (K Tons) Forecast, by Application 2020 & 2033
- Table 37: Mexico Chromatography Resins Market Revenue (Million) Forecast, by Application 2020 & 2033
- Table 38: Mexico Chromatography Resins Market Volume (K Tons) Forecast, by Application 2020 & 2033
- Table 39: Global Chromatography Resins Market Revenue Million Forecast, by Origin 2020 & 2033
- Table 40: Global Chromatography Resins Market Volume K Tons Forecast, by Origin 2020 & 2033
- Table 41: Global Chromatography Resins Market Revenue Million Forecast, by Technology 2020 & 2033
- Table 42: Global Chromatography Resins Market Volume K Tons Forecast, by Technology 2020 & 2033
- Table 43: Global Chromatography Resins Market Revenue Million Forecast, by End-user Industry 2020 & 2033
- Table 44: Global Chromatography Resins Market Volume K Tons Forecast, by End-user Industry 2020 & 2033
- Table 45: Global Chromatography Resins Market Revenue Million Forecast, by Country 2020 & 2033
- Table 46: Global Chromatography Resins Market Volume K Tons Forecast, by Country 2020 & 2033
- Table 47: Germany Chromatography Resins Market Revenue (Million) Forecast, by Application 2020 & 2033
- Table 48: Germany Chromatography Resins Market Volume (K Tons) Forecast, by Application 2020 & 2033
- Table 49: United Kingdom Chromatography Resins Market Revenue (Million) Forecast, by Application 2020 & 2033
- Table 50: United Kingdom Chromatography Resins Market Volume (K Tons) Forecast, by Application 2020 & 2033
- Table 51: Italy Chromatography Resins Market Revenue (Million) Forecast, by Application 2020 & 2033
- Table 52: Italy Chromatography Resins Market Volume (K Tons) Forecast, by Application 2020 & 2033
- Table 53: France Chromatography Resins Market Revenue (Million) Forecast, by Application 2020 & 2033
- Table 54: France Chromatography Resins Market Volume (K Tons) Forecast, by Application 2020 & 2033
- Table 55: Switzerland Chromatography Resins Market Revenue (Million) Forecast, by Application 2020 & 2033
- Table 56: Switzerland Chromatography Resins Market Volume (K Tons) Forecast, by Application 2020 & 2033
- Table 57: Rest of Europe Chromatography Resins Market Revenue (Million) Forecast, by Application 2020 & 2033
- Table 58: Rest of Europe Chromatography Resins Market Volume (K Tons) Forecast, by Application 2020 & 2033
- Table 59: Global Chromatography Resins Market Revenue Million Forecast, by Origin 2020 & 2033
- Table 60: Global Chromatography Resins Market Volume K Tons Forecast, by Origin 2020 & 2033
- Table 61: Global Chromatography Resins Market Revenue Million Forecast, by Technology 2020 & 2033
- Table 62: Global Chromatography Resins Market Volume K Tons Forecast, by Technology 2020 & 2033
- Table 63: Global Chromatography Resins Market Revenue Million Forecast, by End-user Industry 2020 & 2033
- Table 64: Global Chromatography Resins Market Volume K Tons Forecast, by End-user Industry 2020 & 2033
- Table 65: Global Chromatography Resins Market Revenue Million Forecast, by Country 2020 & 2033
- Table 66: Global Chromatography Resins Market Volume K Tons Forecast, by Country 2020 & 2033
- Table 67: South America Chromatography Resins Market Revenue (Million) Forecast, by Application 2020 & 2033
- Table 68: South America Chromatography Resins Market Volume (K Tons) Forecast, by Application 2020 & 2033
- Table 69: Middle East and Africa Chromatography Resins Market Revenue (Million) Forecast, by Application 2020 & 2033
- Table 70: Middle East and Africa Chromatography Resins Market Volume (K Tons) Forecast, by Application 2020 & 2033
Frequently Asked Questions
1. What is the projected Compound Annual Growth Rate (CAGR) of the Chromatography Resins Market?
The projected CAGR is approximately > 7.00%.
2. Which companies are prominent players in the Chromatography Resins Market?
Key companies in the market include Repligen Corporation, General Electric, Bio-Rad Laboratories Inc, Merck KGaA, Mitsubishi Chemical Corporation, Dupont, Perkinelmer Inc, Pall Corporation, Tosoh Bioscience LLC*List Not Exhaustive, Purolite, Agilient Technologies, Avantor Inc, Thermo Fisher Scientific.
3. What are the main segments of the Chromatography Resins Market?
The market segments include Origin, Technology, End-user Industry.
4. Can you provide details about the market size?
The market size is estimated to be USD 2480 Million as of 2022.
5. What are some drivers contributing to market growth?
; Rising Demand from the Pharmaceutical Sector; Technological Advancements in Chromatography Resins; Increasing Importance of Chromatography Tests in Drug Approvals.
6. What are the notable trends driving market growth?
Increasing Demand from Pharmaceutical Sector.
7. Are there any restraints impacting market growth?
; Lack of Professional Expertise in the Emerging Countries; High Costs vs. Productivity of Chromatography Systems.
8. Can you provide examples of recent developments in the market?
In 2021, Repligen Corporation acquired Pall Corporation's Chromatography and Filtration business. In 2022, Thermo Fisher Scientific launched a new line of chromatography resins designed for high-throughput biopharmaceutical purification.
9. What pricing options are available for accessing the report?
Pricing options include single-user, multi-user, and enterprise licenses priced at USD 4750, USD 5250, and USD 8750 respectively.
10. Is the market size provided in terms of value or volume?
The market size is provided in terms of value, measured in Million and volume, measured in K Tons.
11. Are there any specific market keywords associated with the report?
Yes, the market keyword associated with the report is "Chromatography Resins Market," which aids in identifying and referencing the specific market segment covered.
12. How do I determine which pricing option suits my needs best?
The pricing options vary based on user requirements and access needs. Individual users may opt for single-user licenses, while businesses requiring broader access may choose multi-user or enterprise licenses for cost-effective access to the report.
13. Are there any additional resources or data provided in the Chromatography Resins Market report?
While the report offers comprehensive insights, it's advisable to review the specific contents or supplementary materials provided to ascertain if additional resources or data are available.
14. How can I stay updated on further developments or reports in the Chromatography Resins Market?
To stay informed about further developments, trends, and reports in the Chromatography Resins Market, consider subscribing to industry newsletters, following relevant companies and organizations, or regularly checking reputable industry news sources and publications.
Methodology
Step 1 - Identification of Relevant Samples Size from Population Database


Step 2 - Approaches for Defining Global Market Size (Value, Volume* & Price*)

Note*: In applicable scenarios
Step 3 - Data Sources
Primary Research
- Web Analytics
- Survey Reports
- Research Institute
- Latest Research Reports
- Opinion Leaders
Secondary Research
- Annual Reports
- White Paper
- Latest Press Release
- Industry Association
- Paid Database
- Investor Presentations

Step 4 - Data Triangulation
Involves using different sources of information in order to increase the validity of a study
These sources are likely to be stakeholders in a program - participants, other researchers, program staff, other community members, and so on.
Then we put all data in single framework & apply various statistical tools to find out the dynamic on the market.
During the analysis stage, feedback from the stakeholder groups would be compared to determine areas of agreement as well as areas of divergence

