Deep Dive into Chain Saw Industry: Comprehensive Growth Analysis 2025-2033

Chain Saw Industry by Production Analysis, by Consumption Analysis, by Import Market Analysis (Value & Volume), by Export Market Analysis (Value & Volume), by Price Trend Analysis, by North America (United States, Canada, Mexico), by South America (Brazil, Argentina, Rest of South America), by Europe (United Kingdom, Germany, France, Italy, Spain, Russia, Benelux, Nordics, Rest of Europe), by Middle East & Africa (Turkey, Israel, GCC, North Africa, South Africa, Rest of Middle East & Africa), by Asia Pacific (China, India, Japan, South Korea, ASEAN, Oceania, Rest of Asia Pacific) Forecast 2025-2033

Jun 30 2025
Base Year: 2024

180 Pages
Main Logo

Deep Dive into Chain Saw Industry: Comprehensive Growth Analysis 2025-2033


Home
Industries
Agriculture
sponsor image

Tailored for you

  • In-depth Analysis Tailored to Specified Regions or Segments
  • Company Profiles Customized to User Preferences
  • Comprehensive Insights Focused on Specific Segments or Regions
  • Customized Evaluation of Competitive Landscape to Meet Your Needs
  • Tailored Customization to Address Other Specific Requirements
Ask for customization


Key Insights

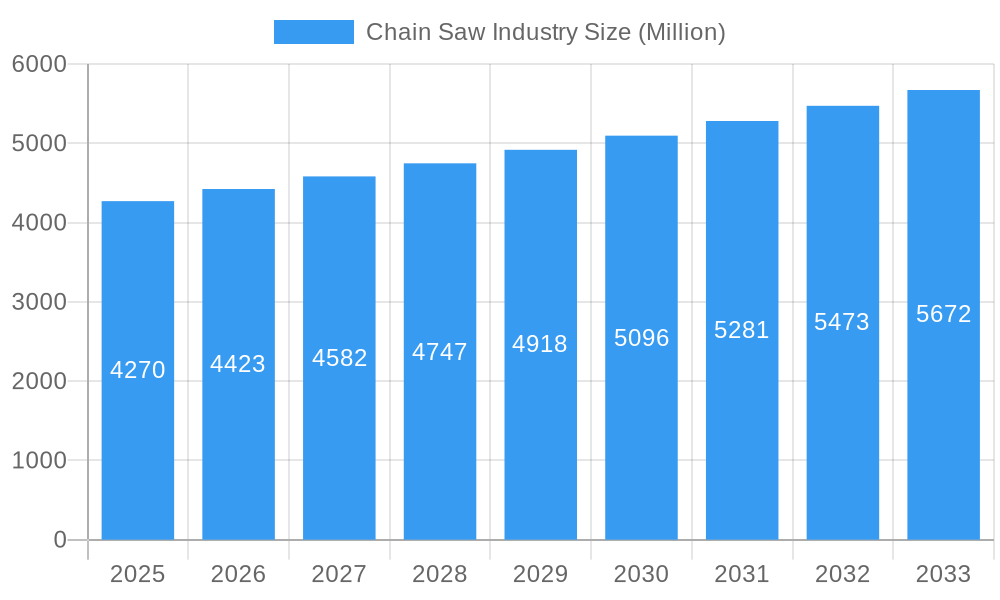
The global chainsaw market, valued at $4.27 billion in 2025, is projected to experience steady growth, driven by increasing demand from both residential and industrial sectors. The 3.50% CAGR indicates a consistent expansion over the forecast period (2025-2033). Key drivers include the rising need for efficient forestry management, landscaping projects, and agricultural activities. Growth in construction and infrastructure development further fuels this demand, particularly for larger, more powerful chainsaws in industrial applications. The market is segmented by power source (gas-powered, electric-powered, battery-powered, and other) and application (residential and industrial). While gas-powered chainsaws currently dominate due to their power and performance, battery-powered models are gaining traction owing to increased environmental awareness and technological advancements leading to improved battery life and power output. This shift is expected to continue, impacting the market share of different product types over the forecast period. Competitive landscape analysis reveals key players such as Stihl, Husqvarna, and Toro are heavily invested in research and development, constantly innovating to meet evolving market needs and preferences. Geographic expansion, particularly in developing economies experiencing rapid infrastructure growth, presents substantial opportunities for market expansion. However, stringent emission regulations and safety concerns are potential restraints that manufacturers must address.
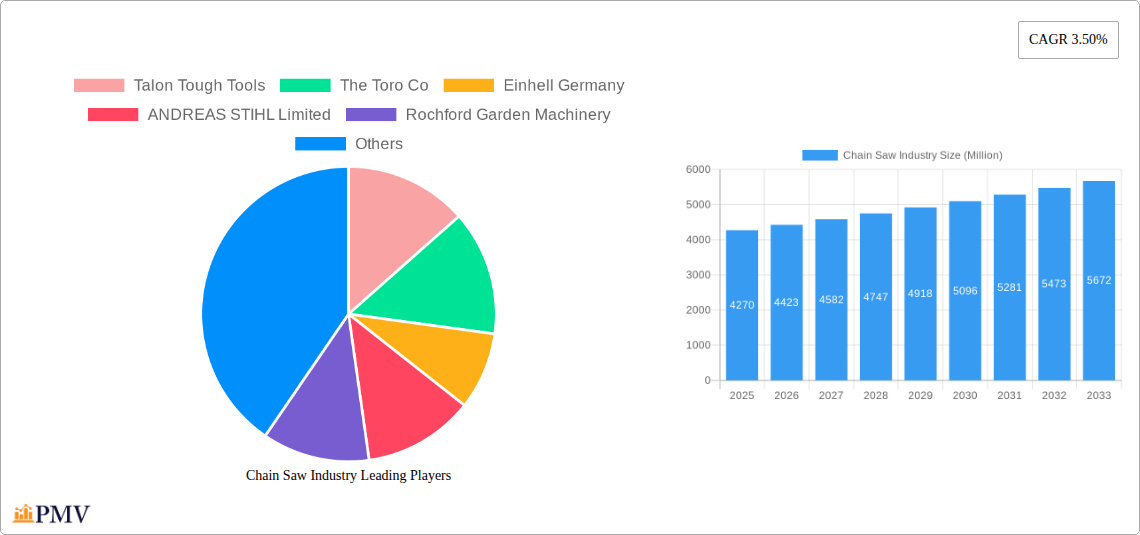
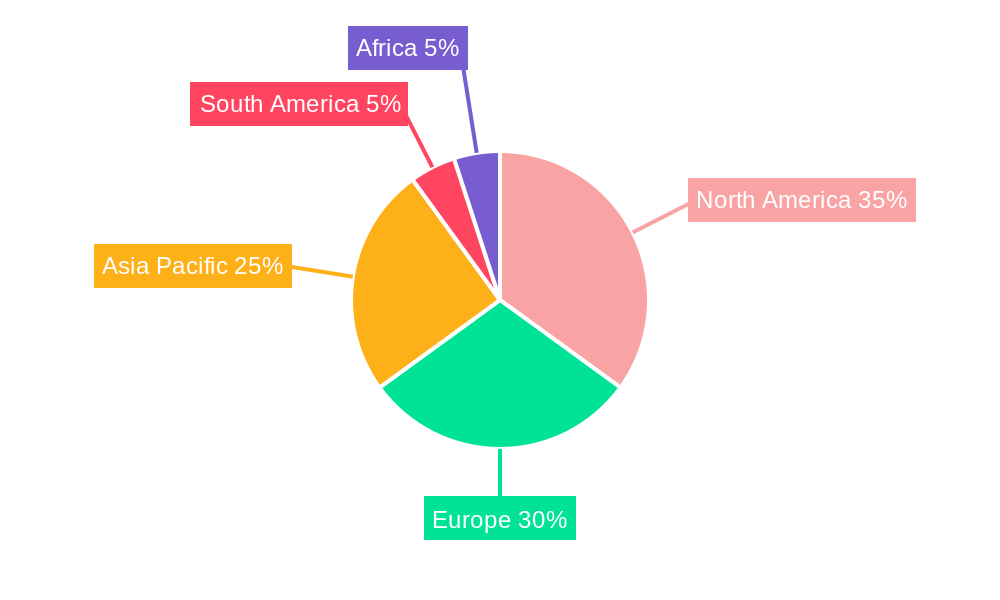
The forecast for the chainsaw market demonstrates a positive outlook for the next decade, with consistent growth anticipated across various segments and regions. While North America and Europe currently hold significant market share due to established forestry and landscaping industries, the Asia-Pacific region is expected to witness rapid growth owing to increasing urbanization and infrastructural development. The market's trajectory is significantly influenced by technological advancements, changing consumer preferences, and environmental regulations. Manufacturers are focusing on producing more fuel-efficient, quieter, and environmentally friendly chainsaws to cater to growing environmental concerns and stricter regulations. This will shape the competitive dynamics and impact the overall market size and segmentation in the coming years.

Chain Saw Industry Research Report - Market Size, Growth & Forecast

Chain Saw Industry Market Report: 2019-2033

This comprehensive report provides a detailed analysis of the global chain saw industry, covering the period from 2019 to 2033. It offers actionable insights into market dynamics, competitive landscapes, technological advancements, and future growth prospects, enabling informed strategic decision-making for industry stakeholders. The report includes detailed segmentation by product type (gas-powered, electric-powered, battery-powered, other) and application (residential, industrial), analyzing market size and growth projections in millions. The base year for this report is 2025, with forecasts extending to 2033.

Chain Saw Industry Market Structure & Competitive Dynamics

The global chain saw market exhibits a moderately concentrated structure, with several major players commanding significant market share. The industry is characterized by intense competition, driven by continuous product innovation, aggressive marketing strategies, and strategic mergers and acquisitions (M&A). Key players like ANDREAS STIHL Limited, Husqvarna AB, and Robert Bosch GmbH hold dominant positions, leveraging their established brand reputation and extensive distribution networks. Smaller players are focusing on niche segments and innovative product offerings to gain a competitive edge.

The regulatory landscape varies across regions, influencing safety standards, emission regulations, and import/export policies. Substitute products, such as pole saws and other pruning tools, exert some competitive pressure, particularly in the residential segment. End-user trends show a growing preference for lightweight, easy-to-use, and environmentally friendly chainsaws, particularly battery-powered models. M&A activities have been relatively modest in recent years, with deal values averaging xx Million annually. Market share concentration is estimated at xx%, indicating a moderately consolidated market. The innovation ecosystem is dynamic, with ongoing R&D efforts focused on improving engine efficiency, reducing noise and emissions, and enhancing safety features.

Chain Saw Industry Industry Trends & Insights

The global chain saw market is experiencing robust growth, driven by increasing demand from both residential and industrial sectors. The Compound Annual Growth Rate (CAGR) during the historical period (2019-2024) is estimated to be xx%, with an anticipated CAGR of xx% during the forecast period (2025-2033). This growth is fueled by several factors, including rising disposable incomes in developing economies, expanding construction and infrastructure projects, and growing popularity of landscaping and gardening activities. Technological advancements, such as the introduction of battery-powered chainsaws with enhanced performance and runtimes, are reshaping the market landscape.

Consumer preferences are shifting towards lighter, quieter, and more environmentally friendly options, particularly battery-powered models. The market penetration of battery-powered chainsaws is steadily increasing, driven by improvements in battery technology and decreasing prices. Competitive dynamics are intensifying, with established players investing heavily in R&D and expanding their product portfolios to cater to evolving consumer demands. The increasing adoption of advanced technologies, such as electronic control systems and improved safety features, is further driving market growth. The overall market size in 2025 is estimated at xx Million, projected to reach xx Million by 2033.

Chain Saw Industry Growth

Dominant Markets & Segments in Chain Saw Industry

The North American region currently dominates the global chain saw market, driven by high consumer spending on outdoor power equipment and a strong residential sector. Within product types, gas-powered chainsaws still hold the largest market share, accounting for approximately xx Million in 2025, primarily due to their higher power output and longer runtimes. However, the battery-powered segment is experiencing the fastest growth, projected to reach xx Million by 2033, driven by advancements in battery technology and consumer preference for environmentally friendly options. The industrial segment continues to be a significant driver of growth, fueled by demand from forestry, construction, and agriculture sectors.

  • Key Drivers for North American Dominance:
    • High disposable incomes.
    • Strong demand for landscaping and gardening services.
    • Extensive retail infrastructure for outdoor power equipment.
    • Favorable regulatory environment.

The residential segment exhibits higher growth due to rising homeownership rates and increasing interest in DIY projects. However, the industrial segment provides a larger overall market value, driven by large-scale projects and professional usage. Further regional analysis reveals significant growth potential in emerging markets such as Asia-Pacific and Latin America.

Chain Saw Industry Product Innovations

Recent innovations in the chain saw industry are primarily focused on enhancing power, efficiency, and user-friendliness while minimizing environmental impact. The introduction of battery-powered chainsaws with comparable performance to gas-powered models, as exemplified by Husqvarna's launch of the T542i XP® and 542i XP®, marks a significant milestone. Other advancements include the incorporation of advanced electronic control systems, improved safety features, and lighter-weight designs. These innovations are designed to cater to the growing demand for quieter, cleaner, and more efficient chainsaws.

Report Segmentation & Scope

This report segments the chain saw market by product type and application.

Product Type:

  • Gas-powered: This segment accounts for the largest market share in 2025 (xx Million) but is projected to experience slower growth compared to battery-powered chainsaws due to environmental concerns.
  • Electric-powered: This segment offers a more eco-friendly alternative but typically lacks the power and runtime of gas-powered models. Market size in 2025 is estimated at xx Million.
  • Battery-powered: This fast-growing segment (xx Million in 2025) is driven by technological advancements and increasing consumer preference for cordless tools.
  • Other Product Types: This category includes specialized chainsaws and attachments. Market size is estimated at xx Million.

Application:

  • Residential: This segment accounts for a significant portion of the market, representing xx Million in 2025, driven by DIY enthusiasts and homeowners.
  • Industrial: This segment, valued at xx Million in 2025, is characterized by higher power requirements and professional usage.

Key Drivers of Chain Saw Industry Growth

Several factors contribute to the growth of the chain saw industry. Technological advancements, particularly in battery technology, are enhancing the performance and usability of battery-powered chainsaws, expanding their market appeal. Economic growth and rising disposable incomes in developing economies are driving demand, especially in the residential segment. Furthermore, the increasing need for efficient forest management and infrastructure development fuels demand in the industrial sector. Supportive government policies and initiatives promoting sustainable forestry practices also positively impact market growth.

Challenges in the Chain Saw Industry Sector

The chain saw industry faces several challenges, including fluctuating raw material prices impacting manufacturing costs, increasing regulatory scrutiny on emissions and safety standards, and intense competition from established and emerging players. Supply chain disruptions can lead to production delays and increased costs. Furthermore, environmental concerns related to gas-powered chainsaws are driving the need for greener alternatives, requiring substantial investments in R&D and manufacturing capabilities.

Leading Players in the Chain Saw Industry Market

  • Talon Tough Tools
  • The Toro Co (https://www.toro.com/)
  • Einhell Germany (https://www.einhell.de/)
  • ANDREAS STIHL Limited (https://www.stihl.com/)
  • Rochford Garden Machinery
  • Robert Bosch GmbH (https://www.bosch.com/)
  • SUMEC Group Corporation
  • AL-KO Kober (https://www.al-ko.com/)
  • STIGA SpA (https://www.stiga.com/)
  • Emak SPA (https://www.emak.it/)
  • Yamabiko Corp (https://www.yamabiko.co.jp/english/)
  • Stanley Black & Decker Inc (https://www.stanleyblackanddecker.com/)
  • Hitachi Ltd (https://www.hitachi.com/en/)
  • Husqvarna AB (https://www.husqvarnagroup.com/)
  • Blount International Inc (https://www.blount.com/)

Key Developments in Chain Saw Industry Sector

  • April 2023: Husqvarna launched the T542i XP® and 542i XP®, battery-powered chainsaws featuring a clutch mechanism, enhancing performance and mimicking the feel of gas-powered models. This launch significantly impacts the market by accelerating the adoption of battery-powered technology.

  • May 2023: Robert Bosch GmbH introduced a new advanced cordless chainsaw, the AdvancedChain 36V-35-40, further strengthening the cordless chainsaw segment's competitiveness. This launch boosts the company's market share and intensifies competition in the battery-powered chainsaw market.

Strategic Chain Saw Industry Market Outlook

The chain saw industry is poised for continued growth, driven by technological innovation and evolving consumer preferences. The increasing demand for battery-powered chainsaws presents significant opportunities for manufacturers to invest in R&D and expand their product portfolios. Strategic partnerships and collaborations will be crucial for navigating the evolving regulatory landscape and supply chain challenges. Companies that focus on sustainability, innovation, and providing superior customer experiences are best positioned to capitalize on future growth opportunities within this dynamic market.

Chain Saw Industry Segmentation

  • 1. Production Analysis
  • 2. Consumption Analysis
  • 3. Import Market Analysis (Value & Volume)
  • 4. Export Market Analysis (Value & Volume)
  • 5. Price Trend Analysis

Chain Saw Industry Segmentation By Geography

  • 1. North America
    • 1.1. United States
    • 1.2. Canada
    • 1.3. Mexico
  • 2. South America
    • 2.1. Brazil
    • 2.2. Argentina
    • 2.3. Rest of South America
  • 3. Europe
    • 3.1. United Kingdom
    • 3.2. Germany
    • 3.3. France
    • 3.4. Italy
    • 3.5. Spain
    • 3.6. Russia
    • 3.7. Benelux
    • 3.8. Nordics
    • 3.9. Rest of Europe
  • 4. Middle East & Africa
    • 4.1. Turkey
    • 4.2. Israel
    • 4.3. GCC
    • 4.4. North Africa
    • 4.5. South Africa
    • 4.6. Rest of Middle East & Africa
  • 5. Asia Pacific
    • 5.1. China
    • 5.2. India
    • 5.3. Japan
    • 5.4. South Korea
    • 5.5. ASEAN
    • 5.6. Oceania
    • 5.7. Rest of Asia Pacific
Chain Saw Industry Regional Share


Chain Saw Industry REPORT HIGHLIGHTS

AspectsDetails
Study Period 2019-2033
Base Year 2024
Estimated Year 2025
Forecast Period2025-2033
Historical Period2019-2024
Growth RateCAGR of 3.50% from 2019-2033
Segmentation
    • By Production Analysis
    • By Consumption Analysis
    • By Import Market Analysis (Value & Volume)
    • By Export Market Analysis (Value & Volume)
    • By Price Trend Analysis
  • By Geography
    • North America
      • United States
      • Canada
      • Mexico
    • South America
      • Brazil
      • Argentina
      • Rest of South America
    • Europe
      • United Kingdom
      • Germany
      • France
      • Italy
      • Spain
      • Russia
      • Benelux
      • Nordics
      • Rest of Europe
    • Middle East & Africa
      • Turkey
      • Israel
      • GCC
      • North Africa
      • South Africa
      • Rest of Middle East & Africa
    • Asia Pacific
      • China
      • India
      • Japan
      • South Korea
      • ASEAN
      • Oceania
      • Rest of Asia Pacific


Table of Contents

  1. 1. Introduction
    • 1.1. Research Scope
    • 1.2. Market Segmentation
    • 1.3. Research Methodology
    • 1.4. Definitions and Assumptions
  2. 2. Executive Summary
    • 2.1. Introduction
  3. 3. Market Dynamics
    • 3.1. Introduction
      • 3.2. Market Drivers
        • 3.2.1. Decreasing Per Capita Arable Land; Increased Demand for Food
      • 3.3. Market Restrains
        • 3.3.1. High Initial Investments; Requirement of Precision Agriculture
      • 3.4. Market Trends
        • 3.4.1. Increasing Deforestation and Demand for Commodities and Shelter
  4. 4. Market Factor Analysis
    • 4.1. Porters Five Forces
    • 4.2. Supply/Value Chain
    • 4.3. PESTEL analysis
    • 4.4. Market Entropy
    • 4.5. Patent/Trademark Analysis
  5. 5. Global Chain Saw Industry Analysis, Insights and Forecast, 2019-2031
    • 5.1. Market Analysis, Insights and Forecast - by Production Analysis
      • 5.2. Market Analysis, Insights and Forecast - by Consumption Analysis
        • 5.3. Market Analysis, Insights and Forecast - by Import Market Analysis (Value & Volume)
          • 5.4. Market Analysis, Insights and Forecast - by Export Market Analysis (Value & Volume)
            • 5.5. Market Analysis, Insights and Forecast - by Price Trend Analysis
              • 5.6. Market Analysis, Insights and Forecast - by Region
                • 5.6.1. North America
                • 5.6.2. South America
                • 5.6.3. Europe
                • 5.6.4. Middle East & Africa
                • 5.6.5. Asia Pacific
            • 6. North America Chain Saw Industry Analysis, Insights and Forecast, 2019-2031
              • 6.1. Market Analysis, Insights and Forecast - by Production Analysis
                • 6.2. Market Analysis, Insights and Forecast - by Consumption Analysis
                  • 6.3. Market Analysis, Insights and Forecast - by Import Market Analysis (Value & Volume)
                    • 6.4. Market Analysis, Insights and Forecast - by Export Market Analysis (Value & Volume)
                      • 6.5. Market Analysis, Insights and Forecast - by Price Trend Analysis
                      • 7. South America Chain Saw Industry Analysis, Insights and Forecast, 2019-2031
                        • 7.1. Market Analysis, Insights and Forecast - by Production Analysis
                          • 7.2. Market Analysis, Insights and Forecast - by Consumption Analysis
                            • 7.3. Market Analysis, Insights and Forecast - by Import Market Analysis (Value & Volume)
                              • 7.4. Market Analysis, Insights and Forecast - by Export Market Analysis (Value & Volume)
                                • 7.5. Market Analysis, Insights and Forecast - by Price Trend Analysis
                                • 8. Europe Chain Saw Industry Analysis, Insights and Forecast, 2019-2031
                                  • 8.1. Market Analysis, Insights and Forecast - by Production Analysis
                                    • 8.2. Market Analysis, Insights and Forecast - by Consumption Analysis
                                      • 8.3. Market Analysis, Insights and Forecast - by Import Market Analysis (Value & Volume)
                                        • 8.4. Market Analysis, Insights and Forecast - by Export Market Analysis (Value & Volume)
                                          • 8.5. Market Analysis, Insights and Forecast - by Price Trend Analysis
                                          • 9. Middle East & Africa Chain Saw Industry Analysis, Insights and Forecast, 2019-2031
                                            • 9.1. Market Analysis, Insights and Forecast - by Production Analysis
                                              • 9.2. Market Analysis, Insights and Forecast - by Consumption Analysis
                                                • 9.3. Market Analysis, Insights and Forecast - by Import Market Analysis (Value & Volume)
                                                  • 9.4. Market Analysis, Insights and Forecast - by Export Market Analysis (Value & Volume)
                                                    • 9.5. Market Analysis, Insights and Forecast - by Price Trend Analysis
                                                    • 10. Asia Pacific Chain Saw Industry Analysis, Insights and Forecast, 2019-2031
                                                      • 10.1. Market Analysis, Insights and Forecast - by Production Analysis
                                                        • 10.2. Market Analysis, Insights and Forecast - by Consumption Analysis
                                                          • 10.3. Market Analysis, Insights and Forecast - by Import Market Analysis (Value & Volume)
                                                            • 10.4. Market Analysis, Insights and Forecast - by Export Market Analysis (Value & Volume)
                                                              • 10.5. Market Analysis, Insights and Forecast - by Price Trend Analysis
                                                              • 11. North America Chain Saw Industry Analysis, Insights and Forecast, 2019-2031
                                                                  • 11.1. Market Analysis, Insights and Forecast - By Country/Sub-region
                                                                    • 11.1.1 United States
                                                                    • 11.1.2 Canada
                                                                    • 11.1.3 Mexico
                                                                    • 11.1.4 Rest of North America
                                                              • 12. Europe Chain Saw Industry Analysis, Insights and Forecast, 2019-2031
                                                                  • 12.1. Market Analysis, Insights and Forecast - By Country/Sub-region
                                                                    • 12.1.1 Germany
                                                                    • 12.1.2 United Kingdom
                                                                    • 12.1.3 France
                                                                    • 12.1.4 Italy
                                                                    • 12.1.5 Russia
                                                                    • 12.1.6 Spain
                                                                    • 12.1.7 Rest of Europe
                                                              • 13. Asia Pacific Chain Saw Industry Analysis, Insights and Forecast, 2019-2031
                                                                  • 13.1. Market Analysis, Insights and Forecast - By Country/Sub-region
                                                                    • 13.1.1 China
                                                                    • 13.1.2 Japan
                                                                    • 13.1.3 India
                                                                    • 13.1.4 Australia
                                                                    • 13.1.5 Rest of Asia Pacific
                                                              • 14. South America Chain Saw Industry Analysis, Insights and Forecast, 2019-2031
                                                                  • 14.1. Market Analysis, Insights and Forecast - By Country/Sub-region
                                                                    • 14.1.1 Brazil
                                                                    • 14.1.2 Argentina
                                                                    • 14.1.3 Rest of South America
                                                              • 15. Africa Chain Saw Industry Analysis, Insights and Forecast, 2019-2031
                                                                  • 15.1. Market Analysis, Insights and Forecast - By Country/Sub-region
                                                                    • 15.1.1 South Africa
                                                                    • 15.1.2 Rest of Africa
                                                              • 16. Competitive Analysis
                                                                • 16.1. Global Market Share Analysis 2024
                                                                  • 16.2. Company Profiles
                                                                    • 16.2.1 Talon Tough Tools
                                                                      • 16.2.1.1. Overview
                                                                      • 16.2.1.2. Products
                                                                      • 16.2.1.3. SWOT Analysis
                                                                      • 16.2.1.4. Recent Developments
                                                                      • 16.2.1.5. Financials (Based on Availability)
                                                                    • 16.2.2 The Toro Co
                                                                      • 16.2.2.1. Overview
                                                                      • 16.2.2.2. Products
                                                                      • 16.2.2.3. SWOT Analysis
                                                                      • 16.2.2.4. Recent Developments
                                                                      • 16.2.2.5. Financials (Based on Availability)
                                                                    • 16.2.3 Einhell Germany
                                                                      • 16.2.3.1. Overview
                                                                      • 16.2.3.2. Products
                                                                      • 16.2.3.3. SWOT Analysis
                                                                      • 16.2.3.4. Recent Developments
                                                                      • 16.2.3.5. Financials (Based on Availability)
                                                                    • 16.2.4 ANDREAS STIHL Limited
                                                                      • 16.2.4.1. Overview
                                                                      • 16.2.4.2. Products
                                                                      • 16.2.4.3. SWOT Analysis
                                                                      • 16.2.4.4. Recent Developments
                                                                      • 16.2.4.5. Financials (Based on Availability)
                                                                    • 16.2.5 Rochford Garden Machinery
                                                                      • 16.2.5.1. Overview
                                                                      • 16.2.5.2. Products
                                                                      • 16.2.5.3. SWOT Analysis
                                                                      • 16.2.5.4. Recent Developments
                                                                      • 16.2.5.5. Financials (Based on Availability)
                                                                    • 16.2.6 Robert Bosch GmbH
                                                                      • 16.2.6.1. Overview
                                                                      • 16.2.6.2. Products
                                                                      • 16.2.6.3. SWOT Analysis
                                                                      • 16.2.6.4. Recent Developments
                                                                      • 16.2.6.5. Financials (Based on Availability)
                                                                    • 16.2.7 SUMEC Group Corporation
                                                                      • 16.2.7.1. Overview
                                                                      • 16.2.7.2. Products
                                                                      • 16.2.7.3. SWOT Analysis
                                                                      • 16.2.7.4. Recent Developments
                                                                      • 16.2.7.5. Financials (Based on Availability)
                                                                    • 16.2.8 AL-KO Kober
                                                                      • 16.2.8.1. Overview
                                                                      • 16.2.8.2. Products
                                                                      • 16.2.8.3. SWOT Analysis
                                                                      • 16.2.8.4. Recent Developments
                                                                      • 16.2.8.5. Financials (Based on Availability)
                                                                    • 16.2.9 STIGA SpA
                                                                      • 16.2.9.1. Overview
                                                                      • 16.2.9.2. Products
                                                                      • 16.2.9.3. SWOT Analysis
                                                                      • 16.2.9.4. Recent Developments
                                                                      • 16.2.9.5. Financials (Based on Availability)
                                                                    • 16.2.10 Emak SPA
                                                                      • 16.2.10.1. Overview
                                                                      • 16.2.10.2. Products
                                                                      • 16.2.10.3. SWOT Analysis
                                                                      • 16.2.10.4. Recent Developments
                                                                      • 16.2.10.5. Financials (Based on Availability)
                                                                    • 16.2.11 Yamabiko Corp
                                                                      • 16.2.11.1. Overview
                                                                      • 16.2.11.2. Products
                                                                      • 16.2.11.3. SWOT Analysis
                                                                      • 16.2.11.4. Recent Developments
                                                                      • 16.2.11.5. Financials (Based on Availability)
                                                                    • 16.2.12 Stanley Black & Decker Inc
                                                                      • 16.2.12.1. Overview
                                                                      • 16.2.12.2. Products
                                                                      • 16.2.12.3. SWOT Analysis
                                                                      • 16.2.12.4. Recent Developments
                                                                      • 16.2.12.5. Financials (Based on Availability)
                                                                    • 16.2.13 Hitachi Ltd
                                                                      • 16.2.13.1. Overview
                                                                      • 16.2.13.2. Products
                                                                      • 16.2.13.3. SWOT Analysis
                                                                      • 16.2.13.4. Recent Developments
                                                                      • 16.2.13.5. Financials (Based on Availability)
                                                                    • 16.2.14 Husqvarna AB
                                                                      • 16.2.14.1. Overview
                                                                      • 16.2.14.2. Products
                                                                      • 16.2.14.3. SWOT Analysis
                                                                      • 16.2.14.4. Recent Developments
                                                                      • 16.2.14.5. Financials (Based on Availability)
                                                                    • 16.2.15 Blount International Inc
                                                                      • 16.2.15.1. Overview
                                                                      • 16.2.15.2. Products
                                                                      • 16.2.15.3. SWOT Analysis
                                                                      • 16.2.15.4. Recent Developments
                                                                      • 16.2.15.5. Financials (Based on Availability)

                                                              List of Figures

                                                              1. Figure 1: Global Chain Saw Industry Revenue Breakdown (Million, %) by Region 2024 & 2032
                                                              2. Figure 2: Global Chain Saw Industry Volume Breakdown (Kiloton, %) by Region 2024 & 2032
                                                              3. Figure 3: North America Chain Saw Industry Revenue (Million), by Country 2024 & 2032
                                                              4. Figure 4: North America Chain Saw Industry Volume (Kiloton), by Country 2024 & 2032
                                                              5. Figure 5: North America Chain Saw Industry Revenue Share (%), by Country 2024 & 2032
                                                              6. Figure 6: North America Chain Saw Industry Volume Share (%), by Country 2024 & 2032
                                                              7. Figure 7: Europe Chain Saw Industry Revenue (Million), by Country 2024 & 2032
                                                              8. Figure 8: Europe Chain Saw Industry Volume (Kiloton), by Country 2024 & 2032
                                                              9. Figure 9: Europe Chain Saw Industry Revenue Share (%), by Country 2024 & 2032
                                                              10. Figure 10: Europe Chain Saw Industry Volume Share (%), by Country 2024 & 2032
                                                              11. Figure 11: Asia Pacific Chain Saw Industry Revenue (Million), by Country 2024 & 2032
                                                              12. Figure 12: Asia Pacific Chain Saw Industry Volume (Kiloton), by Country 2024 & 2032
                                                              13. Figure 13: Asia Pacific Chain Saw Industry Revenue Share (%), by Country 2024 & 2032
                                                              14. Figure 14: Asia Pacific Chain Saw Industry Volume Share (%), by Country 2024 & 2032
                                                              15. Figure 15: South America Chain Saw Industry Revenue (Million), by Country 2024 & 2032
                                                              16. Figure 16: South America Chain Saw Industry Volume (Kiloton), by Country 2024 & 2032
                                                              17. Figure 17: South America Chain Saw Industry Revenue Share (%), by Country 2024 & 2032
                                                              18. Figure 18: South America Chain Saw Industry Volume Share (%), by Country 2024 & 2032
                                                              19. Figure 19: Africa Chain Saw Industry Revenue (Million), by Country 2024 & 2032
                                                              20. Figure 20: Africa Chain Saw Industry Volume (Kiloton), by Country 2024 & 2032
                                                              21. Figure 21: Africa Chain Saw Industry Revenue Share (%), by Country 2024 & 2032
                                                              22. Figure 22: Africa Chain Saw Industry Volume Share (%), by Country 2024 & 2032
                                                              23. Figure 23: North America Chain Saw Industry Revenue (Million), by Production Analysis 2024 & 2032
                                                              24. Figure 24: North America Chain Saw Industry Volume (Kiloton), by Production Analysis 2024 & 2032
                                                              25. Figure 25: North America Chain Saw Industry Revenue Share (%), by Production Analysis 2024 & 2032
                                                              26. Figure 26: North America Chain Saw Industry Volume Share (%), by Production Analysis 2024 & 2032
                                                              27. Figure 27: North America Chain Saw Industry Revenue (Million), by Consumption Analysis 2024 & 2032
                                                              28. Figure 28: North America Chain Saw Industry Volume (Kiloton), by Consumption Analysis 2024 & 2032
                                                              29. Figure 29: North America Chain Saw Industry Revenue Share (%), by Consumption Analysis 2024 & 2032
                                                              30. Figure 30: North America Chain Saw Industry Volume Share (%), by Consumption Analysis 2024 & 2032
                                                              31. Figure 31: North America Chain Saw Industry Revenue (Million), by Import Market Analysis (Value & Volume) 2024 & 2032
                                                              32. Figure 32: North America Chain Saw Industry Volume (Kiloton), by Import Market Analysis (Value & Volume) 2024 & 2032
                                                              33. Figure 33: North America Chain Saw Industry Revenue Share (%), by Import Market Analysis (Value & Volume) 2024 & 2032
                                                              34. Figure 34: North America Chain Saw Industry Volume Share (%), by Import Market Analysis (Value & Volume) 2024 & 2032
                                                              35. Figure 35: North America Chain Saw Industry Revenue (Million), by Export Market Analysis (Value & Volume) 2024 & 2032
                                                              36. Figure 36: North America Chain Saw Industry Volume (Kiloton), by Export Market Analysis (Value & Volume) 2024 & 2032
                                                              37. Figure 37: North America Chain Saw Industry Revenue Share (%), by Export Market Analysis (Value & Volume) 2024 & 2032
                                                              38. Figure 38: North America Chain Saw Industry Volume Share (%), by Export Market Analysis (Value & Volume) 2024 & 2032
                                                              39. Figure 39: North America Chain Saw Industry Revenue (Million), by Price Trend Analysis 2024 & 2032
                                                              40. Figure 40: North America Chain Saw Industry Volume (Kiloton), by Price Trend Analysis 2024 & 2032
                                                              41. Figure 41: North America Chain Saw Industry Revenue Share (%), by Price Trend Analysis 2024 & 2032
                                                              42. Figure 42: North America Chain Saw Industry Volume Share (%), by Price Trend Analysis 2024 & 2032
                                                              43. Figure 43: North America Chain Saw Industry Revenue (Million), by Country 2024 & 2032
                                                              44. Figure 44: North America Chain Saw Industry Volume (Kiloton), by Country 2024 & 2032
                                                              45. Figure 45: North America Chain Saw Industry Revenue Share (%), by Country 2024 & 2032
                                                              46. Figure 46: North America Chain Saw Industry Volume Share (%), by Country 2024 & 2032
                                                              47. Figure 47: South America Chain Saw Industry Revenue (Million), by Production Analysis 2024 & 2032
                                                              48. Figure 48: South America Chain Saw Industry Volume (Kiloton), by Production Analysis 2024 & 2032
                                                              49. Figure 49: South America Chain Saw Industry Revenue Share (%), by Production Analysis 2024 & 2032
                                                              50. Figure 50: South America Chain Saw Industry Volume Share (%), by Production Analysis 2024 & 2032
                                                              51. Figure 51: South America Chain Saw Industry Revenue (Million), by Consumption Analysis 2024 & 2032
                                                              52. Figure 52: South America Chain Saw Industry Volume (Kiloton), by Consumption Analysis 2024 & 2032
                                                              53. Figure 53: South America Chain Saw Industry Revenue Share (%), by Consumption Analysis 2024 & 2032
                                                              54. Figure 54: South America Chain Saw Industry Volume Share (%), by Consumption Analysis 2024 & 2032
                                                              55. Figure 55: South America Chain Saw Industry Revenue (Million), by Import Market Analysis (Value & Volume) 2024 & 2032
                                                              56. Figure 56: South America Chain Saw Industry Volume (Kiloton), by Import Market Analysis (Value & Volume) 2024 & 2032
                                                              57. Figure 57: South America Chain Saw Industry Revenue Share (%), by Import Market Analysis (Value & Volume) 2024 & 2032
                                                              58. Figure 58: South America Chain Saw Industry Volume Share (%), by Import Market Analysis (Value & Volume) 2024 & 2032
                                                              59. Figure 59: South America Chain Saw Industry Revenue (Million), by Export Market Analysis (Value & Volume) 2024 & 2032
                                                              60. Figure 60: South America Chain Saw Industry Volume (Kiloton), by Export Market Analysis (Value & Volume) 2024 & 2032
                                                              61. Figure 61: South America Chain Saw Industry Revenue Share (%), by Export Market Analysis (Value & Volume) 2024 & 2032
                                                              62. Figure 62: South America Chain Saw Industry Volume Share (%), by Export Market Analysis (Value & Volume) 2024 & 2032
                                                              63. Figure 63: South America Chain Saw Industry Revenue (Million), by Price Trend Analysis 2024 & 2032
                                                              64. Figure 64: South America Chain Saw Industry Volume (Kiloton), by Price Trend Analysis 2024 & 2032
                                                              65. Figure 65: South America Chain Saw Industry Revenue Share (%), by Price Trend Analysis 2024 & 2032
                                                              66. Figure 66: South America Chain Saw Industry Volume Share (%), by Price Trend Analysis 2024 & 2032
                                                              67. Figure 67: South America Chain Saw Industry Revenue (Million), by Country 2024 & 2032
                                                              68. Figure 68: South America Chain Saw Industry Volume (Kiloton), by Country 2024 & 2032
                                                              69. Figure 69: South America Chain Saw Industry Revenue Share (%), by Country 2024 & 2032
                                                              70. Figure 70: South America Chain Saw Industry Volume Share (%), by Country 2024 & 2032
                                                              71. Figure 71: Europe Chain Saw Industry Revenue (Million), by Production Analysis 2024 & 2032
                                                              72. Figure 72: Europe Chain Saw Industry Volume (Kiloton), by Production Analysis 2024 & 2032
                                                              73. Figure 73: Europe Chain Saw Industry Revenue Share (%), by Production Analysis 2024 & 2032
                                                              74. Figure 74: Europe Chain Saw Industry Volume Share (%), by Production Analysis 2024 & 2032
                                                              75. Figure 75: Europe Chain Saw Industry Revenue (Million), by Consumption Analysis 2024 & 2032
                                                              76. Figure 76: Europe Chain Saw Industry Volume (Kiloton), by Consumption Analysis 2024 & 2032
                                                              77. Figure 77: Europe Chain Saw Industry Revenue Share (%), by Consumption Analysis 2024 & 2032
                                                              78. Figure 78: Europe Chain Saw Industry Volume Share (%), by Consumption Analysis 2024 & 2032
                                                              79. Figure 79: Europe Chain Saw Industry Revenue (Million), by Import Market Analysis (Value & Volume) 2024 & 2032
                                                              80. Figure 80: Europe Chain Saw Industry Volume (Kiloton), by Import Market Analysis (Value & Volume) 2024 & 2032
                                                              81. Figure 81: Europe Chain Saw Industry Revenue Share (%), by Import Market Analysis (Value & Volume) 2024 & 2032
                                                              82. Figure 82: Europe Chain Saw Industry Volume Share (%), by Import Market Analysis (Value & Volume) 2024 & 2032
                                                              83. Figure 83: Europe Chain Saw Industry Revenue (Million), by Export Market Analysis (Value & Volume) 2024 & 2032
                                                              84. Figure 84: Europe Chain Saw Industry Volume (Kiloton), by Export Market Analysis (Value & Volume) 2024 & 2032
                                                              85. Figure 85: Europe Chain Saw Industry Revenue Share (%), by Export Market Analysis (Value & Volume) 2024 & 2032
                                                              86. Figure 86: Europe Chain Saw Industry Volume Share (%), by Export Market Analysis (Value & Volume) 2024 & 2032
                                                              87. Figure 87: Europe Chain Saw Industry Revenue (Million), by Price Trend Analysis 2024 & 2032
                                                              88. Figure 88: Europe Chain Saw Industry Volume (Kiloton), by Price Trend Analysis 2024 & 2032
                                                              89. Figure 89: Europe Chain Saw Industry Revenue Share (%), by Price Trend Analysis 2024 & 2032
                                                              90. Figure 90: Europe Chain Saw Industry Volume Share (%), by Price Trend Analysis 2024 & 2032
                                                              91. Figure 91: Europe Chain Saw Industry Revenue (Million), by Country 2024 & 2032
                                                              92. Figure 92: Europe Chain Saw Industry Volume (Kiloton), by Country 2024 & 2032
                                                              93. Figure 93: Europe Chain Saw Industry Revenue Share (%), by Country 2024 & 2032
                                                              94. Figure 94: Europe Chain Saw Industry Volume Share (%), by Country 2024 & 2032
                                                              95. Figure 95: Middle East & Africa Chain Saw Industry Revenue (Million), by Production Analysis 2024 & 2032
                                                              96. Figure 96: Middle East & Africa Chain Saw Industry Volume (Kiloton), by Production Analysis 2024 & 2032
                                                              97. Figure 97: Middle East & Africa Chain Saw Industry Revenue Share (%), by Production Analysis 2024 & 2032
                                                              98. Figure 98: Middle East & Africa Chain Saw Industry Volume Share (%), by Production Analysis 2024 & 2032
                                                              99. Figure 99: Middle East & Africa Chain Saw Industry Revenue (Million), by Consumption Analysis 2024 & 2032
                                                              100. Figure 100: Middle East & Africa Chain Saw Industry Volume (Kiloton), by Consumption Analysis 2024 & 2032
                                                              101. Figure 101: Middle East & Africa Chain Saw Industry Revenue Share (%), by Consumption Analysis 2024 & 2032
                                                              102. Figure 102: Middle East & Africa Chain Saw Industry Volume Share (%), by Consumption Analysis 2024 & 2032
                                                              103. Figure 103: Middle East & Africa Chain Saw Industry Revenue (Million), by Import Market Analysis (Value & Volume) 2024 & 2032
                                                              104. Figure 104: Middle East & Africa Chain Saw Industry Volume (Kiloton), by Import Market Analysis (Value & Volume) 2024 & 2032
                                                              105. Figure 105: Middle East & Africa Chain Saw Industry Revenue Share (%), by Import Market Analysis (Value & Volume) 2024 & 2032
                                                              106. Figure 106: Middle East & Africa Chain Saw Industry Volume Share (%), by Import Market Analysis (Value & Volume) 2024 & 2032
                                                              107. Figure 107: Middle East & Africa Chain Saw Industry Revenue (Million), by Export Market Analysis (Value & Volume) 2024 & 2032
                                                              108. Figure 108: Middle East & Africa Chain Saw Industry Volume (Kiloton), by Export Market Analysis (Value & Volume) 2024 & 2032
                                                              109. Figure 109: Middle East & Africa Chain Saw Industry Revenue Share (%), by Export Market Analysis (Value & Volume) 2024 & 2032
                                                              110. Figure 110: Middle East & Africa Chain Saw Industry Volume Share (%), by Export Market Analysis (Value & Volume) 2024 & 2032
                                                              111. Figure 111: Middle East & Africa Chain Saw Industry Revenue (Million), by Price Trend Analysis 2024 & 2032
                                                              112. Figure 112: Middle East & Africa Chain Saw Industry Volume (Kiloton), by Price Trend Analysis 2024 & 2032
                                                              113. Figure 113: Middle East & Africa Chain Saw Industry Revenue Share (%), by Price Trend Analysis 2024 & 2032
                                                              114. Figure 114: Middle East & Africa Chain Saw Industry Volume Share (%), by Price Trend Analysis 2024 & 2032
                                                              115. Figure 115: Middle East & Africa Chain Saw Industry Revenue (Million), by Country 2024 & 2032
                                                              116. Figure 116: Middle East & Africa Chain Saw Industry Volume (Kiloton), by Country 2024 & 2032
                                                              117. Figure 117: Middle East & Africa Chain Saw Industry Revenue Share (%), by Country 2024 & 2032
                                                              118. Figure 118: Middle East & Africa Chain Saw Industry Volume Share (%), by Country 2024 & 2032
                                                              119. Figure 119: Asia Pacific Chain Saw Industry Revenue (Million), by Production Analysis 2024 & 2032
                                                              120. Figure 120: Asia Pacific Chain Saw Industry Volume (Kiloton), by Production Analysis 2024 & 2032
                                                              121. Figure 121: Asia Pacific Chain Saw Industry Revenue Share (%), by Production Analysis 2024 & 2032
                                                              122. Figure 122: Asia Pacific Chain Saw Industry Volume Share (%), by Production Analysis 2024 & 2032
                                                              123. Figure 123: Asia Pacific Chain Saw Industry Revenue (Million), by Consumption Analysis 2024 & 2032
                                                              124. Figure 124: Asia Pacific Chain Saw Industry Volume (Kiloton), by Consumption Analysis 2024 & 2032
                                                              125. Figure 125: Asia Pacific Chain Saw Industry Revenue Share (%), by Consumption Analysis 2024 & 2032
                                                              126. Figure 126: Asia Pacific Chain Saw Industry Volume Share (%), by Consumption Analysis 2024 & 2032
                                                              127. Figure 127: Asia Pacific Chain Saw Industry Revenue (Million), by Import Market Analysis (Value & Volume) 2024 & 2032
                                                              128. Figure 128: Asia Pacific Chain Saw Industry Volume (Kiloton), by Import Market Analysis (Value & Volume) 2024 & 2032
                                                              129. Figure 129: Asia Pacific Chain Saw Industry Revenue Share (%), by Import Market Analysis (Value & Volume) 2024 & 2032
                                                              130. Figure 130: Asia Pacific Chain Saw Industry Volume Share (%), by Import Market Analysis (Value & Volume) 2024 & 2032
                                                              131. Figure 131: Asia Pacific Chain Saw Industry Revenue (Million), by Export Market Analysis (Value & Volume) 2024 & 2032
                                                              132. Figure 132: Asia Pacific Chain Saw Industry Volume (Kiloton), by Export Market Analysis (Value & Volume) 2024 & 2032
                                                              133. Figure 133: Asia Pacific Chain Saw Industry Revenue Share (%), by Export Market Analysis (Value & Volume) 2024 & 2032
                                                              134. Figure 134: Asia Pacific Chain Saw Industry Volume Share (%), by Export Market Analysis (Value & Volume) 2024 & 2032
                                                              135. Figure 135: Asia Pacific Chain Saw Industry Revenue (Million), by Price Trend Analysis 2024 & 2032
                                                              136. Figure 136: Asia Pacific Chain Saw Industry Volume (Kiloton), by Price Trend Analysis 2024 & 2032
                                                              137. Figure 137: Asia Pacific Chain Saw Industry Revenue Share (%), by Price Trend Analysis 2024 & 2032
                                                              138. Figure 138: Asia Pacific Chain Saw Industry Volume Share (%), by Price Trend Analysis 2024 & 2032
                                                              139. Figure 139: Asia Pacific Chain Saw Industry Revenue (Million), by Country 2024 & 2032
                                                              140. Figure 140: Asia Pacific Chain Saw Industry Volume (Kiloton), by Country 2024 & 2032
                                                              141. Figure 141: Asia Pacific Chain Saw Industry Revenue Share (%), by Country 2024 & 2032
                                                              142. Figure 142: Asia Pacific Chain Saw Industry Volume Share (%), by Country 2024 & 2032

                                                              List of Tables

                                                              1. Table 1: Global Chain Saw Industry Revenue Million Forecast, by Region 2019 & 2032
                                                              2. Table 2: Global Chain Saw Industry Volume Kiloton Forecast, by Region 2019 & 2032
                                                              3. Table 3: Global Chain Saw Industry Revenue Million Forecast, by Production Analysis 2019 & 2032
                                                              4. Table 4: Global Chain Saw Industry Volume Kiloton Forecast, by Production Analysis 2019 & 2032
                                                              5. Table 5: Global Chain Saw Industry Revenue Million Forecast, by Consumption Analysis 2019 & 2032
                                                              6. Table 6: Global Chain Saw Industry Volume Kiloton Forecast, by Consumption Analysis 2019 & 2032
                                                              7. Table 7: Global Chain Saw Industry Revenue Million Forecast, by Import Market Analysis (Value & Volume) 2019 & 2032
                                                              8. Table 8: Global Chain Saw Industry Volume Kiloton Forecast, by Import Market Analysis (Value & Volume) 2019 & 2032
                                                              9. Table 9: Global Chain Saw Industry Revenue Million Forecast, by Export Market Analysis (Value & Volume) 2019 & 2032
                                                              10. Table 10: Global Chain Saw Industry Volume Kiloton Forecast, by Export Market Analysis (Value & Volume) 2019 & 2032
                                                              11. Table 11: Global Chain Saw Industry Revenue Million Forecast, by Price Trend Analysis 2019 & 2032
                                                              12. Table 12: Global Chain Saw Industry Volume Kiloton Forecast, by Price Trend Analysis 2019 & 2032
                                                              13. Table 13: Global Chain Saw Industry Revenue Million Forecast, by Region 2019 & 2032
                                                              14. Table 14: Global Chain Saw Industry Volume Kiloton Forecast, by Region 2019 & 2032
                                                              15. Table 15: Global Chain Saw Industry Revenue Million Forecast, by Country 2019 & 2032
                                                              16. Table 16: Global Chain Saw Industry Volume Kiloton Forecast, by Country 2019 & 2032
                                                              17. Table 17: United States Chain Saw Industry Revenue (Million) Forecast, by Application 2019 & 2032
                                                              18. Table 18: United States Chain Saw Industry Volume (Kiloton) Forecast, by Application 2019 & 2032
                                                              19. Table 19: Canada Chain Saw Industry Revenue (Million) Forecast, by Application 2019 & 2032
                                                              20. Table 20: Canada Chain Saw Industry Volume (Kiloton) Forecast, by Application 2019 & 2032
                                                              21. Table 21: Mexico Chain Saw Industry Revenue (Million) Forecast, by Application 2019 & 2032
                                                              22. Table 22: Mexico Chain Saw Industry Volume (Kiloton) Forecast, by Application 2019 & 2032
                                                              23. Table 23: Rest of North America Chain Saw Industry Revenue (Million) Forecast, by Application 2019 & 2032
                                                              24. Table 24: Rest of North America Chain Saw Industry Volume (Kiloton) Forecast, by Application 2019 & 2032
                                                              25. Table 25: Global Chain Saw Industry Revenue Million Forecast, by Country 2019 & 2032
                                                              26. Table 26: Global Chain Saw Industry Volume Kiloton Forecast, by Country 2019 & 2032
                                                              27. Table 27: Germany Chain Saw Industry Revenue (Million) Forecast, by Application 2019 & 2032
                                                              28. Table 28: Germany Chain Saw Industry Volume (Kiloton) Forecast, by Application 2019 & 2032
                                                              29. Table 29: United Kingdom Chain Saw Industry Revenue (Million) Forecast, by Application 2019 & 2032
                                                              30. Table 30: United Kingdom Chain Saw Industry Volume (Kiloton) Forecast, by Application 2019 & 2032
                                                              31. Table 31: France Chain Saw Industry Revenue (Million) Forecast, by Application 2019 & 2032
                                                              32. Table 32: France Chain Saw Industry Volume (Kiloton) Forecast, by Application 2019 & 2032
                                                              33. Table 33: Italy Chain Saw Industry Revenue (Million) Forecast, by Application 2019 & 2032
                                                              34. Table 34: Italy Chain Saw Industry Volume (Kiloton) Forecast, by Application 2019 & 2032
                                                              35. Table 35: Russia Chain Saw Industry Revenue (Million) Forecast, by Application 2019 & 2032
                                                              36. Table 36: Russia Chain Saw Industry Volume (Kiloton) Forecast, by Application 2019 & 2032
                                                              37. Table 37: Spain Chain Saw Industry Revenue (Million) Forecast, by Application 2019 & 2032
                                                              38. Table 38: Spain Chain Saw Industry Volume (Kiloton) Forecast, by Application 2019 & 2032
                                                              39. Table 39: Rest of Europe Chain Saw Industry Revenue (Million) Forecast, by Application 2019 & 2032
                                                              40. Table 40: Rest of Europe Chain Saw Industry Volume (Kiloton) Forecast, by Application 2019 & 2032
                                                              41. Table 41: Global Chain Saw Industry Revenue Million Forecast, by Country 2019 & 2032
                                                              42. Table 42: Global Chain Saw Industry Volume Kiloton Forecast, by Country 2019 & 2032
                                                              43. Table 43: China Chain Saw Industry Revenue (Million) Forecast, by Application 2019 & 2032
                                                              44. Table 44: China Chain Saw Industry Volume (Kiloton) Forecast, by Application 2019 & 2032
                                                              45. Table 45: Japan Chain Saw Industry Revenue (Million) Forecast, by Application 2019 & 2032
                                                              46. Table 46: Japan Chain Saw Industry Volume (Kiloton) Forecast, by Application 2019 & 2032
                                                              47. Table 47: India Chain Saw Industry Revenue (Million) Forecast, by Application 2019 & 2032
                                                              48. Table 48: India Chain Saw Industry Volume (Kiloton) Forecast, by Application 2019 & 2032
                                                              49. Table 49: Australia Chain Saw Industry Revenue (Million) Forecast, by Application 2019 & 2032
                                                              50. Table 50: Australia Chain Saw Industry Volume (Kiloton) Forecast, by Application 2019 & 2032
                                                              51. Table 51: Rest of Asia Pacific Chain Saw Industry Revenue (Million) Forecast, by Application 2019 & 2032
                                                              52. Table 52: Rest of Asia Pacific Chain Saw Industry Volume (Kiloton) Forecast, by Application 2019 & 2032
                                                              53. Table 53: Global Chain Saw Industry Revenue Million Forecast, by Country 2019 & 2032
                                                              54. Table 54: Global Chain Saw Industry Volume Kiloton Forecast, by Country 2019 & 2032
                                                              55. Table 55: Brazil Chain Saw Industry Revenue (Million) Forecast, by Application 2019 & 2032
                                                              56. Table 56: Brazil Chain Saw Industry Volume (Kiloton) Forecast, by Application 2019 & 2032
                                                              57. Table 57: Argentina Chain Saw Industry Revenue (Million) Forecast, by Application 2019 & 2032
                                                              58. Table 58: Argentina Chain Saw Industry Volume (Kiloton) Forecast, by Application 2019 & 2032
                                                              59. Table 59: Rest of South America Chain Saw Industry Revenue (Million) Forecast, by Application 2019 & 2032
                                                              60. Table 60: Rest of South America Chain Saw Industry Volume (Kiloton) Forecast, by Application 2019 & 2032
                                                              61. Table 61: Global Chain Saw Industry Revenue Million Forecast, by Country 2019 & 2032
                                                              62. Table 62: Global Chain Saw Industry Volume Kiloton Forecast, by Country 2019 & 2032
                                                              63. Table 63: South Africa Chain Saw Industry Revenue (Million) Forecast, by Application 2019 & 2032
                                                              64. Table 64: South Africa Chain Saw Industry Volume (Kiloton) Forecast, by Application 2019 & 2032
                                                              65. Table 65: Rest of Africa Chain Saw Industry Revenue (Million) Forecast, by Application 2019 & 2032
                                                              66. Table 66: Rest of Africa Chain Saw Industry Volume (Kiloton) Forecast, by Application 2019 & 2032
                                                              67. Table 67: Global Chain Saw Industry Revenue Million Forecast, by Production Analysis 2019 & 2032
                                                              68. Table 68: Global Chain Saw Industry Volume Kiloton Forecast, by Production Analysis 2019 & 2032
                                                              69. Table 69: Global Chain Saw Industry Revenue Million Forecast, by Consumption Analysis 2019 & 2032
                                                              70. Table 70: Global Chain Saw Industry Volume Kiloton Forecast, by Consumption Analysis 2019 & 2032
                                                              71. Table 71: Global Chain Saw Industry Revenue Million Forecast, by Import Market Analysis (Value & Volume) 2019 & 2032
                                                              72. Table 72: Global Chain Saw Industry Volume Kiloton Forecast, by Import Market Analysis (Value & Volume) 2019 & 2032
                                                              73. Table 73: Global Chain Saw Industry Revenue Million Forecast, by Export Market Analysis (Value & Volume) 2019 & 2032
                                                              74. Table 74: Global Chain Saw Industry Volume Kiloton Forecast, by Export Market Analysis (Value & Volume) 2019 & 2032
                                                              75. Table 75: Global Chain Saw Industry Revenue Million Forecast, by Price Trend Analysis 2019 & 2032
                                                              76. Table 76: Global Chain Saw Industry Volume Kiloton Forecast, by Price Trend Analysis 2019 & 2032
                                                              77. Table 77: Global Chain Saw Industry Revenue Million Forecast, by Country 2019 & 2032
                                                              78. Table 78: Global Chain Saw Industry Volume Kiloton Forecast, by Country 2019 & 2032
                                                              79. Table 79: United States Chain Saw Industry Revenue (Million) Forecast, by Application 2019 & 2032
                                                              80. Table 80: United States Chain Saw Industry Volume (Kiloton) Forecast, by Application 2019 & 2032
                                                              81. Table 81: Canada Chain Saw Industry Revenue (Million) Forecast, by Application 2019 & 2032
                                                              82. Table 82: Canada Chain Saw Industry Volume (Kiloton) Forecast, by Application 2019 & 2032
                                                              83. Table 83: Mexico Chain Saw Industry Revenue (Million) Forecast, by Application 2019 & 2032
                                                              84. Table 84: Mexico Chain Saw Industry Volume (Kiloton) Forecast, by Application 2019 & 2032
                                                              85. Table 85: Global Chain Saw Industry Revenue Million Forecast, by Production Analysis 2019 & 2032
                                                              86. Table 86: Global Chain Saw Industry Volume Kiloton Forecast, by Production Analysis 2019 & 2032
                                                              87. Table 87: Global Chain Saw Industry Revenue Million Forecast, by Consumption Analysis 2019 & 2032
                                                              88. Table 88: Global Chain Saw Industry Volume Kiloton Forecast, by Consumption Analysis 2019 & 2032
                                                              89. Table 89: Global Chain Saw Industry Revenue Million Forecast, by Import Market Analysis (Value & Volume) 2019 & 2032
                                                              90. Table 90: Global Chain Saw Industry Volume Kiloton Forecast, by Import Market Analysis (Value & Volume) 2019 & 2032
                                                              91. Table 91: Global Chain Saw Industry Revenue Million Forecast, by Export Market Analysis (Value & Volume) 2019 & 2032
                                                              92. Table 92: Global Chain Saw Industry Volume Kiloton Forecast, by Export Market Analysis (Value & Volume) 2019 & 2032
                                                              93. Table 93: Global Chain Saw Industry Revenue Million Forecast, by Price Trend Analysis 2019 & 2032
                                                              94. Table 94: Global Chain Saw Industry Volume Kiloton Forecast, by Price Trend Analysis 2019 & 2032
                                                              95. Table 95: Global Chain Saw Industry Revenue Million Forecast, by Country 2019 & 2032
                                                              96. Table 96: Global Chain Saw Industry Volume Kiloton Forecast, by Country 2019 & 2032
                                                              97. Table 97: Brazil Chain Saw Industry Revenue (Million) Forecast, by Application 2019 & 2032
                                                              98. Table 98: Brazil Chain Saw Industry Volume (Kiloton) Forecast, by Application 2019 & 2032
                                                              99. Table 99: Argentina Chain Saw Industry Revenue (Million) Forecast, by Application 2019 & 2032
                                                              100. Table 100: Argentina Chain Saw Industry Volume (Kiloton) Forecast, by Application 2019 & 2032
                                                              101. Table 101: Rest of South America Chain Saw Industry Revenue (Million) Forecast, by Application 2019 & 2032
                                                              102. Table 102: Rest of South America Chain Saw Industry Volume (Kiloton) Forecast, by Application 2019 & 2032
                                                              103. Table 103: Global Chain Saw Industry Revenue Million Forecast, by Production Analysis 2019 & 2032
                                                              104. Table 104: Global Chain Saw Industry Volume Kiloton Forecast, by Production Analysis 2019 & 2032
                                                              105. Table 105: Global Chain Saw Industry Revenue Million Forecast, by Consumption Analysis 2019 & 2032
                                                              106. Table 106: Global Chain Saw Industry Volume Kiloton Forecast, by Consumption Analysis 2019 & 2032
                                                              107. Table 107: Global Chain Saw Industry Revenue Million Forecast, by Import Market Analysis (Value & Volume) 2019 & 2032
                                                              108. Table 108: Global Chain Saw Industry Volume Kiloton Forecast, by Import Market Analysis (Value & Volume) 2019 & 2032
                                                              109. Table 109: Global Chain Saw Industry Revenue Million Forecast, by Export Market Analysis (Value & Volume) 2019 & 2032
                                                              110. Table 110: Global Chain Saw Industry Volume Kiloton Forecast, by Export Market Analysis (Value & Volume) 2019 & 2032
                                                              111. Table 111: Global Chain Saw Industry Revenue Million Forecast, by Price Trend Analysis 2019 & 2032
                                                              112. Table 112: Global Chain Saw Industry Volume Kiloton Forecast, by Price Trend Analysis 2019 & 2032
                                                              113. Table 113: Global Chain Saw Industry Revenue Million Forecast, by Country 2019 & 2032
                                                              114. Table 114: Global Chain Saw Industry Volume Kiloton Forecast, by Country 2019 & 2032
                                                              115. Table 115: United Kingdom Chain Saw Industry Revenue (Million) Forecast, by Application 2019 & 2032
                                                              116. Table 116: United Kingdom Chain Saw Industry Volume (Kiloton) Forecast, by Application 2019 & 2032
                                                              117. Table 117: Germany Chain Saw Industry Revenue (Million) Forecast, by Application 2019 & 2032
                                                              118. Table 118: Germany Chain Saw Industry Volume (Kiloton) Forecast, by Application 2019 & 2032
                                                              119. Table 119: France Chain Saw Industry Revenue (Million) Forecast, by Application 2019 & 2032
                                                              120. Table 120: France Chain Saw Industry Volume (Kiloton) Forecast, by Application 2019 & 2032
                                                              121. Table 121: Italy Chain Saw Industry Revenue (Million) Forecast, by Application 2019 & 2032
                                                              122. Table 122: Italy Chain Saw Industry Volume (Kiloton) Forecast, by Application 2019 & 2032
                                                              123. Table 123: Spain Chain Saw Industry Revenue (Million) Forecast, by Application 2019 & 2032
                                                              124. Table 124: Spain Chain Saw Industry Volume (Kiloton) Forecast, by Application 2019 & 2032
                                                              125. Table 125: Russia Chain Saw Industry Revenue (Million) Forecast, by Application 2019 & 2032
                                                              126. Table 126: Russia Chain Saw Industry Volume (Kiloton) Forecast, by Application 2019 & 2032
                                                              127. Table 127: Benelux Chain Saw Industry Revenue (Million) Forecast, by Application 2019 & 2032
                                                              128. Table 128: Benelux Chain Saw Industry Volume (Kiloton) Forecast, by Application 2019 & 2032
                                                              129. Table 129: Nordics Chain Saw Industry Revenue (Million) Forecast, by Application 2019 & 2032
                                                              130. Table 130: Nordics Chain Saw Industry Volume (Kiloton) Forecast, by Application 2019 & 2032
                                                              131. Table 131: Rest of Europe Chain Saw Industry Revenue (Million) Forecast, by Application 2019 & 2032
                                                              132. Table 132: Rest of Europe Chain Saw Industry Volume (Kiloton) Forecast, by Application 2019 & 2032
                                                              133. Table 133: Global Chain Saw Industry Revenue Million Forecast, by Production Analysis 2019 & 2032
                                                              134. Table 134: Global Chain Saw Industry Volume Kiloton Forecast, by Production Analysis 2019 & 2032
                                                              135. Table 135: Global Chain Saw Industry Revenue Million Forecast, by Consumption Analysis 2019 & 2032
                                                              136. Table 136: Global Chain Saw Industry Volume Kiloton Forecast, by Consumption Analysis 2019 & 2032
                                                              137. Table 137: Global Chain Saw Industry Revenue Million Forecast, by Import Market Analysis (Value & Volume) 2019 & 2032
                                                              138. Table 138: Global Chain Saw Industry Volume Kiloton Forecast, by Import Market Analysis (Value & Volume) 2019 & 2032
                                                              139. Table 139: Global Chain Saw Industry Revenue Million Forecast, by Export Market Analysis (Value & Volume) 2019 & 2032
                                                              140. Table 140: Global Chain Saw Industry Volume Kiloton Forecast, by Export Market Analysis (Value & Volume) 2019 & 2032
                                                              141. Table 141: Global Chain Saw Industry Revenue Million Forecast, by Price Trend Analysis 2019 & 2032
                                                              142. Table 142: Global Chain Saw Industry Volume Kiloton Forecast, by Price Trend Analysis 2019 & 2032
                                                              143. Table 143: Global Chain Saw Industry Revenue Million Forecast, by Country 2019 & 2032
                                                              144. Table 144: Global Chain Saw Industry Volume Kiloton Forecast, by Country 2019 & 2032
                                                              145. Table 145: Turkey Chain Saw Industry Revenue (Million) Forecast, by Application 2019 & 2032
                                                              146. Table 146: Turkey Chain Saw Industry Volume (Kiloton) Forecast, by Application 2019 & 2032
                                                              147. Table 147: Israel Chain Saw Industry Revenue (Million) Forecast, by Application 2019 & 2032
                                                              148. Table 148: Israel Chain Saw Industry Volume (Kiloton) Forecast, by Application 2019 & 2032
                                                              149. Table 149: GCC Chain Saw Industry Revenue (Million) Forecast, by Application 2019 & 2032
                                                              150. Table 150: GCC Chain Saw Industry Volume (Kiloton) Forecast, by Application 2019 & 2032
                                                              151. Table 151: North Africa Chain Saw Industry Revenue (Million) Forecast, by Application 2019 & 2032
                                                              152. Table 152: North Africa Chain Saw Industry Volume (Kiloton) Forecast, by Application 2019 & 2032
                                                              153. Table 153: South Africa Chain Saw Industry Revenue (Million) Forecast, by Application 2019 & 2032
                                                              154. Table 154: South Africa Chain Saw Industry Volume (Kiloton) Forecast, by Application 2019 & 2032
                                                              155. Table 155: Rest of Middle East & Africa Chain Saw Industry Revenue (Million) Forecast, by Application 2019 & 2032
                                                              156. Table 156: Rest of Middle East & Africa Chain Saw Industry Volume (Kiloton) Forecast, by Application 2019 & 2032
                                                              157. Table 157: Global Chain Saw Industry Revenue Million Forecast, by Production Analysis 2019 & 2032
                                                              158. Table 158: Global Chain Saw Industry Volume Kiloton Forecast, by Production Analysis 2019 & 2032
                                                              159. Table 159: Global Chain Saw Industry Revenue Million Forecast, by Consumption Analysis 2019 & 2032
                                                              160. Table 160: Global Chain Saw Industry Volume Kiloton Forecast, by Consumption Analysis 2019 & 2032
                                                              161. Table 161: Global Chain Saw Industry Revenue Million Forecast, by Import Market Analysis (Value & Volume) 2019 & 2032
                                                              162. Table 162: Global Chain Saw Industry Volume Kiloton Forecast, by Import Market Analysis (Value & Volume) 2019 & 2032
                                                              163. Table 163: Global Chain Saw Industry Revenue Million Forecast, by Export Market Analysis (Value & Volume) 2019 & 2032
                                                              164. Table 164: Global Chain Saw Industry Volume Kiloton Forecast, by Export Market Analysis (Value & Volume) 2019 & 2032
                                                              165. Table 165: Global Chain Saw Industry Revenue Million Forecast, by Price Trend Analysis 2019 & 2032
                                                              166. Table 166: Global Chain Saw Industry Volume Kiloton Forecast, by Price Trend Analysis 2019 & 2032
                                                              167. Table 167: Global Chain Saw Industry Revenue Million Forecast, by Country 2019 & 2032
                                                              168. Table 168: Global Chain Saw Industry Volume Kiloton Forecast, by Country 2019 & 2032
                                                              169. Table 169: China Chain Saw Industry Revenue (Million) Forecast, by Application 2019 & 2032
                                                              170. Table 170: China Chain Saw Industry Volume (Kiloton) Forecast, by Application 2019 & 2032
                                                              171. Table 171: India Chain Saw Industry Revenue (Million) Forecast, by Application 2019 & 2032
                                                              172. Table 172: India Chain Saw Industry Volume (Kiloton) Forecast, by Application 2019 & 2032
                                                              173. Table 173: Japan Chain Saw Industry Revenue (Million) Forecast, by Application 2019 & 2032
                                                              174. Table 174: Japan Chain Saw Industry Volume (Kiloton) Forecast, by Application 2019 & 2032
                                                              175. Table 175: South Korea Chain Saw Industry Revenue (Million) Forecast, by Application 2019 & 2032
                                                              176. Table 176: South Korea Chain Saw Industry Volume (Kiloton) Forecast, by Application 2019 & 2032
                                                              177. Table 177: ASEAN Chain Saw Industry Revenue (Million) Forecast, by Application 2019 & 2032
                                                              178. Table 178: ASEAN Chain Saw Industry Volume (Kiloton) Forecast, by Application 2019 & 2032
                                                              179. Table 179: Oceania Chain Saw Industry Revenue (Million) Forecast, by Application 2019 & 2032
                                                              180. Table 180: Oceania Chain Saw Industry Volume (Kiloton) Forecast, by Application 2019 & 2032
                                                              181. Table 181: Rest of Asia Pacific Chain Saw Industry Revenue (Million) Forecast, by Application 2019 & 2032
                                                              182. Table 182: Rest of Asia Pacific Chain Saw Industry Volume (Kiloton) Forecast, by Application 2019 & 2032


                                                              Frequently Asked Questions

                                                              1. What is the projected Compound Annual Growth Rate (CAGR) of the Chain Saw Industry?

                                                              The projected CAGR is approximately 3.50%.

                                                              2. Which companies are prominent players in the Chain Saw Industry?

                                                              Key companies in the market include Talon Tough Tools, The Toro Co, Einhell Germany, ANDREAS STIHL Limited, Rochford Garden Machinery, Robert Bosch GmbH, SUMEC Group Corporation, AL-KO Kober, STIGA SpA, Emak SPA, Yamabiko Corp, Stanley Black & Decker Inc, Hitachi Ltd, Husqvarna AB, Blount International Inc.

                                                              3. What are the main segments of the Chain Saw Industry?

                                                              The market segments include Production Analysis, Consumption Analysis, Import Market Analysis (Value & Volume), Export Market Analysis (Value & Volume), Price Trend Analysis.

                                                              4. Can you provide details about the market size?

                                                              The market size is estimated to be USD 4.27 Million as of 2022.

                                                              5. What are some drivers contributing to market growth?

                                                              Decreasing Per Capita Arable Land; Increased Demand for Food.

                                                              6. What are the notable trends driving market growth?

                                                              Increasing Deforestation and Demand for Commodities and Shelter.

                                                              7. Are there any restraints impacting market growth?

                                                              High Initial Investments; Requirement of Precision Agriculture.

                                                              8. Can you provide examples of recent developments in the market?

                                                              April 2023: Husqvarna launched T542i XP® and 542i XP®, which the company claims to be the world's first battery chainsaws with a clutch, offering a kick-start of energy at the beginning of every cut and the familiar feel of gas-powered counterparts

                                                              9. What pricing options are available for accessing the report?

                                                              Pricing options include single-user, multi-user, and enterprise licenses priced at USD 4750, USD 5250, and USD 8750 respectively.

                                                              10. Is the market size provided in terms of value or volume?

                                                              The market size is provided in terms of value, measured in Million and volume, measured in Kiloton.

                                                              11. Are there any specific market keywords associated with the report?

                                                              Yes, the market keyword associated with the report is "Chain Saw Industry," which aids in identifying and referencing the specific market segment covered.

                                                              12. How do I determine which pricing option suits my needs best?

                                                              The pricing options vary based on user requirements and access needs. Individual users may opt for single-user licenses, while businesses requiring broader access may choose multi-user or enterprise licenses for cost-effective access to the report.

                                                              13. Are there any additional resources or data provided in the Chain Saw Industry report?

                                                              While the report offers comprehensive insights, it's advisable to review the specific contents or supplementary materials provided to ascertain if additional resources or data are available.

                                                              14. How can I stay updated on further developments or reports in the Chain Saw Industry?

                                                              To stay informed about further developments, trends, and reports in the Chain Saw Industry, consider subscribing to industry newsletters, following relevant companies and organizations, or regularly checking reputable industry news sources and publications.


                                                              Methodology

                                                              Step 1 - Identification of Relevant Samples Size from Population Database

                                                              Step Chart
                                                              Bar Chart
                                                              Method Chart

                                                              Step 2 - Approaches for Defining Global Market Size (Value, Volume* & Price*)

                                                              Approach Chart
                                                              Top-down and bottom-up approaches are used to validate the global market size and estimate the market size for manufactures, regional segments, product, and application.

                                                              Note*: In applicable scenarios

                                                              Step 3 - Data Sources

                                                              Primary Research

                                                              • Web Analytics
                                                              • Survey Reports
                                                              • Research Institute
                                                              • Latest Research Reports
                                                              • Opinion Leaders

                                                              Secondary Research

                                                              • Annual Reports
                                                              • White Paper
                                                              • Latest Press Release
                                                              • Industry Association
                                                              • Paid Database
                                                              • Investor Presentations
                                                              Analyst Chart

                                                              Step 4 - Data Triangulation

                                                              Involves using different sources of information in order to increase the validity of a study

                                                              These sources are likely to be stakeholders in a program - participants, other researchers, program staff, other community members, and so on.

                                                              Then we put all data in single framework & apply various statistical tools to find out the dynamic on the market.

                                                              During the analysis stage, feedback from the stakeholder groups would be compared to determine areas of agreement as well as areas of divergence

                                                              Additionally, after gathering mixed and scattered data from a wide range of sources, data is triangulated and correlated to come up with estimated figures which are further validated through primary mediums or industry experts, opinion leaders.

                                                              About Precision Market View

                                                              Precision Market View offers precise market research, industry intelligence, and data analysis for healthcare, manufacturing, technology, and energy. Our reports provide the clarity you need to make informed decisions and drive growth.

                                                              Our team combines primary research, advanced analytics, and industry expertise to deliver actionable intelligence. We offer syndicated reports, custom research, and consulting services tailored to your business needs.

                                                              At Precision Market View, we are committed to quality, transparency, and client satisfaction. Every report is rigorously validated to ensure accuracy and relevance. Our global perspective and local expertise help you understand both the big picture and the finer details of your market.

                                                              Stay informed with Precision Market View. Subscribe to our newsletter for the latest updates and research highlights, and follow us on social media for real-time insights.

                                                              Precision Market View – Clarity for Your Strategic Decisions.

                                                              artwork spiralartwork spiralRelated Reports
                                                              artwork underline

                                                              Digital Agriculture Market 2025-2033: Preparing for Growth and Change

                                                              The booming digital agriculture market is projected to reach \$44.14 billion by 2033, fueled by precision farming, AI, and drone technology. Explore market trends, key players (AGCO, Microsoft, Deere), and regional growth in this comprehensive analysis.

                                                              July 2025
                                                              Base Year: 2024
                                                              No Of Pages: 150
                                                              Price: $4750

                                                              North America Maize Industry Charting Growth Trajectories 2025-2033: Strategic Insights and Forecasts

                                                              Discover the booming North American maize market! This comprehensive analysis reveals key trends, drivers, and restraints, including insights into hybrid seeds, field corn, sweet corn, popcorn, and major players like Bayer & Syngenta. Project your business strategy with our forecast to 2033.

                                                              July 2025
                                                              Base Year: 2024
                                                              No Of Pages: 180
                                                              Price: $3800

                                                              North America Agricultural Tractors Machinery Market 2025-2033 Overview: Trends, Competitor Dynamics, and Opportunities

                                                              Discover the booming North American agricultural tractors market! This comprehensive analysis reveals key trends, drivers, and restraints impacting the $16.39 billion industry through 2033, focusing on key players like Deere & Company and Mahindra & Mahindra. Explore market segmentation by HP and drive type, plus regional breakdowns.

                                                              July 2025
                                                              Base Year: 2024
                                                              No Of Pages: 234
                                                              Price: $4750

                                                              APAC Biofertilizers Market Growth Opportunities: Market Size Forecast to 2033

                                                              Discover the booming APAC biofertilizers market! This comprehensive analysis reveals a CAGR of 10.80%, driven by sustainable agriculture and growing demand for organic food. Explore market size projections, key segments (Rhizobium, Azospirillum, etc.), and leading companies shaping this dynamic industry.

                                                              July 2025
                                                              Base Year: 2024
                                                              No Of Pages: 180
                                                              Price: $4750

                                                              Turkey Agricultural Tractor Market Dynamics and Forecasts: 2025-2033 Strategic Insights

                                                              Discover the booming Turkish agricultural tractor market! This comprehensive analysis reveals a 6.10% CAGR, driven by government support and technological advancements. Explore market trends, segmentation by horsepower (50HP, 75HP, 100HP, 200HP+), key players, and growth projections to 2033. Invest wisely in this expanding sector!

                                                              July 2025
                                                              Base Year: 2024
                                                              No Of Pages: 197
                                                              Price: $3800

                                                              North America Herbicide Market Insightful Analysis: Trends, Competitor Dynamics, and Opportunities 2025-2033

                                                              Discover the surging North American herbicide market, projected to reach $XX million by 2033 with a 4.34% CAGR. This in-depth analysis explores key drivers, trends, restraints, and competitive landscapes, covering chemigation, foliar application, crop types, and leading companies like FMC and Bayer. Gain insights into regional market shares and future growth projections.

                                                              July 2025
                                                              Base Year: 2024
                                                              No Of Pages: 180
                                                              Price: $3800

                                                              Vietnam Agro Machinery Market Insights: Growth at XX CAGR Through 2033

                                                              Discover the booming Vietnam agro-machinery market, projected to reach [estimated value] by 2033 with a CAGR of 11.50%. This in-depth analysis explores market drivers, trends, restraints, key players (Yanmar, Kubota, VEAM), and segment insights (tractors, rice transplanters, harvesting machinery). Learn about investment opportunities and future growth potential.

                                                              July 2025
                                                              Base Year: 2024
                                                              No Of Pages: 150
                                                              Price: $3800

                                                              Exploring Key Dynamics of Honey Industry Industry

                                                              Discover the booming honey market! This comprehensive analysis reveals a $11.08B industry with a 5.20% CAGR, exploring key drivers, trends, regional insights (North America, Europe, Asia-Pacific), and leading brands like Dabur Honey and Patanjali Ayurved. Learn about raw honey, organic honey, Manuka honey, and more. Get your free market research now!

                                                              July 2025
                                                              Base Year: 2024
                                                              No Of Pages: 234
                                                              Price: $4750

                                                              Emerging Market Insights in Cotton Trade Analysis Market: 2025-2033 Overview

                                                              Discover the latest insights into the booming global cotton trade market. This comprehensive analysis reveals a $60B market (2025) projected to grow at a 4.5% CAGR through 2033, driven by textile industry growth and sustainable cotton demand. Explore key trends, restraints, and regional market shares.

                                                              July 2025
                                                              Base Year: 2024
                                                              No Of Pages: 150
                                                              Price: $4750

                                                              Asia-pacific Tomato Seed Market Projected to Grow at XX CAGR: Insights and Forecasts 2025-2033

                                                              The Asia-Pacific tomato seed market is booming, driven by rising demand and advancements in breeding technology. Discover key market trends, growth projections (2025-2033), major players, and regional insights in this comprehensive market analysis.

                                                              July 2025
                                                              Base Year: 2024
                                                              No Of Pages: 180
                                                              Price: $3800

                                                              Uganda Agriculture Industry Market Strategies for the Next Decade: 2025-2033

                                                              Discover the booming Ugandan agriculture industry! Explore market size ($4.07B in 2025), 4.20% CAGR growth projections to 2033, key players, and regional trends in cereals, oilseeds, fruits, and vegetables. Invest in Uganda's agricultural future.

                                                              July 2025
                                                              Base Year: 2024
                                                              No Of Pages: 150
                                                              Price: $3800

                                                              Artichokes Industry: Harnessing Emerging Innovations for Growth 2025-2033

                                                              Discover the booming artichoke market! Explore key trends, regional analysis, and leading companies driving growth in this $XX million industry projected to reach [estimated 2033 value] by 2033. Learn about the rising demand for fresh, canned, frozen, and marinated artichokes in the food service, household, and industrial sectors.

                                                              July 2025
                                                              Base Year: 2024
                                                              No Of Pages: 197
                                                              Price: $3800

                                                              Agricultural Inoculants Market Growth Opportunities and Market Forecast 2025-2033: A Strategic Analysis

                                                              Discover the booming agricultural inoculants market! Our comprehensive analysis reveals a CAGR of 10.50%, driven by sustainable farming trends and rising food demands. Explore market size, segmentation, key players (Bioceres, Novozymes, BASF), and regional insights for 2025-2033. Learn how bio-based solutions are revolutionizing agriculture.

                                                              July 2025
                                                              Base Year: 2024
                                                              No Of Pages: 150
                                                              Price: $4750

                                                              US Farm Equipment Industry Market’s Role in Emerging Tech: Insights and Projections 2025-2033

                                                              The US farm equipment market is booming, projected to reach [estimated 2033 value] by 2033, driven by precision agriculture, government initiatives, and rising demand. Explore market trends, key players (John Deere, Kubota, AGCO), and regional insights in this comprehensive analysis.

                                                              July 2025
                                                              Base Year: 2024
                                                              No Of Pages: 150
                                                              Price: $3800

                                                              Tanzania Fruits and Vegetables Industry Market Demand and Consumption Trends: Outlook 2025-2033

                                                              Discover the booming Tanzanian fruits and vegetables market! This comprehensive report reveals a $2.17B market in 2025, projected to grow at a 6.5% CAGR until 2033. Explore key trends, challenges, and opportunities in production, consumption, import/export, and regional analysis. Invest wisely with our detailed insights.

                                                              July 2025
                                                              Base Year: 2024
                                                              No Of Pages: 197
                                                              Price: $3800

                                                              Technological Advances in Hybrid Soybean Seeds Market Market: Trends and Opportunities 2025-2033

                                                              The booming hybrid soybean seeds market, projected to reach $X Billion by 2025 and growing at a CAGR of 10.20%, is analyzed in this comprehensive report. Discover key drivers, trends, and restraints shaping this dynamic sector, along with leading companies and regional market shares. Explore the potential of hybrid soybean seeds for increased yields and disease resistance.

                                                              July 2025
                                                              Base Year: 2024
                                                              No Of Pages: 197
                                                              Price: $3800

                                                              Farming Robots and Mechatronics Industry Market Disruption Trends and Insights

                                                              The farming robots and mechatronics market is booming, with a 20.40% CAGR. Discover key trends, market segments (autonomous tractors, UAVs, milking robots), leading companies, and regional growth projections for this rapidly expanding sector. Learn how automation is transforming agriculture and optimizing efficiency for sustainable farming practices.

                                                              July 2025
                                                              Base Year: 2024
                                                              No Of Pages: 197
                                                              Price: $3800

                                                              Europe Quinoa Seed Market Industry’s Growth Dynamics and Insights

                                                              Discover the booming European quinoa seed market! Explore key growth drivers, market trends, and competitive landscape analysis. Learn about leading companies and regional market shares in this comprehensive report covering the period 2019-2033. Projected CAGR of 5.20% indicates significant investment potential.

                                                              July 2025
                                                              Base Year: 2024
                                                              No Of Pages: 180
                                                              Price: $4750

                                                              Comprehensive Insights into South Africa Alfalfa Hay Market: Trends and Growth Projections 2025-2033

                                                              Discover the booming South African alfalfa hay market! Our in-depth analysis reveals a $336.86 million market in 2025, projected to grow at a 5.60% CAGR until 2033. Learn about key drivers, trends, and regional insights. Explore opportunities in animal feed, poultry, and horse feed segments.

                                                              July 2025
                                                              Base Year: 2024
                                                              No Of Pages: 180
                                                              Price: $3800

                                                              Seeds in Ghana Market XX CAGR Growth Analysis 2025-2033

                                                              Discover the booming Ghanaian seeds market! Our analysis reveals a $16.61 million market in 2025, projected to reach $26.89 million by 2033, driven by high-yielding seeds and government initiatives. Explore market trends, key players (Syngenta, Corteva, Rijk Zwaan), and growth opportunities in grains, pulses, and more.

                                                              July 2025
                                                              Base Year: 2024
                                                              No Of Pages: 180
                                                              Price: $3800
                                                              • Home
                                                              • About Us
                                                              • Industries
                                                                • Aerospace & Defense
                                                                • Agriculture
                                                                • Animal Nutrition & Wellness
                                                                • Automotive
                                                                • Chemicals & Materials
                                                                • Consumer Goods and Services
                                                                • Energy & Power
                                                                • Financial Services and Investment Intelligence
                                                                • Food & Beverage
                                                                • Home and Property Improvement
                                                                • Hospitality and Tourism
                                                                • Logistics
                                                                • Manufacturing Products and Services
                                                                • Packaging
                                                                • Professional and Commercial Services
                                                                • Real Estate and Construction
                                                                • Retail
                                                                • Technology, Media and Telecom
                                                                • Healthcare
                                                              • Services
                                                              • Contact
                                                              Main Logo
                                                              • Home
                                                              • About Us
                                                              • Industries
                                                                • Aerospace & Defense
                                                                • Agriculture
                                                                • Animal Nutrition & Wellness
                                                                • Automotive
                                                                • Chemicals & Materials
                                                                • Consumer Goods and Services
                                                                • Energy & Power
                                                                • Financial Services and Investment Intelligence
                                                                • Food & Beverage
                                                                • Home and Property Improvement
                                                                • Hospitality and Tourism
                                                                • Logistics
                                                                • Manufacturing Products and Services
                                                                • Packaging
                                                                • Professional and Commercial Services
                                                                • Real Estate and Construction
                                                                • Retail
                                                                • Technology, Media and Telecom
                                                                • Healthcare
                                                              • Services
                                                              • Contact
                                                              +17162654855
                                                              [email protected]

                                                              +17162654855

                                                              [email protected]

                                                              Business Address

                                                              Head Office

                                                              Office no. A 5010, fifth floor, Solitaire Business Hub, Near Phoenix mall, Pune, Maharashtra 411014

                                                              Contact Information

                                                              Craig Francis

                                                              Business Development Head

                                                              +17162654855

                                                              [email protected]

                                                              Connect With Us

                                                              Secure Payment Partners

                                                              payment image
                                                              RetailLogisticsPackagingAutomotiveHealthcareAgricultureEnergy & PowerFood & BeverageAerospace & DefenseChemicals & MaterialsHospitality and TourismAnimal Nutrition & WellnessConsumer Goods and ServicesReal Estate and ConstructionHome and Property ImprovementTechnology, Media and TelecomManufacturing Products and ServicesFinancial Services and Investment Intelligence

                                                              © 2025 All rights reserved


                                                              Privacy Policy
                                                              Terms and Conditions
                                                              FAQ