
Key Insights
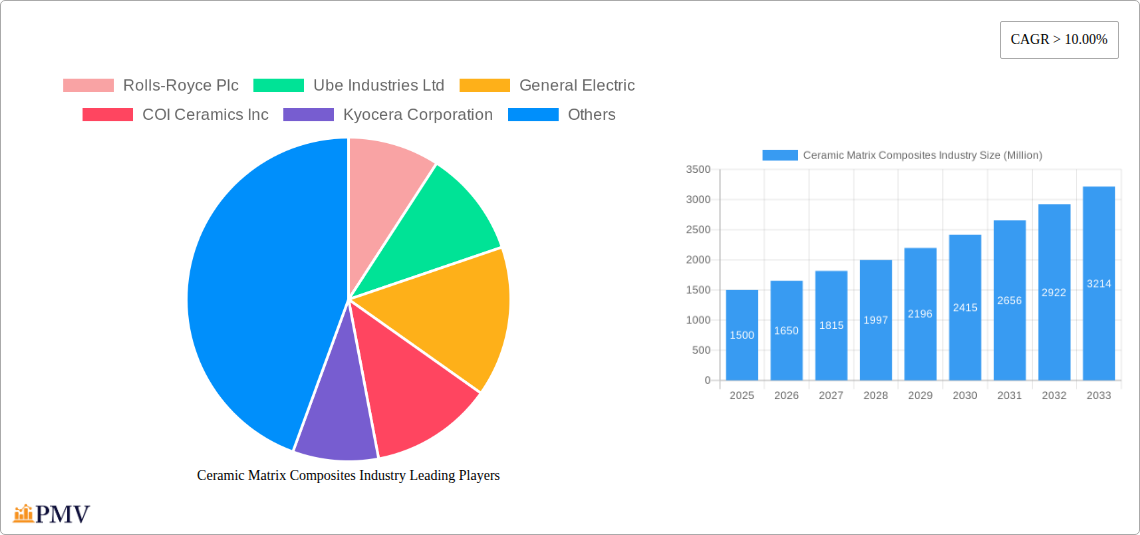
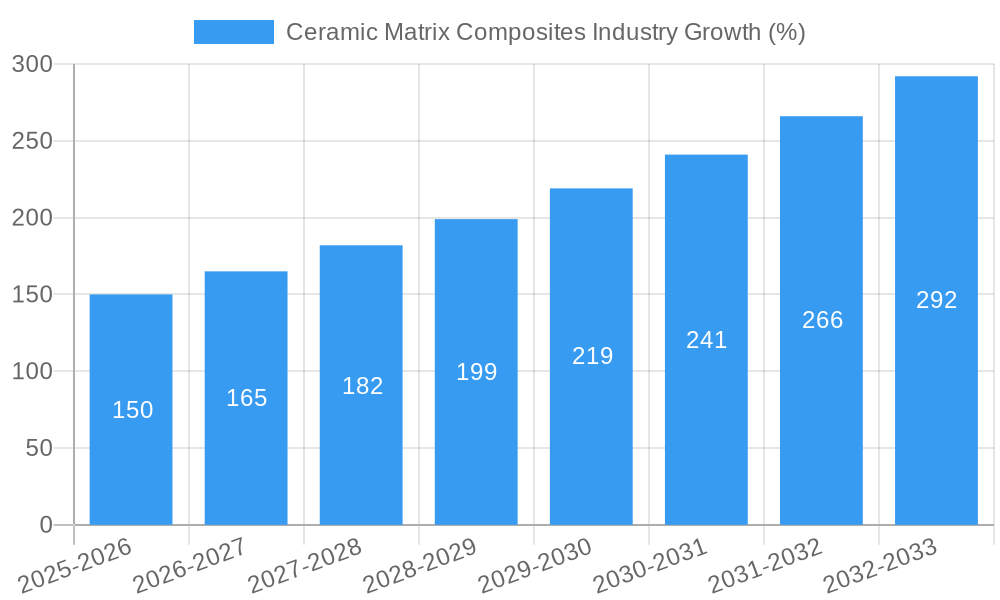
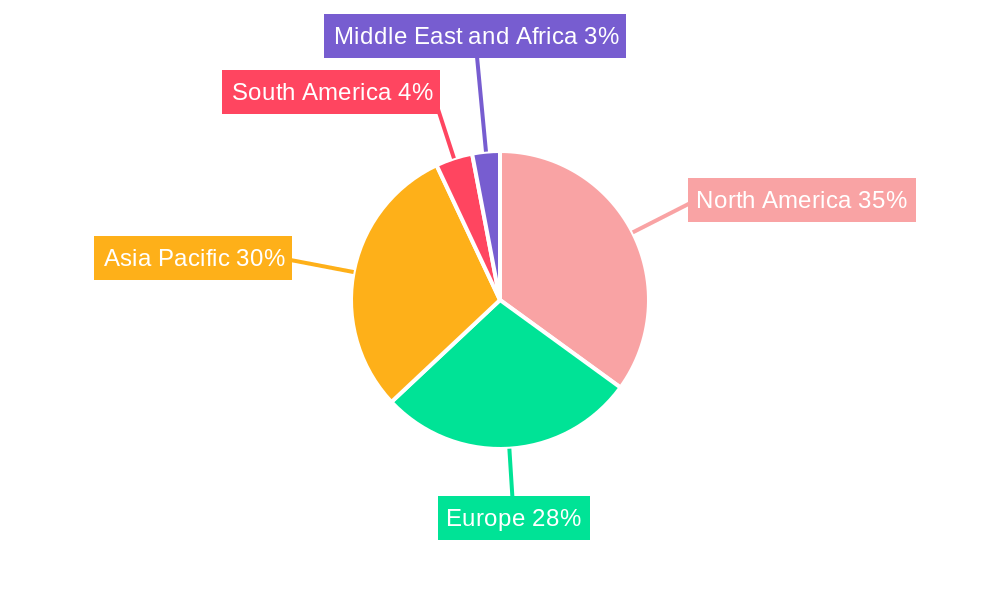
The Ceramic Matrix Composites (CMC) market is experiencing robust growth, driven by increasing demand across diverse sectors. A CAGR exceeding 10% indicates a significant expansion, projected to reach substantial value within the forecast period (2025-2033). Key drivers include the automotive industry's push for lightweight, high-performance components in vehicles, alongside the aerospace sector's need for heat-resistant materials in aircraft engines and high-speed applications. The energy and power sector also contributes significantly, utilizing CMCs in advanced turbine components for enhanced efficiency and durability. Further growth is fueled by ongoing advancements in CMC manufacturing processes, leading to improved material properties and reduced production costs. The market segmentation reveals strong performance across various product types (C/C, C/SiC, Oxide/Oxide, SiC/SiC CMCs), with C/SiC and SiC/SiC composites likely holding larger market shares due to their superior properties. Geographic analysis suggests a significant presence in the Asia-Pacific region, particularly China and Japan, driven by robust industrial growth and government investments in advanced materials. North America and Europe also maintain substantial market shares, with the United States and Germany being key players.
While the market demonstrates substantial potential, certain restraints exist. High manufacturing costs compared to traditional materials could hinder wider adoption, particularly in price-sensitive markets. Furthermore, challenges related to the complex processing and design requirements of CMCs can affect scalability and widespread implementation. However, ongoing research and development activities are actively addressing these challenges. Companies like Rolls-Royce, General Electric, and Kyocera Corporation are key players, driving innovation and expansion within the market. Their continued investments in R&D and strategic partnerships are instrumental in shaping the future trajectory of the CMC industry. The future of the CMC market is promising, with continued growth projected based on consistent technological advancements and increasing demand across multiple end-use industries. The focus on improving cost-effectiveness and expanding applications will remain crucial for long-term success.
Ceramic Matrix Composites (CMC) Industry Market Report: 2019-2033
This comprehensive report provides a detailed analysis of the global Ceramic Matrix Composites (CMC) industry, offering actionable insights for strategic decision-making. Covering the period from 2019 to 2033, with a base year of 2025 and a forecast period of 2025-2033, this report examines market structure, competitive dynamics, industry trends, dominant segments, and key players. The report is meticulously researched and provides critical data points to help navigate this rapidly evolving market. The global market size is estimated at xx Million in 2025 and is projected to reach xx Million by 2033.
Ceramic Matrix Composites Industry Market Structure & Competitive Dynamics
The Ceramic Matrix Composites (CMC) market exhibits a moderately concentrated structure, with key players such as Rolls-Royce Plc, Rolls-Royce Plc, Ube Industries Ltd, Ube Industries Ltd, General Electric, General Electric, COI Ceramics Inc, Kyocera Corporation, Kyocera Corporation, 3M, 3M, Ultramet Inc, SGL Carbon Company, CoorsTek Inc, Lancer Systems LP, Starfire Systems Inc, CeramTec, and Applied Thin Films Inc holding significant market share. The market is characterized by ongoing innovation, particularly in material science and manufacturing processes. Regulatory frameworks, such as those concerning material safety and environmental impact, play a vital role. Product substitutes, such as advanced polymers and metal alloys, pose competitive pressure. End-user trends, particularly in the aerospace and defense sectors, heavily influence market demand. M&A activities have been moderate, with deal values in the range of xx Million to xx Million annually over the past five years, driven by the desire to expand product portfolios and gain access to new technologies. Market share distribution is dynamic, with the top five players collectively holding approximately xx% of the market in 2025.
Ceramic Matrix Composites Industry Industry Trends & Insights
The CMC industry is experiencing significant growth, driven by increasing demand from various end-user industries. The Compound Annual Growth Rate (CAGR) is projected to be xx% during the forecast period (2025-2033). Technological advancements, such as the development of high-temperature resistant CMCs and improved manufacturing techniques, are key growth drivers. The automotive industry's increasing adoption of CMCs for lightweighting applications is fueling market penetration. Furthermore, the aerospace and defense sectors are major consumers, utilizing CMCs in high-performance engines and structural components. Consumer preference for fuel-efficient vehicles and high-performance aircraft is pushing adoption rates. Intense competition among leading players is driving innovation and cost reduction. Market penetration is expected to reach xx% by 2033 in the aerospace sector, with significant growth anticipated in automotive and energy applications.
Dominant Markets & Segments in Ceramic Matrix Composites Industry
Leading Region/Country: North America currently holds the largest market share, driven by strong demand from the aerospace and defense industries. This dominance is attributed to robust R&D investments and a mature manufacturing base.
Dominant Product Type: C/SIC Ceramic Matrix Composites holds the largest market share among product types. The high strength and temperature resistance of C/SIC materials drive their popularity in high-demand applications.
Dominant End-User Industry: The Aerospace industry currently dominates the end-user segment, driven by demand for lightweight, high-strength materials in aircraft engines and structures. Growth is fueled by increased air travel and military spending.
Key Drivers:
- Aerospace: Stringent fuel efficiency regulations and demand for higher performance aircraft.
- Automotive: Growing demand for lightweight vehicles to enhance fuel efficiency and reduce emissions.
- Energy & Power: Need for improved turbine efficiency and durability in power generation applications.
- Economic Policies: Government support for R&D and incentives for the adoption of advanced materials.
- Infrastructure Development: Growth in infrastructure projects driving demand for high-performance materials.
The dominance of these segments reflects factors such as stringent regulatory environments, increased investment in infrastructure, technological advancements, and significant demand from key industries.
Ceramic Matrix Composites Industry Product Innovations
Recent advancements in CMC technology include the development of novel material compositions with enhanced high-temperature capabilities and improved oxidation resistance. These innovations are expanding the applications of CMCs into harsher operating environments. The focus is on improving manufacturing processes to reduce costs and improve scalability. Market fit is significantly enhanced by optimizing CMC properties for specific end-user applications, leading to higher performance and cost-effectiveness. The latest trends emphasize combining CMCs with other advanced materials, such as carbon nanotubes, to further enhance their properties.
Report Segmentation & Scope
This report segments the CMC market by product type (C/C Ceramic Matrix Composites, C/SIC Ceramic Matrix Composites, Oxide/Oxide Ceramic Matrix Composites, SIC/SIC Ceramic Matrix Composites) and end-user industry (Automotive, Aerospace, Defense, Energy & Power, Electrical & Electronics, Others). Each segment's market size, growth projections, and competitive dynamics are analyzed in detail. The report also provides regional breakdowns, including North America, Europe, Asia-Pacific, and the Rest of the World. Growth projections vary across segments, with the Aerospace segment exhibiting the highest CAGR, followed by Automotive. Competitive dynamics are influenced by factors such as technological advancements, pricing strategies, and supply chain management.
Key Drivers of Ceramic Matrix Composites Industry Growth
Key drivers for CMC market growth include the increasing demand for lightweight and high-strength materials in various industries, particularly aerospace and automotive. Advancements in manufacturing technologies are reducing costs and expanding applications. Stringent environmental regulations are pushing for the adoption of fuel-efficient technologies, further driving CMC adoption. Government initiatives promoting the development and adoption of advanced materials also contribute to market expansion. The aerospace industry's continuous push for improved engine performance is a key driver for CMC adoption.
Challenges in the Ceramic Matrix Composites Industry Sector
The CMC industry faces challenges including the high cost of manufacturing, complex processing techniques, and the inherent brittleness of some CMC materials. Supply chain issues and the availability of raw materials can also impact production. Intense competition from alternative materials, such as advanced polymers, poses a significant challenge. Regulatory hurdles related to material safety and environmental standards can also impact market growth. These challenges require continuous technological innovation and efficient supply chain management to mitigate their impact.
Leading Players in the Ceramic Matrix Composites Industry Market
- Rolls-Royce Plc
- Ube Industries Ltd
- General Electric
- COI Ceramics Inc
- Kyocera Corporation
- 3M
- Ultramet Inc
- SGL Carbon Company
- CoorsTek Inc
- Lancer Systems LP
- Starfire Systems Inc
- CeramTec
- Applied Thin Films Inc
Key Developments in Ceramic Matrix Composites Industry Sector
- 2023-Q3: Rolls-Royce announced a significant investment in CMC research and development, focusing on improving the durability of CMC components for aerospace applications.
- 2022-Q4: A major merger between two key players resulted in a significant expansion of the CMC product portfolio and market reach.
- 2021-Q2: Several new product launches focused on high-temperature resistant CMCs for energy and power applications.
(Note: Further specific details on M&A activities and product launches will be provided in the complete report.)
Strategic Ceramic Matrix Composites Industry Market Outlook
The CMC industry is poised for continued growth, driven by the ongoing demand for advanced materials in high-performance applications. Strategic opportunities exist for companies focusing on innovative material compositions, improved manufacturing techniques, and cost reduction. Expanding applications in emerging markets, particularly in the automotive and energy sectors, present significant potential. Companies adopting a proactive approach to R&D and strategic partnerships will be well-positioned to capitalize on future market growth. The future success hinges on continuous innovation, cost optimization, and expansion into new applications across various industries.
Ceramic Matrix Composites Industry Segmentation
-
1. Product Type
- 1.1. C/C Ceramic Matrix Composites
- 1.2. C/SIC Ceramic Matrix Composites
- 1.3. Oxide/Oxide Ceramic Matrix Composites
- 1.4. SIC/SIC Ceramic Matrix Composites
-
2. End-user Industry
- 2.1. Automotive
- 2.2. Aerospace
- 2.3. Defense
- 2.4. Energy and Power
- 2.5. Electrical and Electronics
- 2.6. Other End-user Industries
Ceramic Matrix Composites Industry Segmentation By Geography
-
1. Asia Pacific
- 1.1. China
- 1.2. India
- 1.3. Japan
- 1.4. South Korea
- 1.5. Malaysia
- 1.6. Thailand
- 1.7. Indonesia
- 1.8. Vietnam
- 1.9. Rest of Asia Pacific
-
2. North America
- 2.1. United States
- 2.2. Canada
- 2.3. Mexico
-
3. Europe
- 3.1. Germany
- 3.2. United Kingdom
- 3.3. France
- 3.4. Italy
- 3.5. Spain
- 3.6. Turkey
- 3.7. Russia
- 3.8. Nordic Countries
- 3.9. Rest of Europe
-
4. South America
- 4.1. Brazil
- 4.2. Argentina
- 4.3. Colombia
- 4.4. Rest of South America
-
5. Middle East and Africa
- 5.1. Saudi Arabia
- 5.2. Nigeria
- 5.3. Qatar
- 5.4. Egypt
- 5.5. United Arab Emirates
- 5.6. South Africa
- 5.7. Rest of Middle East and Africa
Ceramic Matrix Composites Industry REPORT HIGHLIGHTS
| Aspects | Details |
|---|---|
| Study Period | 2019-2033 |
| Base Year | 2024 |
| Estimated Year | 2025 |
| Forecast Period | 2025-2033 |
| Historical Period | 2019-2024 |
| Growth Rate | CAGR of > 10.00% from 2019-2033 |
| Segmentation |
|
Table of Contents
- 1. Introduction
- 1.1. Research Scope
- 1.2. Market Segmentation
- 1.3. Research Methodology
- 1.4. Definitions and Assumptions
- 2. Executive Summary
- 2.1. Introduction
- 3. Market Dynamics
- 3.1. Introduction
- 3.2. Market Drivers
- 3.2.1. ; Increasing Application of Ceramic Matrix Composites in Defense Sector; Exceptional Performance Properties at Very High Temperatures
- 3.3. Market Restrains
- 3.3.1. ; Higher Cost of Production as Compared to Other Metals & Alloys; Impact of COVID-19 on the Market Studied
- 3.4. Market Trends
- 3.4.1. SIC/SIC Ceramic Matrix Composites to Drive the Market Growth
- 4. Market Factor Analysis
- 4.1. Porters Five Forces
- 4.2. Supply/Value Chain
- 4.3. PESTEL analysis
- 4.4. Market Entropy
- 4.5. Patent/Trademark Analysis
- 5. Global Ceramic Matrix Composites Industry Analysis, Insights and Forecast, 2019-2031
- 5.1. Market Analysis, Insights and Forecast - by Product Type
- 5.1.1. C/C Ceramic Matrix Composites
- 5.1.2. C/SIC Ceramic Matrix Composites
- 5.1.3. Oxide/Oxide Ceramic Matrix Composites
- 5.1.4. SIC/SIC Ceramic Matrix Composites
- 5.2. Market Analysis, Insights and Forecast - by End-user Industry
- 5.2.1. Automotive
- 5.2.2. Aerospace
- 5.2.3. Defense
- 5.2.4. Energy and Power
- 5.2.5. Electrical and Electronics
- 5.2.6. Other End-user Industries
- 5.3. Market Analysis, Insights and Forecast - by Region
- 5.3.1. Asia Pacific
- 5.3.2. North America
- 5.3.3. Europe
- 5.3.4. South America
- 5.3.5. Middle East and Africa
- 5.1. Market Analysis, Insights and Forecast - by Product Type
- 6. Asia Pacific Ceramic Matrix Composites Industry Analysis, Insights and Forecast, 2019-2031
- 6.1. Market Analysis, Insights and Forecast - by Product Type
- 6.1.1. C/C Ceramic Matrix Composites
- 6.1.2. C/SIC Ceramic Matrix Composites
- 6.1.3. Oxide/Oxide Ceramic Matrix Composites
- 6.1.4. SIC/SIC Ceramic Matrix Composites
- 6.2. Market Analysis, Insights and Forecast - by End-user Industry
- 6.2.1. Automotive
- 6.2.2. Aerospace
- 6.2.3. Defense
- 6.2.4. Energy and Power
- 6.2.5. Electrical and Electronics
- 6.2.6. Other End-user Industries
- 6.1. Market Analysis, Insights and Forecast - by Product Type
- 7. North America Ceramic Matrix Composites Industry Analysis, Insights and Forecast, 2019-2031
- 7.1. Market Analysis, Insights and Forecast - by Product Type
- 7.1.1. C/C Ceramic Matrix Composites
- 7.1.2. C/SIC Ceramic Matrix Composites
- 7.1.3. Oxide/Oxide Ceramic Matrix Composites
- 7.1.4. SIC/SIC Ceramic Matrix Composites
- 7.2. Market Analysis, Insights and Forecast - by End-user Industry
- 7.2.1. Automotive
- 7.2.2. Aerospace
- 7.2.3. Defense
- 7.2.4. Energy and Power
- 7.2.5. Electrical and Electronics
- 7.2.6. Other End-user Industries
- 7.1. Market Analysis, Insights and Forecast - by Product Type
- 8. Europe Ceramic Matrix Composites Industry Analysis, Insights and Forecast, 2019-2031
- 8.1. Market Analysis, Insights and Forecast - by Product Type
- 8.1.1. C/C Ceramic Matrix Composites
- 8.1.2. C/SIC Ceramic Matrix Composites
- 8.1.3. Oxide/Oxide Ceramic Matrix Composites
- 8.1.4. SIC/SIC Ceramic Matrix Composites
- 8.2. Market Analysis, Insights and Forecast - by End-user Industry
- 8.2.1. Automotive
- 8.2.2. Aerospace
- 8.2.3. Defense
- 8.2.4. Energy and Power
- 8.2.5. Electrical and Electronics
- 8.2.6. Other End-user Industries
- 8.1. Market Analysis, Insights and Forecast - by Product Type
- 9. South America Ceramic Matrix Composites Industry Analysis, Insights and Forecast, 2019-2031
- 9.1. Market Analysis, Insights and Forecast - by Product Type
- 9.1.1. C/C Ceramic Matrix Composites
- 9.1.2. C/SIC Ceramic Matrix Composites
- 9.1.3. Oxide/Oxide Ceramic Matrix Composites
- 9.1.4. SIC/SIC Ceramic Matrix Composites
- 9.2. Market Analysis, Insights and Forecast - by End-user Industry
- 9.2.1. Automotive
- 9.2.2. Aerospace
- 9.2.3. Defense
- 9.2.4. Energy and Power
- 9.2.5. Electrical and Electronics
- 9.2.6. Other End-user Industries
- 9.1. Market Analysis, Insights and Forecast - by Product Type
- 10. Middle East and Africa Ceramic Matrix Composites Industry Analysis, Insights and Forecast, 2019-2031
- 10.1. Market Analysis, Insights and Forecast - by Product Type
- 10.1.1. C/C Ceramic Matrix Composites
- 10.1.2. C/SIC Ceramic Matrix Composites
- 10.1.3. Oxide/Oxide Ceramic Matrix Composites
- 10.1.4. SIC/SIC Ceramic Matrix Composites
- 10.2. Market Analysis, Insights and Forecast - by End-user Industry
- 10.2.1. Automotive
- 10.2.2. Aerospace
- 10.2.3. Defense
- 10.2.4. Energy and Power
- 10.2.5. Electrical and Electronics
- 10.2.6. Other End-user Industries
- 10.1. Market Analysis, Insights and Forecast - by Product Type
- 11. Asia Pacific Ceramic Matrix Composites Industry Analysis, Insights and Forecast, 2019-2031
- 11.1. Market Analysis, Insights and Forecast - By Country/Sub-region
- 11.1.1 China
- 11.1.2 India
- 11.1.3 Japan
- 11.1.4 South Korea
- 11.1.5 Rest of Asia Pacific
- 12. North America Ceramic Matrix Composites Industry Analysis, Insights and Forecast, 2019-2031
- 12.1. Market Analysis, Insights and Forecast - By Country/Sub-region
- 12.1.1 United States
- 12.1.2 Canada
- 12.1.3 Mexico
- 13. Europe Ceramic Matrix Composites Industry Analysis, Insights and Forecast, 2019-2031
- 13.1. Market Analysis, Insights and Forecast - By Country/Sub-region
- 13.1.1 Germany
- 13.1.2 United Kingdom
- 13.1.3 France
- 13.1.4 Italy
- 13.1.5 Rest of Europe
- 14. South America Ceramic Matrix Composites Industry Analysis, Insights and Forecast, 2019-2031
- 14.1. Market Analysis, Insights and Forecast - By Country/Sub-region
- 14.1.1 Brazil
- 14.1.2 Argentina
- 14.1.3 Rest of South America
- 15. Middle East and Africa Ceramic Matrix Composites Industry Analysis, Insights and Forecast, 2019-2031
- 15.1. Market Analysis, Insights and Forecast - By Country/Sub-region
- 15.1.1 Saudi Arabia
- 15.1.2 South Africa
- 15.1.3 Rest of Middle East and Africa
- 16. Competitive Analysis
- 16.1. Global Market Share Analysis 2024
- 16.2. Company Profiles
- 16.2.1 Rolls-Royce Plc
- 16.2.1.1. Overview
- 16.2.1.2. Products
- 16.2.1.3. SWOT Analysis
- 16.2.1.4. Recent Developments
- 16.2.1.5. Financials (Based on Availability)
- 16.2.2 Ube Industries Ltd
- 16.2.2.1. Overview
- 16.2.2.2. Products
- 16.2.2.3. SWOT Analysis
- 16.2.2.4. Recent Developments
- 16.2.2.5. Financials (Based on Availability)
- 16.2.3 General Electric
- 16.2.3.1. Overview
- 16.2.3.2. Products
- 16.2.3.3. SWOT Analysis
- 16.2.3.4. Recent Developments
- 16.2.3.5. Financials (Based on Availability)
- 16.2.4 COI Ceramics Inc
- 16.2.4.1. Overview
- 16.2.4.2. Products
- 16.2.4.3. SWOT Analysis
- 16.2.4.4. Recent Developments
- 16.2.4.5. Financials (Based on Availability)
- 16.2.5 Kyocera Corporation
- 16.2.5.1. Overview
- 16.2.5.2. Products
- 16.2.5.3. SWOT Analysis
- 16.2.5.4. Recent Developments
- 16.2.5.5. Financials (Based on Availability)
- 16.2.6 3M
- 16.2.6.1. Overview
- 16.2.6.2. Products
- 16.2.6.3. SWOT Analysis
- 16.2.6.4. Recent Developments
- 16.2.6.5. Financials (Based on Availability)
- 16.2.7 Ultramet Inc *List Not Exhaustive
- 16.2.7.1. Overview
- 16.2.7.2. Products
- 16.2.7.3. SWOT Analysis
- 16.2.7.4. Recent Developments
- 16.2.7.5. Financials (Based on Availability)
- 16.2.8 SGL Carbon Company
- 16.2.8.1. Overview
- 16.2.8.2. Products
- 16.2.8.3. SWOT Analysis
- 16.2.8.4. Recent Developments
- 16.2.8.5. Financials (Based on Availability)
- 16.2.9 CoorsTek Inc
- 16.2.9.1. Overview
- 16.2.9.2. Products
- 16.2.9.3. SWOT Analysis
- 16.2.9.4. Recent Developments
- 16.2.9.5. Financials (Based on Availability)
- 16.2.10 Lancer Systems LP
- 16.2.10.1. Overview
- 16.2.10.2. Products
- 16.2.10.3. SWOT Analysis
- 16.2.10.4. Recent Developments
- 16.2.10.5. Financials (Based on Availability)
- 16.2.11 Starfire Systems Inc
- 16.2.11.1. Overview
- 16.2.11.2. Products
- 16.2.11.3. SWOT Analysis
- 16.2.11.4. Recent Developments
- 16.2.11.5. Financials (Based on Availability)
- 16.2.12 CeramTec
- 16.2.12.1. Overview
- 16.2.12.2. Products
- 16.2.12.3. SWOT Analysis
- 16.2.12.4. Recent Developments
- 16.2.12.5. Financials (Based on Availability)
- 16.2.13 Applied Thin Films Inc
- 16.2.13.1. Overview
- 16.2.13.2. Products
- 16.2.13.3. SWOT Analysis
- 16.2.13.4. Recent Developments
- 16.2.13.5. Financials (Based on Availability)
- 16.2.1 Rolls-Royce Plc
List of Figures
- Figure 1: Global Ceramic Matrix Composites Industry Revenue Breakdown (Million, %) by Region 2024 & 2032
- Figure 2: Asia Pacific Ceramic Matrix Composites Industry Revenue (Million), by Country 2024 & 2032
- Figure 3: Asia Pacific Ceramic Matrix Composites Industry Revenue Share (%), by Country 2024 & 2032
- Figure 4: North America Ceramic Matrix Composites Industry Revenue (Million), by Country 2024 & 2032
- Figure 5: North America Ceramic Matrix Composites Industry Revenue Share (%), by Country 2024 & 2032
- Figure 6: Europe Ceramic Matrix Composites Industry Revenue (Million), by Country 2024 & 2032
- Figure 7: Europe Ceramic Matrix Composites Industry Revenue Share (%), by Country 2024 & 2032
- Figure 8: South America Ceramic Matrix Composites Industry Revenue (Million), by Country 2024 & 2032
- Figure 9: South America Ceramic Matrix Composites Industry Revenue Share (%), by Country 2024 & 2032
- Figure 10: Middle East and Africa Ceramic Matrix Composites Industry Revenue (Million), by Country 2024 & 2032
- Figure 11: Middle East and Africa Ceramic Matrix Composites Industry Revenue Share (%), by Country 2024 & 2032
- Figure 12: Asia Pacific Ceramic Matrix Composites Industry Revenue (Million), by Product Type 2024 & 2032
- Figure 13: Asia Pacific Ceramic Matrix Composites Industry Revenue Share (%), by Product Type 2024 & 2032
- Figure 14: Asia Pacific Ceramic Matrix Composites Industry Revenue (Million), by End-user Industry 2024 & 2032
- Figure 15: Asia Pacific Ceramic Matrix Composites Industry Revenue Share (%), by End-user Industry 2024 & 2032
- Figure 16: Asia Pacific Ceramic Matrix Composites Industry Revenue (Million), by Country 2024 & 2032
- Figure 17: Asia Pacific Ceramic Matrix Composites Industry Revenue Share (%), by Country 2024 & 2032
- Figure 18: North America Ceramic Matrix Composites Industry Revenue (Million), by Product Type 2024 & 2032
- Figure 19: North America Ceramic Matrix Composites Industry Revenue Share (%), by Product Type 2024 & 2032
- Figure 20: North America Ceramic Matrix Composites Industry Revenue (Million), by End-user Industry 2024 & 2032
- Figure 21: North America Ceramic Matrix Composites Industry Revenue Share (%), by End-user Industry 2024 & 2032
- Figure 22: North America Ceramic Matrix Composites Industry Revenue (Million), by Country 2024 & 2032
- Figure 23: North America Ceramic Matrix Composites Industry Revenue Share (%), by Country 2024 & 2032
- Figure 24: Europe Ceramic Matrix Composites Industry Revenue (Million), by Product Type 2024 & 2032
- Figure 25: Europe Ceramic Matrix Composites Industry Revenue Share (%), by Product Type 2024 & 2032
- Figure 26: Europe Ceramic Matrix Composites Industry Revenue (Million), by End-user Industry 2024 & 2032
- Figure 27: Europe Ceramic Matrix Composites Industry Revenue Share (%), by End-user Industry 2024 & 2032
- Figure 28: Europe Ceramic Matrix Composites Industry Revenue (Million), by Country 2024 & 2032
- Figure 29: Europe Ceramic Matrix Composites Industry Revenue Share (%), by Country 2024 & 2032
- Figure 30: South America Ceramic Matrix Composites Industry Revenue (Million), by Product Type 2024 & 2032
- Figure 31: South America Ceramic Matrix Composites Industry Revenue Share (%), by Product Type 2024 & 2032
- Figure 32: South America Ceramic Matrix Composites Industry Revenue (Million), by End-user Industry 2024 & 2032
- Figure 33: South America Ceramic Matrix Composites Industry Revenue Share (%), by End-user Industry 2024 & 2032
- Figure 34: South America Ceramic Matrix Composites Industry Revenue (Million), by Country 2024 & 2032
- Figure 35: South America Ceramic Matrix Composites Industry Revenue Share (%), by Country 2024 & 2032
- Figure 36: Middle East and Africa Ceramic Matrix Composites Industry Revenue (Million), by Product Type 2024 & 2032
- Figure 37: Middle East and Africa Ceramic Matrix Composites Industry Revenue Share (%), by Product Type 2024 & 2032
- Figure 38: Middle East and Africa Ceramic Matrix Composites Industry Revenue (Million), by End-user Industry 2024 & 2032
- Figure 39: Middle East and Africa Ceramic Matrix Composites Industry Revenue Share (%), by End-user Industry 2024 & 2032
- Figure 40: Middle East and Africa Ceramic Matrix Composites Industry Revenue (Million), by Country 2024 & 2032
- Figure 41: Middle East and Africa Ceramic Matrix Composites Industry Revenue Share (%), by Country 2024 & 2032
List of Tables
- Table 1: Global Ceramic Matrix Composites Industry Revenue Million Forecast, by Region 2019 & 2032
- Table 2: Global Ceramic Matrix Composites Industry Revenue Million Forecast, by Product Type 2019 & 2032
- Table 3: Global Ceramic Matrix Composites Industry Revenue Million Forecast, by End-user Industry 2019 & 2032
- Table 4: Global Ceramic Matrix Composites Industry Revenue Million Forecast, by Region 2019 & 2032
- Table 5: Global Ceramic Matrix Composites Industry Revenue Million Forecast, by Country 2019 & 2032
- Table 6: China Ceramic Matrix Composites Industry Revenue (Million) Forecast, by Application 2019 & 2032
- Table 7: India Ceramic Matrix Composites Industry Revenue (Million) Forecast, by Application 2019 & 2032
- Table 8: Japan Ceramic Matrix Composites Industry Revenue (Million) Forecast, by Application 2019 & 2032
- Table 9: South Korea Ceramic Matrix Composites Industry Revenue (Million) Forecast, by Application 2019 & 2032
- Table 10: Rest of Asia Pacific Ceramic Matrix Composites Industry Revenue (Million) Forecast, by Application 2019 & 2032
- Table 11: Global Ceramic Matrix Composites Industry Revenue Million Forecast, by Country 2019 & 2032
- Table 12: United States Ceramic Matrix Composites Industry Revenue (Million) Forecast, by Application 2019 & 2032
- Table 13: Canada Ceramic Matrix Composites Industry Revenue (Million) Forecast, by Application 2019 & 2032
- Table 14: Mexico Ceramic Matrix Composites Industry Revenue (Million) Forecast, by Application 2019 & 2032
- Table 15: Global Ceramic Matrix Composites Industry Revenue Million Forecast, by Country 2019 & 2032
- Table 16: Germany Ceramic Matrix Composites Industry Revenue (Million) Forecast, by Application 2019 & 2032
- Table 17: United Kingdom Ceramic Matrix Composites Industry Revenue (Million) Forecast, by Application 2019 & 2032
- Table 18: France Ceramic Matrix Composites Industry Revenue (Million) Forecast, by Application 2019 & 2032
- Table 19: Italy Ceramic Matrix Composites Industry Revenue (Million) Forecast, by Application 2019 & 2032
- Table 20: Rest of Europe Ceramic Matrix Composites Industry Revenue (Million) Forecast, by Application 2019 & 2032
- Table 21: Global Ceramic Matrix Composites Industry Revenue Million Forecast, by Country 2019 & 2032
- Table 22: Brazil Ceramic Matrix Composites Industry Revenue (Million) Forecast, by Application 2019 & 2032
- Table 23: Argentina Ceramic Matrix Composites Industry Revenue (Million) Forecast, by Application 2019 & 2032
- Table 24: Rest of South America Ceramic Matrix Composites Industry Revenue (Million) Forecast, by Application 2019 & 2032
- Table 25: Global Ceramic Matrix Composites Industry Revenue Million Forecast, by Country 2019 & 2032
- Table 26: Saudi Arabia Ceramic Matrix Composites Industry Revenue (Million) Forecast, by Application 2019 & 2032
- Table 27: South Africa Ceramic Matrix Composites Industry Revenue (Million) Forecast, by Application 2019 & 2032
- Table 28: Rest of Middle East and Africa Ceramic Matrix Composites Industry Revenue (Million) Forecast, by Application 2019 & 2032
- Table 29: Global Ceramic Matrix Composites Industry Revenue Million Forecast, by Product Type 2019 & 2032
- Table 30: Global Ceramic Matrix Composites Industry Revenue Million Forecast, by End-user Industry 2019 & 2032
- Table 31: Global Ceramic Matrix Composites Industry Revenue Million Forecast, by Country 2019 & 2032
- Table 32: China Ceramic Matrix Composites Industry Revenue (Million) Forecast, by Application 2019 & 2032
- Table 33: India Ceramic Matrix Composites Industry Revenue (Million) Forecast, by Application 2019 & 2032
- Table 34: Japan Ceramic Matrix Composites Industry Revenue (Million) Forecast, by Application 2019 & 2032
- Table 35: South Korea Ceramic Matrix Composites Industry Revenue (Million) Forecast, by Application 2019 & 2032
- Table 36: Malaysia Ceramic Matrix Composites Industry Revenue (Million) Forecast, by Application 2019 & 2032
- Table 37: Thailand Ceramic Matrix Composites Industry Revenue (Million) Forecast, by Application 2019 & 2032
- Table 38: Indonesia Ceramic Matrix Composites Industry Revenue (Million) Forecast, by Application 2019 & 2032
- Table 39: Vietnam Ceramic Matrix Composites Industry Revenue (Million) Forecast, by Application 2019 & 2032
- Table 40: Rest of Asia Pacific Ceramic Matrix Composites Industry Revenue (Million) Forecast, by Application 2019 & 2032
- Table 41: Global Ceramic Matrix Composites Industry Revenue Million Forecast, by Product Type 2019 & 2032
- Table 42: Global Ceramic Matrix Composites Industry Revenue Million Forecast, by End-user Industry 2019 & 2032
- Table 43: Global Ceramic Matrix Composites Industry Revenue Million Forecast, by Country 2019 & 2032
- Table 44: United States Ceramic Matrix Composites Industry Revenue (Million) Forecast, by Application 2019 & 2032
- Table 45: Canada Ceramic Matrix Composites Industry Revenue (Million) Forecast, by Application 2019 & 2032
- Table 46: Mexico Ceramic Matrix Composites Industry Revenue (Million) Forecast, by Application 2019 & 2032
- Table 47: Global Ceramic Matrix Composites Industry Revenue Million Forecast, by Product Type 2019 & 2032
- Table 48: Global Ceramic Matrix Composites Industry Revenue Million Forecast, by End-user Industry 2019 & 2032
- Table 49: Global Ceramic Matrix Composites Industry Revenue Million Forecast, by Country 2019 & 2032
- Table 50: Germany Ceramic Matrix Composites Industry Revenue (Million) Forecast, by Application 2019 & 2032
- Table 51: United Kingdom Ceramic Matrix Composites Industry Revenue (Million) Forecast, by Application 2019 & 2032
- Table 52: France Ceramic Matrix Composites Industry Revenue (Million) Forecast, by Application 2019 & 2032
- Table 53: Italy Ceramic Matrix Composites Industry Revenue (Million) Forecast, by Application 2019 & 2032
- Table 54: Spain Ceramic Matrix Composites Industry Revenue (Million) Forecast, by Application 2019 & 2032
- Table 55: Turkey Ceramic Matrix Composites Industry Revenue (Million) Forecast, by Application 2019 & 2032
- Table 56: Russia Ceramic Matrix Composites Industry Revenue (Million) Forecast, by Application 2019 & 2032
- Table 57: Nordic Countries Ceramic Matrix Composites Industry Revenue (Million) Forecast, by Application 2019 & 2032
- Table 58: Rest of Europe Ceramic Matrix Composites Industry Revenue (Million) Forecast, by Application 2019 & 2032
- Table 59: Global Ceramic Matrix Composites Industry Revenue Million Forecast, by Product Type 2019 & 2032
- Table 60: Global Ceramic Matrix Composites Industry Revenue Million Forecast, by End-user Industry 2019 & 2032
- Table 61: Global Ceramic Matrix Composites Industry Revenue Million Forecast, by Country 2019 & 2032
- Table 62: Brazil Ceramic Matrix Composites Industry Revenue (Million) Forecast, by Application 2019 & 2032
- Table 63: Argentina Ceramic Matrix Composites Industry Revenue (Million) Forecast, by Application 2019 & 2032
- Table 64: Colombia Ceramic Matrix Composites Industry Revenue (Million) Forecast, by Application 2019 & 2032
- Table 65: Rest of South America Ceramic Matrix Composites Industry Revenue (Million) Forecast, by Application 2019 & 2032
- Table 66: Global Ceramic Matrix Composites Industry Revenue Million Forecast, by Product Type 2019 & 2032
- Table 67: Global Ceramic Matrix Composites Industry Revenue Million Forecast, by End-user Industry 2019 & 2032
- Table 68: Global Ceramic Matrix Composites Industry Revenue Million Forecast, by Country 2019 & 2032
- Table 69: Saudi Arabia Ceramic Matrix Composites Industry Revenue (Million) Forecast, by Application 2019 & 2032
- Table 70: Nigeria Ceramic Matrix Composites Industry Revenue (Million) Forecast, by Application 2019 & 2032
- Table 71: Qatar Ceramic Matrix Composites Industry Revenue (Million) Forecast, by Application 2019 & 2032
- Table 72: Egypt Ceramic Matrix Composites Industry Revenue (Million) Forecast, by Application 2019 & 2032
- Table 73: United Arab Emirates Ceramic Matrix Composites Industry Revenue (Million) Forecast, by Application 2019 & 2032
- Table 74: South Africa Ceramic Matrix Composites Industry Revenue (Million) Forecast, by Application 2019 & 2032
- Table 75: Rest of Middle East and Africa Ceramic Matrix Composites Industry Revenue (Million) Forecast, by Application 2019 & 2032
Frequently Asked Questions
1. What is the projected Compound Annual Growth Rate (CAGR) of the Ceramic Matrix Composites Industry?
The projected CAGR is approximately > 10.00%.
2. Which companies are prominent players in the Ceramic Matrix Composites Industry?
Key companies in the market include Rolls-Royce Plc, Ube Industries Ltd, General Electric, COI Ceramics Inc, Kyocera Corporation, 3M, Ultramet Inc *List Not Exhaustive, SGL Carbon Company, CoorsTek Inc, Lancer Systems LP, Starfire Systems Inc, CeramTec, Applied Thin Films Inc.
3. What are the main segments of the Ceramic Matrix Composites Industry?
The market segments include Product Type, End-user Industry.
4. Can you provide details about the market size?
The market size is estimated to be USD XX Million as of 2022.
5. What are some drivers contributing to market growth?
; Increasing Application of Ceramic Matrix Composites in Defense Sector; Exceptional Performance Properties at Very High Temperatures.
6. What are the notable trends driving market growth?
SIC/SIC Ceramic Matrix Composites to Drive the Market Growth.
7. Are there any restraints impacting market growth?
; Higher Cost of Production as Compared to Other Metals & Alloys; Impact of COVID-19 on the Market Studied.
8. Can you provide examples of recent developments in the market?
N/A
9. What pricing options are available for accessing the report?
Pricing options include single-user, multi-user, and enterprise licenses priced at USD 4750, USD 5250, and USD 8750 respectively.
10. Is the market size provided in terms of value or volume?
The market size is provided in terms of value, measured in Million.
11. Are there any specific market keywords associated with the report?
Yes, the market keyword associated with the report is "Ceramic Matrix Composites Industry," which aids in identifying and referencing the specific market segment covered.
12. How do I determine which pricing option suits my needs best?
The pricing options vary based on user requirements and access needs. Individual users may opt for single-user licenses, while businesses requiring broader access may choose multi-user or enterprise licenses for cost-effective access to the report.
13. Are there any additional resources or data provided in the Ceramic Matrix Composites Industry report?
While the report offers comprehensive insights, it's advisable to review the specific contents or supplementary materials provided to ascertain if additional resources or data are available.
14. How can I stay updated on further developments or reports in the Ceramic Matrix Composites Industry?
To stay informed about further developments, trends, and reports in the Ceramic Matrix Composites Industry, consider subscribing to industry newsletters, following relevant companies and organizations, or regularly checking reputable industry news sources and publications.
Methodology
Step 1 - Identification of Relevant Samples Size from Population Database


Step 2 - Approaches for Defining Global Market Size (Value, Volume* & Price*)

Note*: In applicable scenarios
Step 3 - Data Sources
Primary Research
- Web Analytics
- Survey Reports
- Research Institute
- Latest Research Reports
- Opinion Leaders
Secondary Research
- Annual Reports
- White Paper
- Latest Press Release
- Industry Association
- Paid Database
- Investor Presentations

Step 4 - Data Triangulation
Involves using different sources of information in order to increase the validity of a study
These sources are likely to be stakeholders in a program - participants, other researchers, program staff, other community members, and so on.
Then we put all data in single framework & apply various statistical tools to find out the dynamic on the market.
During the analysis stage, feedback from the stakeholder groups would be compared to determine areas of agreement as well as areas of divergence


