Key Insights
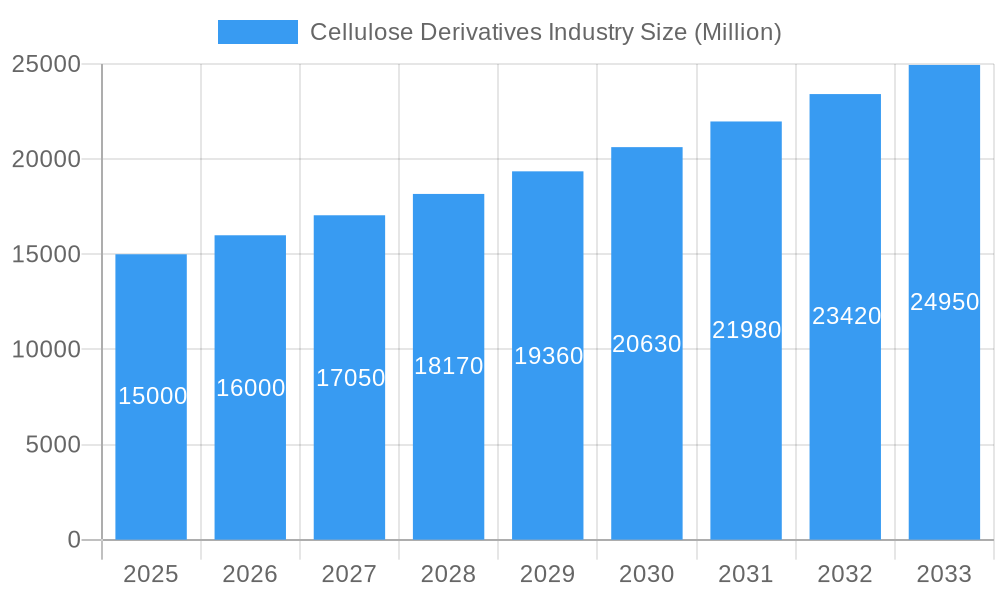
The global Cellulose Derivatives market, valued at $6.73 billion in the base year 2025, is projected for significant expansion. Forecasted to grow at a Compound Annual Growth Rate (CAGR) of 6.6%, this market is set to reach new heights by 2033. Key growth drivers include the escalating demand from the construction sector, where cellulose ethers are integral to construction chemicals, and the increasing preference for sustainable materials. The cosmetics and pharmaceutical industries are substantial contributors, leveraging cellulose derivatives for their essential thickening, stabilizing, and film-forming capabilities. Similarly, the food and beverage sector utilizes these compounds as effective emulsifiers, stabilizers, and thickeners. Innovations in developing advanced cellulose derivatives with superior properties are further propelling market growth. Additionally, a growing global population and rising disposable incomes, particularly in emerging economies, are anticipated to boost demand across diverse end-use segments.
Cellulose Derivatives Industry Market Size (In Billion)
Despite a positive outlook, the market encounters certain restraints. Volatile raw material prices, especially for pulp and wood, can affect profitability. Stringent regulatory compliance for specific cellulose derivative applications presents challenges. Competition from synthetic polymer alternatives also poses an obstacle. Nevertheless, ongoing research and development focused on enhancing functionality and performance are expected to unlock new application areas, supporting the market's positive trajectory. Geographically, North America and Europe currently dominate market share, while the Asia Pacific region is poised for substantial growth, driven by industrialization and rising demand in developing economies.
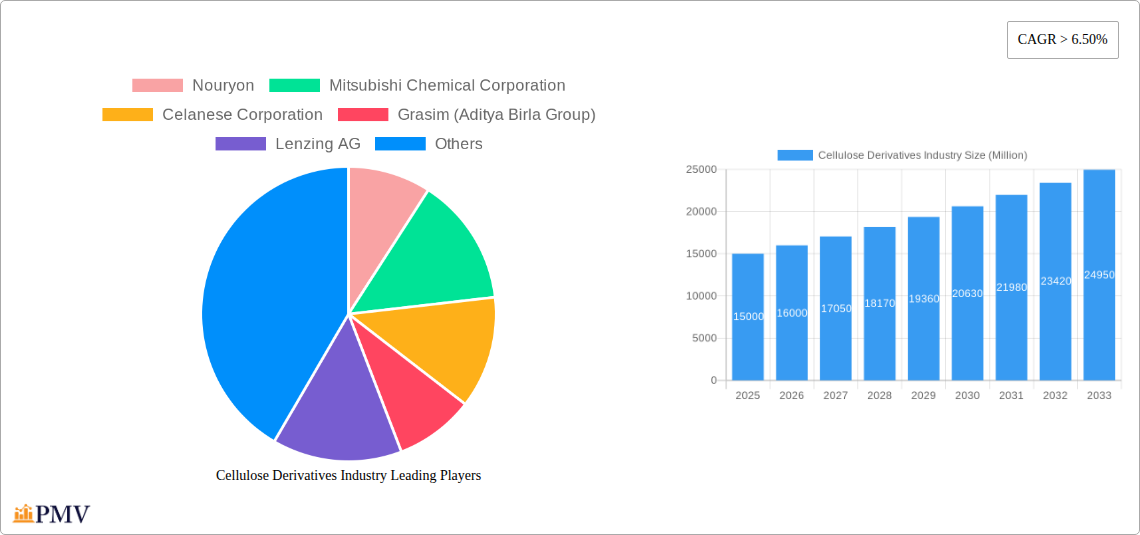
Cellulose Derivatives Industry Company Market Share
Cellulose Derivatives Industry: A Comprehensive Market Report (2019-2033)
This in-depth report provides a comprehensive analysis of the global Cellulose Derivatives market, offering invaluable insights for businesses, investors, and researchers. Covering the period from 2019 to 2033, with 2025 as the base year, this study delves into market dynamics, competitive landscapes, and future growth projections. The report uses Million (M) for all value notations.
Cellulose Derivatives Industry Market Structure & Competitive Dynamics
The Cellulose Derivatives market exhibits a moderately consolidated structure, with key players like Nouryon, Mitsubishi Chemical Corporation, Celanese Corporation, Grasim (Aditya Birla Group), Lenzing AG, Futamura Chemical Co Ltd, Ashland, DuPont, Dow, Eastman Chemical Company, Daicel Corporation, FKuR, Sappi Limited, Shin-Etsu Chemical Co Ltd, Xinjiang Zhongtai Chemical Co Ltd, and Cerdia International GmbH holding significant market share. Market concentration is assessed through Herfindahl-Hirschman Index (HHI) analysis (xx), revealing the level of competition and potential for mergers and acquisitions (M&A).
Innovation ecosystems are largely driven by R&D investments focused on developing sustainable and high-performance cellulose derivatives. Regulatory frameworks, including those related to environmental protection and material safety, significantly influence market growth. Product substitutes, such as synthetic polymers, present competitive challenges, requiring continuous innovation in product properties and cost-effectiveness. End-user trends, particularly towards sustainable and bio-based materials across various sectors, are key growth drivers. M&A activities have been moderate in recent years, with deal values totaling approximately xx M in the period 2019-2024. Notable transactions include [Specific examples of M&A activities with deal values, if available, otherwise use 'xx M']. The report further analyzes market share distribution among key players, highlighting their competitive strategies and market positioning.
Cellulose Derivatives Industry Industry Trends & Insights
The global Cellulose Derivatives market is experiencing robust growth, driven by increasing demand across various end-use sectors. The Compound Annual Growth Rate (CAGR) is projected at xx% during the forecast period (2025-2033). This growth is fueled by several factors, including the rising adoption of sustainable materials in construction, the growing popularity of eco-friendly cosmetics and pharmaceuticals, and the expanding food and beverage industry. Technological advancements in cellulose derivative production are leading to higher-performance materials with improved properties, such as enhanced biodegradability and strength. Consumer preferences are shifting towards eco-conscious products, further propelling market growth. The market penetration of cellulose derivatives in specific sectors is analyzed with detailed data on market shares for key applications, such as coatings, textiles, and food packaging (xx%). Competitive dynamics involve continuous product innovation, strategic partnerships, and regional expansion by major players. This dynamic landscape is shaped by changing regulations, fluctuating raw material costs, and evolving consumer demands, presenting both opportunities and challenges for market participants.
Dominant Markets & Segments in Cellulose Derivatives Industry
Leading Region/Country: [Specify the leading region/country based on market size and growth rate, e.g., Asia-Pacific]. Key drivers in this region include rapid industrialization, increasing infrastructure development, and favorable government policies promoting sustainable materials. [Elaborate on the specific factors driving dominance, incorporating economic policies, infrastructure developments, and consumer behavior, in a paragraph.]
Dominant Chemical Type: [Specify the dominant chemical type amongst Cellulose Esters, Cellulose Ethers, and Regenerated Cellulose, based on market share and growth projections. Example: Cellulose Ethers]. Reasons for dominance include [Explain the factors driving this segment's dominance].
Dominant End-User Industry: [Specify the dominant end-user industry amongst Construction, Cosmetics & Pharmaceuticals, Food & Beverage, Paints & Coatings, Plastics, Textile, and Other End-user Industries. Example: Construction]. This segment's dominance is attributed to [Explain the factors contributing to this segment's leadership, including economic growth, urbanization, and infrastructure development]. Detailed analysis of each segment's market size, growth rate, and competitive landscape are provided in the full report.
Cellulose Derivatives Industry Product Innovations
Recent years have witnessed significant advancements in cellulose derivative technology, focusing on enhancing product performance and sustainability. New products with improved biodegradability, water solubility, and film-forming properties are gaining traction in various applications. Innovations in processing techniques are also contributing to reduced production costs and improved efficiency. These developments are driving the expansion of cellulose derivatives into new market segments and strengthening their competitive advantage against traditional synthetic materials. The focus is on creating products tailored to specific end-user requirements, leading to increased market penetration across various sectors.
Report Segmentation & Scope
This report segments the Cellulose Derivatives market based on chemical type (Cellulose Esters, Cellulose Ethers, Regenerated Cellulose) and end-user industry (Construction, Cosmetics & Pharmaceuticals, Food & Beverage, Paints & Coatings, Plastics, Textile, Other End-user Industries). Each segment is thoroughly analyzed, providing insights into market size, growth projections, and competitive dynamics. For instance, the Cellulose Esters segment is expected to grow at a CAGR of xx% during the forecast period, driven by its widespread use in coatings and plastics. Similarly, the Construction end-user industry is projected to witness strong growth due to the increasing demand for sustainable building materials. The report also provides detailed competitive analyses within each segment, including market share data for key players.
Key Drivers of Cellulose Derivatives Industry Growth
The growth of the Cellulose Derivatives industry is propelled by several key factors. The increasing demand for sustainable and biodegradable materials is a primary driver, pushing the adoption of cellulose derivatives across various sectors. Favorable government policies promoting renewable resources and stringent regulations on the use of harmful chemicals are further stimulating market growth. Technological advancements in cellulose processing and modification are leading to the development of high-performance materials with improved properties. This coupled with the ongoing expansion of end-use industries such as construction, pharmaceuticals, and food processing, creates a favorable environment for market expansion.
Challenges in the Cellulose Derivatives Industry Sector
Despite the positive growth outlook, the Cellulose Derivatives industry faces certain challenges. Fluctuations in raw material prices, particularly wood pulp, can impact production costs and profitability. Competition from synthetic polymers and other substitute materials remains a significant hurdle. Furthermore, regulatory hurdles and stringent environmental standards can impact production and market access. Supply chain disruptions can also affect availability and pricing. Addressing these challenges through strategic cost management, process optimization, and continuous innovation is crucial for sustained growth in this industry. For example, disruptions in 2022 resulted in a xx% increase in raw material costs.
Leading Players in the Cellulose Derivatives Industry Market
- Nouryon
- Mitsubishi Chemical Corporation
- Celanese Corporation
- Grasim (Aditya Birla Group)
- Lenzing AG
- Futamura Chemical Co Ltd
- Ashland
- DuPont
- Dow
- Eastman Chemical Company
- Daicel Corporation
- FKuR
- Sappi Limited
- Shin-Etsu Chemical Co Ltd
- Xinjiang Zhongtai Chemical Co Ltd
- Cerdia International GmbH
Key Developments in Cellulose Derivatives Industry Sector
- [Month, Year]: [Specific development, e.g., Launch of a new bio-based cellulose derivative by Company X.] [Impact on market dynamics]
- [Month, Year]: [Specific development, e.g., Acquisition of Company Y by Company Z] [Impact on market dynamics]
- [Month, Year]: [Specific development, e.g., Introduction of new regulations impacting the production of cellulose derivatives]. [Impact on market dynamics]
- [Add more bullet points as needed]
Strategic Cellulose Derivatives Industry Market Outlook
The Cellulose Derivatives market is poised for significant growth in the coming years, driven by continued innovation in product development, increasing demand for sustainable materials, and expansion into new applications. Strategic opportunities lie in developing high-performance, customized products tailored to specific end-user needs. Investing in research and development to enhance material properties, such as biodegradability and strength, will be crucial for maintaining a competitive edge. Furthermore, exploring new market segments and forging strategic partnerships will be essential for driving future growth. The focus on sustainability, combined with technological advancements, will further fuel the market's potential.
Cellulose Derivatives Industry Segmentation
-
1. Chemical Type
- 1.1. Cellulose Esters
- 1.2. Cellulose Ethers
- 1.3. Regenerated Cellulose
-
2. End-user Industry
- 2.1. Construction
- 2.2. Cosmetics & Pharmaceuricals
- 2.3. Food & Beverage
- 2.4. Paints & Coatings
- 2.5. Plastics
- 2.6. Textile
- 2.7. Other End-user Industries
Cellulose Derivatives Industry Segmentation By Geography
-
1. Asia Pacific
- 1.1. China
- 1.2. India
- 1.3. Japan
- 1.4. South Korea
- 1.5. Rest of Asia Pacific
-
2. North America
- 2.1. United States
- 2.2. Mexico
- 2.3. Canada
-
3. Europe
- 3.1. Germany
- 3.2. United Kingdom
- 3.3. Italy
- 3.4. France
- 3.5. Rest of Europe
-
4. South America
- 4.1. Brazil
- 4.2. Argentina
- 4.3. Rest of South America
-
5. Middle East & Africa
- 5.1. UAE
- 5.2. Saudi Arabia
- 5.3. South Africa
- 5.4. Rest of Middle East & Africa
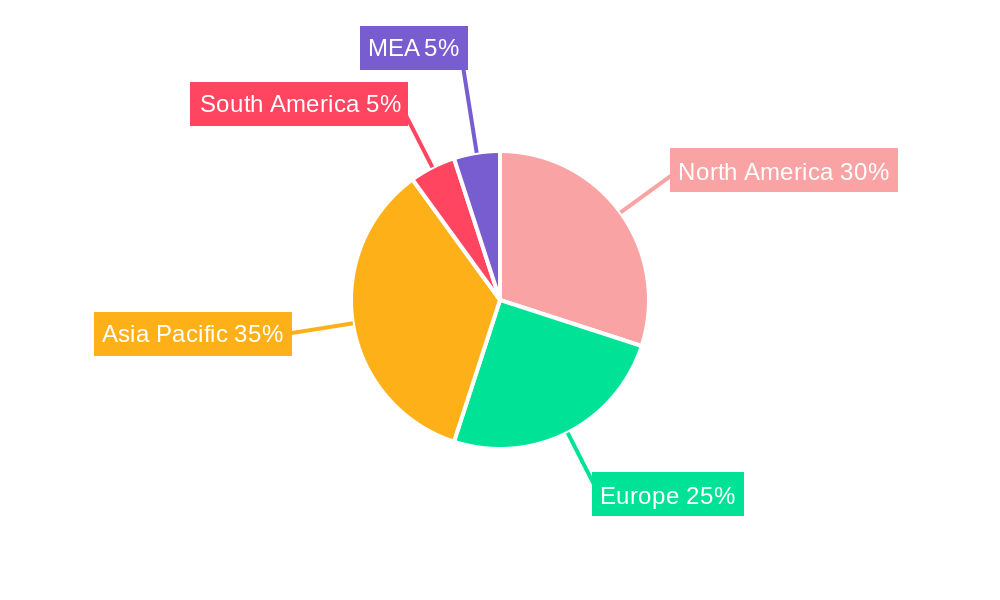
Cellulose Derivatives Industry Regional Market Share
Geographic Coverage of Cellulose Derivatives Industry
Cellulose Derivatives Industry REPORT HIGHLIGHTS
| Aspects | Details |
|---|---|
| Study Period | 2020-2034 |
| Base Year | 2025 |
| Estimated Year | 2026 |
| Forecast Period | 2026-2034 |
| Historical Period | 2020-2025 |
| Growth Rate | CAGR of 6.6% from 2020-2034 |
| Segmentation |
|
Table of Contents
- 1. Introduction
- 1.1. Research Scope
- 1.2. Market Segmentation
- 1.3. Research Objective
- 1.4. Definitions and Assumptions
- 2. Executive Summary
- 2.1. Market Snapshot
- 3. Market Dynamics
- 3.1. Market Drivers
- 3.2. Market Restrains
- 3.3. Market Trends
- 3.4. Market Opportunities
- 4. Market Factor Analysis
- 4.1. Porters Five Forces
- 4.1.1. Bargaining Power of Suppliers
- 4.1.2. Bargaining Power of Buyers
- 4.1.3. Threat of New Entrants
- 4.1.4. Threat of Substitutes
- 4.1.5. Competitive Rivalry
- 4.2. PESTEL analysis
- 4.3. BCG Analysis
- 4.3.1. Stars (High Growth, High Market Share)
- 4.3.2. Cash Cows (Low Growth, High Market Share)
- 4.3.3. Question Mark (High Growth, Low Market Share)
- 4.3.4. Dogs (Low Growth, Low Market Share)
- 4.4. Ansoff Matrix Analysis
- 4.5. Supply Chain Analysis
- 4.6. Regulatory Landscape
- 4.7. Current Market Potential and Opportunity Assessment (TAM–SAM–SOM Framework)
- 4.8. PMV Analyst Note
- 4.1. Porters Five Forces
- 5. Market Analysis, Insights and Forecast 2021-2033
- 5.1. Market Analysis, Insights and Forecast - by Chemical Type
- 5.1.1. Cellulose Esters
- 5.1.2. Cellulose Ethers
- 5.1.3. Regenerated Cellulose
- 5.2. Market Analysis, Insights and Forecast - by End-user Industry
- 5.2.1. Construction
- 5.2.2. Cosmetics & Pharmaceuricals
- 5.2.3. Food & Beverage
- 5.2.4. Paints & Coatings
- 5.2.5. Plastics
- 5.2.6. Textile
- 5.2.7. Other End-user Industries
- 5.3. Market Analysis, Insights and Forecast - by Region
- 5.3.1. Asia Pacific
- 5.3.2. North America
- 5.3.3. Europe
- 5.3.4. South America
- 5.3.5. Middle East & Africa
- 5.1. Market Analysis, Insights and Forecast - by Chemical Type
- 6. Global Cellulose Derivatives Industry Analysis, Insights and Forecast, 2021-2033
- 6.1. Market Analysis, Insights and Forecast - by Chemical Type
- 6.1.1. Cellulose Esters
- 6.1.2. Cellulose Ethers
- 6.1.3. Regenerated Cellulose
- 6.2. Market Analysis, Insights and Forecast - by End-user Industry
- 6.2.1. Construction
- 6.2.2. Cosmetics & Pharmaceuricals
- 6.2.3. Food & Beverage
- 6.2.4. Paints & Coatings
- 6.2.5. Plastics
- 6.2.6. Textile
- 6.2.7. Other End-user Industries
- 6.1. Market Analysis, Insights and Forecast - by Chemical Type
- 7. Asia Pacific Cellulose Derivatives Industry Analysis, Insights and Forecast, 2020-2032
- 7.1. Market Analysis, Insights and Forecast - by Chemical Type
- 7.1.1. Cellulose Esters
- 7.1.2. Cellulose Ethers
- 7.1.3. Regenerated Cellulose
- 7.2. Market Analysis, Insights and Forecast - by End-user Industry
- 7.2.1. Construction
- 7.2.2. Cosmetics & Pharmaceuricals
- 7.2.3. Food & Beverage
- 7.2.4. Paints & Coatings
- 7.2.5. Plastics
- 7.2.6. Textile
- 7.2.7. Other End-user Industries
- 7.1. Market Analysis, Insights and Forecast - by Chemical Type
- 8. North America Cellulose Derivatives Industry Analysis, Insights and Forecast, 2020-2032
- 8.1. Market Analysis, Insights and Forecast - by Chemical Type
- 8.1.1. Cellulose Esters
- 8.1.2. Cellulose Ethers
- 8.1.3. Regenerated Cellulose
- 8.2. Market Analysis, Insights and Forecast - by End-user Industry
- 8.2.1. Construction
- 8.2.2. Cosmetics & Pharmaceuricals
- 8.2.3. Food & Beverage
- 8.2.4. Paints & Coatings
- 8.2.5. Plastics
- 8.2.6. Textile
- 8.2.7. Other End-user Industries
- 8.1. Market Analysis, Insights and Forecast - by Chemical Type
- 9. Europe Cellulose Derivatives Industry Analysis, Insights and Forecast, 2020-2032
- 9.1. Market Analysis, Insights and Forecast - by Chemical Type
- 9.1.1. Cellulose Esters
- 9.1.2. Cellulose Ethers
- 9.1.3. Regenerated Cellulose
- 9.2. Market Analysis, Insights and Forecast - by End-user Industry
- 9.2.1. Construction
- 9.2.2. Cosmetics & Pharmaceuricals
- 9.2.3. Food & Beverage
- 9.2.4. Paints & Coatings
- 9.2.5. Plastics
- 9.2.6. Textile
- 9.2.7. Other End-user Industries
- 9.1. Market Analysis, Insights and Forecast - by Chemical Type
- 10. South America Cellulose Derivatives Industry Analysis, Insights and Forecast, 2020-2032
- 10.1. Market Analysis, Insights and Forecast - by Chemical Type
- 10.1.1. Cellulose Esters
- 10.1.2. Cellulose Ethers
- 10.1.3. Regenerated Cellulose
- 10.2. Market Analysis, Insights and Forecast - by End-user Industry
- 10.2.1. Construction
- 10.2.2. Cosmetics & Pharmaceuricals
- 10.2.3. Food & Beverage
- 10.2.4. Paints & Coatings
- 10.2.5. Plastics
- 10.2.6. Textile
- 10.2.7. Other End-user Industries
- 10.1. Market Analysis, Insights and Forecast - by Chemical Type
- 11. Middle East & Africa Cellulose Derivatives Industry Analysis, Insights and Forecast, 2020-2032
- 11.1. Market Analysis, Insights and Forecast - by Chemical Type
- 11.1.1. Cellulose Esters
- 11.1.2. Cellulose Ethers
- 11.1.3. Regenerated Cellulose
- 11.2. Market Analysis, Insights and Forecast - by End-user Industry
- 11.2.1. Construction
- 11.2.2. Cosmetics & Pharmaceuricals
- 11.2.3. Food & Beverage
- 11.2.4. Paints & Coatings
- 11.2.5. Plastics
- 11.2.6. Textile
- 11.2.7. Other End-user Industries
- 11.1. Market Analysis, Insights and Forecast - by Chemical Type
- 12. Competitive Analysis
- 12.1. Company Profiles
- 12.1.1 Nouryon
- 12.1.1.1. Company Overview
- 12.1.1.2. Products
- 12.1.1.3. Company Financials
- 12.1.1.4. SWOT Analysis
- 12.1.2 Mitsubishi Chemical Corporation
- 12.1.2.1. Company Overview
- 12.1.2.2. Products
- 12.1.2.3. Company Financials
- 12.1.2.4. SWOT Analysis
- 12.1.3 Celanese Corporation
- 12.1.3.1. Company Overview
- 12.1.3.2. Products
- 12.1.3.3. Company Financials
- 12.1.3.4. SWOT Analysis
- 12.1.4 Grasim (Aditya Birla Group)
- 12.1.4.1. Company Overview
- 12.1.4.2. Products
- 12.1.4.3. Company Financials
- 12.1.4.4. SWOT Analysis
- 12.1.5 Lenzing AG
- 12.1.5.1. Company Overview
- 12.1.5.2. Products
- 12.1.5.3. Company Financials
- 12.1.5.4. SWOT Analysis
- 12.1.6 Futamura Chemical Co Ltd
- 12.1.6.1. Company Overview
- 12.1.6.2. Products
- 12.1.6.3. Company Financials
- 12.1.6.4. SWOT Analysis
- 12.1.7 Ashland
- 12.1.7.1. Company Overview
- 12.1.7.2. Products
- 12.1.7.3. Company Financials
- 12.1.7.4. SWOT Analysis
- 12.1.8 DuPont
- 12.1.8.1. Company Overview
- 12.1.8.2. Products
- 12.1.8.3. Company Financials
- 12.1.8.4. SWOT Analysis
- 12.1.9 Dow
- 12.1.9.1. Company Overview
- 12.1.9.2. Products
- 12.1.9.3. Company Financials
- 12.1.9.4. SWOT Analysis
- 12.1.10 Eastman Chemical Company
- 12.1.10.1. Company Overview
- 12.1.10.2. Products
- 12.1.10.3. Company Financials
- 12.1.10.4. SWOT Analysis
- 12.1.11 Daicel Corporation
- 12.1.11.1. Company Overview
- 12.1.11.2. Products
- 12.1.11.3. Company Financials
- 12.1.11.4. SWOT Analysis
- 12.1.12 FKuR
- 12.1.12.1. Company Overview
- 12.1.12.2. Products
- 12.1.12.3. Company Financials
- 12.1.12.4. SWOT Analysis
- 12.1.13 Sappi Limited
- 12.1.13.1. Company Overview
- 12.1.13.2. Products
- 12.1.13.3. Company Financials
- 12.1.13.4. SWOT Analysis
- 12.1.14 Shin-Etsu Chemical Co Ltd
- 12.1.14.1. Company Overview
- 12.1.14.2. Products
- 12.1.14.3. Company Financials
- 12.1.14.4. SWOT Analysis
- 12.1.15 Xinjiang Zhongtai Chemical Co Ltd
- 12.1.15.1. Company Overview
- 12.1.15.2. Products
- 12.1.15.3. Company Financials
- 12.1.15.4. SWOT Analysis
- 12.1.16 Cerdia International GmbH
- 12.1.16.1. Company Overview
- 12.1.16.2. Products
- 12.1.16.3. Company Financials
- 12.1.16.4. SWOT Analysis
- 12.1.1 Nouryon
- 12.2. Market Entropy
- 12.2.1 Company's Key Areas Served
- 12.2.2 Recent Developments
- 12.3. Company Market Share Analysis 2025
- 12.3.1 Top 5 Companies Market Share Analysis
- 12.3.2 Top 3 Companies Market Share Analysis
- 12.4. List of Potential Customers
- 13. Research Methodology
List of Figures
- Figure 1: Global Cellulose Derivatives Industry Revenue Breakdown (billion, %) by Region 2025 & 2033
- Figure 2: Global Cellulose Derivatives Industry Volume Breakdown (K Tons, %) by Region 2025 & 2033
- Figure 3: Asia Pacific Cellulose Derivatives Industry Revenue (billion), by Chemical Type 2025 & 2033
- Figure 4: Asia Pacific Cellulose Derivatives Industry Volume (K Tons), by Chemical Type 2025 & 2033
- Figure 5: Asia Pacific Cellulose Derivatives Industry Revenue Share (%), by Chemical Type 2025 & 2033
- Figure 6: Asia Pacific Cellulose Derivatives Industry Volume Share (%), by Chemical Type 2025 & 2033
- Figure 7: Asia Pacific Cellulose Derivatives Industry Revenue (billion), by End-user Industry 2025 & 2033
- Figure 8: Asia Pacific Cellulose Derivatives Industry Volume (K Tons), by End-user Industry 2025 & 2033
- Figure 9: Asia Pacific Cellulose Derivatives Industry Revenue Share (%), by End-user Industry 2025 & 2033
- Figure 10: Asia Pacific Cellulose Derivatives Industry Volume Share (%), by End-user Industry 2025 & 2033
- Figure 11: Asia Pacific Cellulose Derivatives Industry Revenue (billion), by Country 2025 & 2033
- Figure 12: Asia Pacific Cellulose Derivatives Industry Volume (K Tons), by Country 2025 & 2033
- Figure 13: Asia Pacific Cellulose Derivatives Industry Revenue Share (%), by Country 2025 & 2033
- Figure 14: Asia Pacific Cellulose Derivatives Industry Volume Share (%), by Country 2025 & 2033
- Figure 15: North America Cellulose Derivatives Industry Revenue (billion), by Chemical Type 2025 & 2033
- Figure 16: North America Cellulose Derivatives Industry Volume (K Tons), by Chemical Type 2025 & 2033
- Figure 17: North America Cellulose Derivatives Industry Revenue Share (%), by Chemical Type 2025 & 2033
- Figure 18: North America Cellulose Derivatives Industry Volume Share (%), by Chemical Type 2025 & 2033
- Figure 19: North America Cellulose Derivatives Industry Revenue (billion), by End-user Industry 2025 & 2033
- Figure 20: North America Cellulose Derivatives Industry Volume (K Tons), by End-user Industry 2025 & 2033
- Figure 21: North America Cellulose Derivatives Industry Revenue Share (%), by End-user Industry 2025 & 2033
- Figure 22: North America Cellulose Derivatives Industry Volume Share (%), by End-user Industry 2025 & 2033
- Figure 23: North America Cellulose Derivatives Industry Revenue (billion), by Country 2025 & 2033
- Figure 24: North America Cellulose Derivatives Industry Volume (K Tons), by Country 2025 & 2033
- Figure 25: North America Cellulose Derivatives Industry Revenue Share (%), by Country 2025 & 2033
- Figure 26: North America Cellulose Derivatives Industry Volume Share (%), by Country 2025 & 2033
- Figure 27: Europe Cellulose Derivatives Industry Revenue (billion), by Chemical Type 2025 & 2033
- Figure 28: Europe Cellulose Derivatives Industry Volume (K Tons), by Chemical Type 2025 & 2033
- Figure 29: Europe Cellulose Derivatives Industry Revenue Share (%), by Chemical Type 2025 & 2033
- Figure 30: Europe Cellulose Derivatives Industry Volume Share (%), by Chemical Type 2025 & 2033
- Figure 31: Europe Cellulose Derivatives Industry Revenue (billion), by End-user Industry 2025 & 2033
- Figure 32: Europe Cellulose Derivatives Industry Volume (K Tons), by End-user Industry 2025 & 2033
- Figure 33: Europe Cellulose Derivatives Industry Revenue Share (%), by End-user Industry 2025 & 2033
- Figure 34: Europe Cellulose Derivatives Industry Volume Share (%), by End-user Industry 2025 & 2033
- Figure 35: Europe Cellulose Derivatives Industry Revenue (billion), by Country 2025 & 2033
- Figure 36: Europe Cellulose Derivatives Industry Volume (K Tons), by Country 2025 & 2033
- Figure 37: Europe Cellulose Derivatives Industry Revenue Share (%), by Country 2025 & 2033
- Figure 38: Europe Cellulose Derivatives Industry Volume Share (%), by Country 2025 & 2033
- Figure 39: South America Cellulose Derivatives Industry Revenue (billion), by Chemical Type 2025 & 2033
- Figure 40: South America Cellulose Derivatives Industry Volume (K Tons), by Chemical Type 2025 & 2033
- Figure 41: South America Cellulose Derivatives Industry Revenue Share (%), by Chemical Type 2025 & 2033
- Figure 42: South America Cellulose Derivatives Industry Volume Share (%), by Chemical Type 2025 & 2033
- Figure 43: South America Cellulose Derivatives Industry Revenue (billion), by End-user Industry 2025 & 2033
- Figure 44: South America Cellulose Derivatives Industry Volume (K Tons), by End-user Industry 2025 & 2033
- Figure 45: South America Cellulose Derivatives Industry Revenue Share (%), by End-user Industry 2025 & 2033
- Figure 46: South America Cellulose Derivatives Industry Volume Share (%), by End-user Industry 2025 & 2033
- Figure 47: South America Cellulose Derivatives Industry Revenue (billion), by Country 2025 & 2033
- Figure 48: South America Cellulose Derivatives Industry Volume (K Tons), by Country 2025 & 2033
- Figure 49: South America Cellulose Derivatives Industry Revenue Share (%), by Country 2025 & 2033
- Figure 50: South America Cellulose Derivatives Industry Volume Share (%), by Country 2025 & 2033
- Figure 51: Middle East & Africa Cellulose Derivatives Industry Revenue (billion), by Chemical Type 2025 & 2033
- Figure 52: Middle East & Africa Cellulose Derivatives Industry Volume (K Tons), by Chemical Type 2025 & 2033
- Figure 53: Middle East & Africa Cellulose Derivatives Industry Revenue Share (%), by Chemical Type 2025 & 2033
- Figure 54: Middle East & Africa Cellulose Derivatives Industry Volume Share (%), by Chemical Type 2025 & 2033
- Figure 55: Middle East & Africa Cellulose Derivatives Industry Revenue (billion), by End-user Industry 2025 & 2033
- Figure 56: Middle East & Africa Cellulose Derivatives Industry Volume (K Tons), by End-user Industry 2025 & 2033
- Figure 57: Middle East & Africa Cellulose Derivatives Industry Revenue Share (%), by End-user Industry 2025 & 2033
- Figure 58: Middle East & Africa Cellulose Derivatives Industry Volume Share (%), by End-user Industry 2025 & 2033
- Figure 59: Middle East & Africa Cellulose Derivatives Industry Revenue (billion), by Country 2025 & 2033
- Figure 60: Middle East & Africa Cellulose Derivatives Industry Volume (K Tons), by Country 2025 & 2033
- Figure 61: Middle East & Africa Cellulose Derivatives Industry Revenue Share (%), by Country 2025 & 2033
- Figure 62: Middle East & Africa Cellulose Derivatives Industry Volume Share (%), by Country 2025 & 2033
List of Tables
- Table 1: Global Cellulose Derivatives Industry Revenue billion Forecast, by Chemical Type 2020 & 2033
- Table 2: Global Cellulose Derivatives Industry Volume K Tons Forecast, by Chemical Type 2020 & 2033
- Table 3: Global Cellulose Derivatives Industry Revenue billion Forecast, by End-user Industry 2020 & 2033
- Table 4: Global Cellulose Derivatives Industry Volume K Tons Forecast, by End-user Industry 2020 & 2033
- Table 5: Global Cellulose Derivatives Industry Revenue billion Forecast, by Region 2020 & 2033
- Table 6: Global Cellulose Derivatives Industry Volume K Tons Forecast, by Region 2020 & 2033
- Table 7: Global Cellulose Derivatives Industry Revenue billion Forecast, by Chemical Type 2020 & 2033
- Table 8: Global Cellulose Derivatives Industry Volume K Tons Forecast, by Chemical Type 2020 & 2033
- Table 9: Global Cellulose Derivatives Industry Revenue billion Forecast, by End-user Industry 2020 & 2033
- Table 10: Global Cellulose Derivatives Industry Volume K Tons Forecast, by End-user Industry 2020 & 2033
- Table 11: Global Cellulose Derivatives Industry Revenue billion Forecast, by Country 2020 & 2033
- Table 12: Global Cellulose Derivatives Industry Volume K Tons Forecast, by Country 2020 & 2033
- Table 13: China Cellulose Derivatives Industry Revenue (billion) Forecast, by Application 2020 & 2033
- Table 14: China Cellulose Derivatives Industry Volume (K Tons) Forecast, by Application 2020 & 2033
- Table 15: India Cellulose Derivatives Industry Revenue (billion) Forecast, by Application 2020 & 2033
- Table 16: India Cellulose Derivatives Industry Volume (K Tons) Forecast, by Application 2020 & 2033
- Table 17: Japan Cellulose Derivatives Industry Revenue (billion) Forecast, by Application 2020 & 2033
- Table 18: Japan Cellulose Derivatives Industry Volume (K Tons) Forecast, by Application 2020 & 2033
- Table 19: South Korea Cellulose Derivatives Industry Revenue (billion) Forecast, by Application 2020 & 2033
- Table 20: South Korea Cellulose Derivatives Industry Volume (K Tons) Forecast, by Application 2020 & 2033
- Table 21: Rest of Asia Pacific Cellulose Derivatives Industry Revenue (billion) Forecast, by Application 2020 & 2033
- Table 22: Rest of Asia Pacific Cellulose Derivatives Industry Volume (K Tons) Forecast, by Application 2020 & 2033
- Table 23: Global Cellulose Derivatives Industry Revenue billion Forecast, by Chemical Type 2020 & 2033
- Table 24: Global Cellulose Derivatives Industry Volume K Tons Forecast, by Chemical Type 2020 & 2033
- Table 25: Global Cellulose Derivatives Industry Revenue billion Forecast, by End-user Industry 2020 & 2033
- Table 26: Global Cellulose Derivatives Industry Volume K Tons Forecast, by End-user Industry 2020 & 2033
- Table 27: Global Cellulose Derivatives Industry Revenue billion Forecast, by Country 2020 & 2033
- Table 28: Global Cellulose Derivatives Industry Volume K Tons Forecast, by Country 2020 & 2033
- Table 29: United States Cellulose Derivatives Industry Revenue (billion) Forecast, by Application 2020 & 2033
- Table 30: United States Cellulose Derivatives Industry Volume (K Tons) Forecast, by Application 2020 & 2033
- Table 31: Mexico Cellulose Derivatives Industry Revenue (billion) Forecast, by Application 2020 & 2033
- Table 32: Mexico Cellulose Derivatives Industry Volume (K Tons) Forecast, by Application 2020 & 2033
- Table 33: Canada Cellulose Derivatives Industry Revenue (billion) Forecast, by Application 2020 & 2033
- Table 34: Canada Cellulose Derivatives Industry Volume (K Tons) Forecast, by Application 2020 & 2033
- Table 35: Global Cellulose Derivatives Industry Revenue billion Forecast, by Chemical Type 2020 & 2033
- Table 36: Global Cellulose Derivatives Industry Volume K Tons Forecast, by Chemical Type 2020 & 2033
- Table 37: Global Cellulose Derivatives Industry Revenue billion Forecast, by End-user Industry 2020 & 2033
- Table 38: Global Cellulose Derivatives Industry Volume K Tons Forecast, by End-user Industry 2020 & 2033
- Table 39: Global Cellulose Derivatives Industry Revenue billion Forecast, by Country 2020 & 2033
- Table 40: Global Cellulose Derivatives Industry Volume K Tons Forecast, by Country 2020 & 2033
- Table 41: Germany Cellulose Derivatives Industry Revenue (billion) Forecast, by Application 2020 & 2033
- Table 42: Germany Cellulose Derivatives Industry Volume (K Tons) Forecast, by Application 2020 & 2033
- Table 43: United Kingdom Cellulose Derivatives Industry Revenue (billion) Forecast, by Application 2020 & 2033
- Table 44: United Kingdom Cellulose Derivatives Industry Volume (K Tons) Forecast, by Application 2020 & 2033
- Table 45: Italy Cellulose Derivatives Industry Revenue (billion) Forecast, by Application 2020 & 2033
- Table 46: Italy Cellulose Derivatives Industry Volume (K Tons) Forecast, by Application 2020 & 2033
- Table 47: France Cellulose Derivatives Industry Revenue (billion) Forecast, by Application 2020 & 2033
- Table 48: France Cellulose Derivatives Industry Volume (K Tons) Forecast, by Application 2020 & 2033
- Table 49: Rest of Europe Cellulose Derivatives Industry Revenue (billion) Forecast, by Application 2020 & 2033
- Table 50: Rest of Europe Cellulose Derivatives Industry Volume (K Tons) Forecast, by Application 2020 & 2033
- Table 51: Global Cellulose Derivatives Industry Revenue billion Forecast, by Chemical Type 2020 & 2033
- Table 52: Global Cellulose Derivatives Industry Volume K Tons Forecast, by Chemical Type 2020 & 2033
- Table 53: Global Cellulose Derivatives Industry Revenue billion Forecast, by End-user Industry 2020 & 2033
- Table 54: Global Cellulose Derivatives Industry Volume K Tons Forecast, by End-user Industry 2020 & 2033
- Table 55: Global Cellulose Derivatives Industry Revenue billion Forecast, by Country 2020 & 2033
- Table 56: Global Cellulose Derivatives Industry Volume K Tons Forecast, by Country 2020 & 2033
- Table 57: Brazil Cellulose Derivatives Industry Revenue (billion) Forecast, by Application 2020 & 2033
- Table 58: Brazil Cellulose Derivatives Industry Volume (K Tons) Forecast, by Application 2020 & 2033
- Table 59: Argentina Cellulose Derivatives Industry Revenue (billion) Forecast, by Application 2020 & 2033
- Table 60: Argentina Cellulose Derivatives Industry Volume (K Tons) Forecast, by Application 2020 & 2033
- Table 61: Rest of South America Cellulose Derivatives Industry Revenue (billion) Forecast, by Application 2020 & 2033
- Table 62: Rest of South America Cellulose Derivatives Industry Volume (K Tons) Forecast, by Application 2020 & 2033
- Table 63: Global Cellulose Derivatives Industry Revenue billion Forecast, by Chemical Type 2020 & 2033
- Table 64: Global Cellulose Derivatives Industry Volume K Tons Forecast, by Chemical Type 2020 & 2033
- Table 65: Global Cellulose Derivatives Industry Revenue billion Forecast, by End-user Industry 2020 & 2033
- Table 66: Global Cellulose Derivatives Industry Volume K Tons Forecast, by End-user Industry 2020 & 2033
- Table 67: Global Cellulose Derivatives Industry Revenue billion Forecast, by Country 2020 & 2033
- Table 68: Global Cellulose Derivatives Industry Volume K Tons Forecast, by Country 2020 & 2033
- Table 69: UAE Cellulose Derivatives Industry Revenue (billion) Forecast, by Application 2020 & 2033
- Table 70: UAE Cellulose Derivatives Industry Volume (K Tons) Forecast, by Application 2020 & 2033
- Table 71: Saudi Arabia Cellulose Derivatives Industry Revenue (billion) Forecast, by Application 2020 & 2033
- Table 72: Saudi Arabia Cellulose Derivatives Industry Volume (K Tons) Forecast, by Application 2020 & 2033
- Table 73: South Africa Cellulose Derivatives Industry Revenue (billion) Forecast, by Application 2020 & 2033
- Table 74: South Africa Cellulose Derivatives Industry Volume (K Tons) Forecast, by Application 2020 & 2033
- Table 75: Rest of Middle East & Africa Cellulose Derivatives Industry Revenue (billion) Forecast, by Application 2020 & 2033
- Table 76: Rest of Middle East & Africa Cellulose Derivatives Industry Volume (K Tons) Forecast, by Application 2020 & 2033
Frequently Asked Questions
1. What is the projected Compound Annual Growth Rate (CAGR) of the Cellulose Derivatives Industry?
The projected CAGR is approximately 6.6%.
2. Which companies are prominent players in the Cellulose Derivatives Industry?
Key companies in the market include Nouryon, Mitsubishi Chemical Corporation, Celanese Corporation, Grasim (Aditya Birla Group), Lenzing AG, Futamura Chemical Co Ltd, Ashland, DuPont, Dow, Eastman Chemical Company, Daicel Corporation, FKuR, Sappi Limited, Shin-Etsu Chemical Co Ltd, Xinjiang Zhongtai Chemical Co Ltd, Cerdia International GmbH.
3. What are the main segments of the Cellulose Derivatives Industry?
The market segments include Chemical Type, End-user Industry.
4. Can you provide details about the market size?
The market size is estimated to be USD 6.73 billion as of 2022.
5. What are some drivers contributing to market growth?
Increasing Demand from Pharmaceutical Industry; Increasing Use of Cellulose Ether in Building and Construction Industry; Other Drivers.
6. What are the notable trends driving market growth?
Food and Beverage Industry to Dominate the Market.
7. Are there any restraints impacting market growth?
Competition of Regenerated Cellulose Fibers from Synthetic Fibers and Other Protein-based Fibers; Other Restraints.
8. Can you provide examples of recent developments in the market?
N/A
9. What pricing options are available for accessing the report?
Pricing options include single-user, multi-user, and enterprise licenses priced at USD 4750, USD 5250, and USD 8750 respectively.
10. Is the market size provided in terms of value or volume?
The market size is provided in terms of value, measured in billion and volume, measured in K Tons.
11. Are there any specific market keywords associated with the report?
Yes, the market keyword associated with the report is "Cellulose Derivatives Industry," which aids in identifying and referencing the specific market segment covered.
12. How do I determine which pricing option suits my needs best?
The pricing options vary based on user requirements and access needs. Individual users may opt for single-user licenses, while businesses requiring broader access may choose multi-user or enterprise licenses for cost-effective access to the report.
13. Are there any additional resources or data provided in the Cellulose Derivatives Industry report?
While the report offers comprehensive insights, it's advisable to review the specific contents or supplementary materials provided to ascertain if additional resources or data are available.
14. How can I stay updated on further developments or reports in the Cellulose Derivatives Industry?
To stay informed about further developments, trends, and reports in the Cellulose Derivatives Industry, consider subscribing to industry newsletters, following relevant companies and organizations, or regularly checking reputable industry news sources and publications.
Methodology
Step 1 - Identification of Relevant Samples Size from Population Database


Step 2 - Approaches for Defining Global Market Size (Value, Volume* & Price*)

Note*: In applicable scenarios
Step 3 - Data Sources
Primary Research
- Web Analytics
- Survey Reports
- Research Institute
- Latest Research Reports
- Opinion Leaders
Secondary Research
- Annual Reports
- White Paper
- Latest Press Release
- Industry Association
- Paid Database
- Investor Presentations

Step 4 - Data Triangulation
Involves using different sources of information in order to increase the validity of a study
These sources are likely to be stakeholders in a program - participants, other researchers, program staff, other community members, and so on.
Then we put all data in single framework & apply various statistical tools to find out the dynamic on the market.
During the analysis stage, feedback from the stakeholder groups would be compared to determine areas of agreement as well as areas of divergence

