Future Trends Shaping Cashew Industry Growth

Cashew Industry by Production Analysis, by Consumption Analysis, by Import Market Analysis (Value & Volume), by Export Market Analysis (Value & Volume), by Price Trend Analysis, by North America (United States, Canada, Mexico), by South America (Brazil, Argentina, Rest of South America), by Europe (United Kingdom, Germany, France, Italy, Spain, Russia, Benelux, Nordics, Rest of Europe), by Middle East & Africa (Turkey, Israel, GCC, North Africa, South Africa, Rest of Middle East & Africa), by Asia Pacific (China, India, Japan, South Korea, ASEAN, Oceania, Rest of Asia Pacific) Forecast 2025-2033

Jun 29 2025
Base Year: 2024

180 Pages
Main Logo

Future Trends Shaping Cashew Industry Growth


Home
Industries
Agriculture
sponsor image

Tailored for you

  • In-depth Analysis Tailored to Specified Regions or Segments
  • Company Profiles Customized to User Preferences
  • Comprehensive Insights Focused on Specific Segments or Regions
  • Customized Evaluation of Competitive Landscape to Meet Your Needs
  • Tailored Customization to Address Other Specific Requirements
Ask for customization


Key Insights

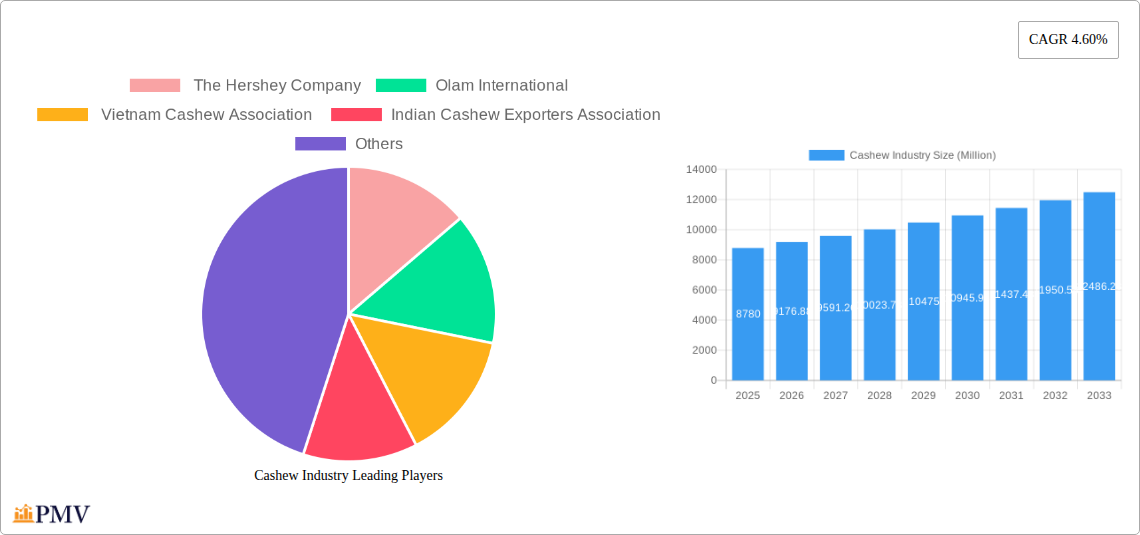
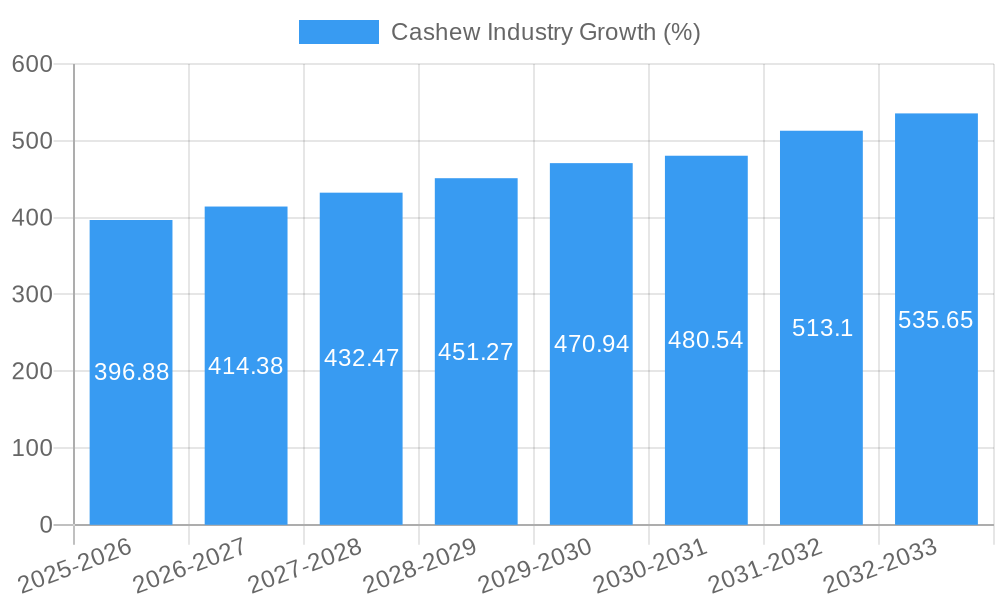
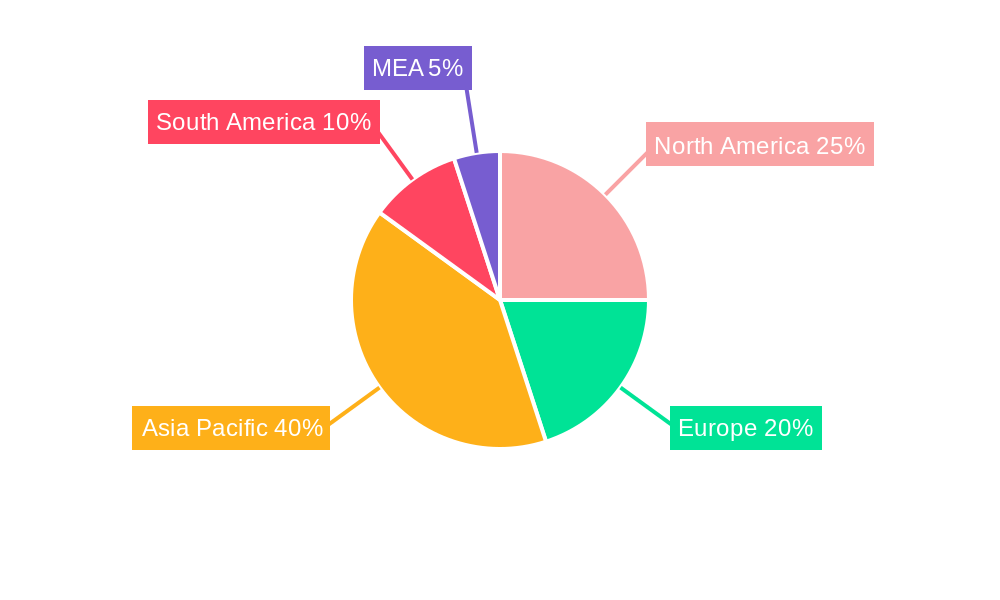
The global cashew industry, valued at $8.78 billion in 2025, is projected to experience robust growth, driven by increasing consumer demand for nutritious snacks and the rising popularity of cashew-based products in various food and beverage applications. The Compound Annual Growth Rate (CAGR) of 4.60% from 2025 to 2033 indicates a significant expansion of the market over the forecast period. Key drivers include the growing health-conscious population seeking plant-based protein sources and the increasing adoption of cashews in confectionery, bakery items, and dairy alternatives. Furthermore, innovations in processing and packaging technologies are enhancing the shelf life and convenience of cashew products, contributing to market growth. While supply chain challenges and price fluctuations remain potential restraints, the industry is expected to overcome these hurdles through efficient sourcing strategies and diversification of production regions. Strong regional growth is anticipated across North America, Asia-Pacific, and Europe, driven by rising disposable incomes and changing dietary preferences. Major players like The Hershey Company and Olam International are strategically investing in expanding their cashew production and distribution networks to capitalize on this growing market opportunity. The industry's segmentation likely includes various product forms (whole cashews, cashew butter, cashew milk, etc.) and processing methods, each influencing market dynamics and growth trajectories.

The competitive landscape is characterized by a blend of large multinational corporations and regional players. The presence of industry associations like the Vietnam Cashew Association and the Indian Cashew Exporters Association indicates a focus on promoting the industry and addressing challenges collectively. Future growth will depend on factors such as sustainable sourcing practices, increased investment in research and development for innovative cashew-based products, and effective marketing strategies to cater to evolving consumer preferences. Maintaining supply chain resilience and addressing environmental concerns related to cashew production will be crucial for the long-term success and sustainability of the industry. The estimated market size in 2033 can be projected based on the CAGR, resulting in a significant expansion over the forecast period, making it an attractive investment opportunity for both established and emerging players.

Cashew Industry Research Report - Market Size, Growth & Forecast

Comprehensive Cashew Industry Report: 2019-2033

This in-depth report provides a comprehensive analysis of the global cashew industry, offering invaluable insights for stakeholders seeking to navigate this dynamic market. Covering the period from 2019 to 2033, with a focus on 2025, this report leverages rigorous research methodologies to deliver actionable intelligence. The report includes forecasts for market size reaching xx Million by 2033, driven by robust growth in key segments.

Cashew Industry Market Structure & Competitive Dynamics

The global cashew market exhibits a moderately concentrated structure, with several key players holding significant market share. The Hershey Company, Olam International, and numerous regional associations like the Vietnam Cashew Association and Indian Cashew Exporters Association, play pivotal roles. Market concentration is influenced by factors such as economies of scale in processing and distribution, brand recognition, and access to raw materials.

Innovation Ecosystems: The industry is witnessing increased innovation in processing technologies aimed at improving efficiency and product quality. Furthermore, the growing focus on sustainable sourcing and ethical production practices is fostering the development of innovative supply chain solutions.

Regulatory Frameworks: Varying regulations across countries regarding import/export, food safety, and labeling significantly impact market dynamics. Compliance costs and trade barriers can present challenges for both established players and new entrants.

Product Substitutes: Competitors to cashews include other nuts and confectionery products. The market share of these substitutes is estimated at xx Million in 2025, representing a significant competitive pressure.

End-User Trends: The increasing demand for healthy snacks and the rise in global disposable incomes are driving cashew consumption. Health-conscious consumers are increasingly seeking natural, minimally processed cashew products.

M&A Activities: The cashew industry has witnessed notable M&A activity in recent years, driven by companies seeking to expand their market reach and enhance their product portfolios. Total M&A deal value over the historical period (2019-2024) is estimated at xx Million. Key deals included acquisitions focusing on securing raw material supplies and expanding processing capacity. Market share dynamics are significantly impacted by such activities, leading to a more concentrated industry structure over time.

Cashew Industry Industry Trends & Insights

The global cashew industry is experiencing robust growth, driven by several key factors. The Compound Annual Growth Rate (CAGR) is projected to be xx% during the forecast period (2025-2033), resulting in a market value exceeding xx Million by 2033.

Market growth is primarily fueled by rising global demand, particularly in emerging economies. Consumer preferences are shifting towards healthier snacking options, creating a favorable environment for cashew consumption. Technological advancements in cashew processing are enhancing efficiency and quality, leading to improved product availability and affordability. However, fluctuating raw material prices and supply chain disruptions represent ongoing challenges for industry players. Market penetration of cashews as a snack is estimated to reach xx% by 2033, reflecting its increasing popularity among consumers. Competitive dynamics are largely shaped by pricing strategies, brand loyalty, and the ability to access high-quality raw materials.

Cashew Industry Growth

Dominant Markets & Segments in Cashew Industry

Vietnam and India are currently the leading cashew-producing countries, dominating the global market. Their dominance stems from:

  • Favorable climatic conditions: Ideal growing environments for cashew trees are prevalent in these regions.
  • Established agricultural infrastructure: Well-developed farming practices and processing capabilities contribute to large-scale production.
  • Government support and policies: Government initiatives aimed at promoting cashew cultivation and exports have played a crucial role.
  • Abundant and affordable labor: This helps keep production costs comparatively low, enhancing global competitiveness.

Vietnam's market share is estimated to be xx% in 2025, while India holds a xx% share. The processing and export segments within these countries are highly developed, bolstering their leading positions. The dominance of these two countries is expected to continue in the forecast period.

Cashew Industry Product Innovations

Recent product innovations focus on enhancing convenience and catering to diverse consumer preferences. This includes the introduction of roasted, flavored, and packaged cashew products, appealing to a broad consumer base. Furthermore, technological advancements in processing techniques are yielding higher-quality products with extended shelf life. The growing demand for organic and sustainable cashews is also driving innovation in farming practices and supply chain management.

Report Segmentation & Scope

The report segments the cashew market by:

  • Product type: Whole cashews, cashew pieces, cashew butter, cashew milk, and other cashew-derived products. Each segment exhibits distinct growth trajectories, influenced by consumer demand and product pricing.
  • Distribution channel: Retail, food service, online channels. Growth projections within each segment are analyzed considering evolving consumer behaviors and distribution network dynamics.
  • Region: North America, Europe, Asia-Pacific, Middle East & Africa, Latin America. Regional differences in consumer preferences and market maturity influence growth projections. Detailed competitive landscape analysis is provided for each region.

Key Drivers of Cashew Industry Growth

Key drivers for cashew industry growth include increasing global demand for healthy snacks, rising disposable incomes in developing countries, and the growing adoption of convenient packaged cashew products. Technological advancements in processing efficiency, improved supply chain management, and favorable government policies further enhance market growth.

Challenges in the Cashew Industry Sector

Challenges facing the cashew industry include fluctuating raw material prices, potential supply chain disruptions, and intense competition from substitute products. Furthermore, stringent regulatory requirements and concerns about sustainability may impact industry profitability. These factors necessitate strategic planning and adaptability by industry players.

Leading Players in the Cashew Industry Market

  • The Hershey Company
  • Olam International
  • Vietnam Cashew Association
  • Indian Cashew Exporters Association

Key Developments in Cashew Industry Sector

  • 2022 Q3: Olam International announces a significant investment in its cashew processing facilities in Vietnam.
  • 2023 Q1: The Vietnam Cashew Association launches a new sustainability initiative to improve ethical sourcing practices.
  • 2024 Q4: The Hershey Company introduces a new line of organic cashew-based snacks.

Strategic Cashew Industry Market Outlook

The cashew industry is poised for continued growth, driven by positive consumer trends, technological advancements, and strategic investments by key players. Opportunities exist for companies to expand into new markets, develop innovative products, and improve supply chain efficiencies to enhance profitability and market share. The focus on sustainability and ethical sourcing will be critical for long-term success in this evolving industry.

Cashew Industry Segmentation

  • 1. Production Analysis
  • 2. Consumption Analysis
  • 3. Import Market Analysis (Value & Volume)
  • 4. Export Market Analysis (Value & Volume)
  • 5. Price Trend Analysis

Cashew Industry Segmentation By Geography

  • 1. North America
    • 1.1. United States
    • 1.2. Canada
    • 1.3. Mexico
  • 2. South America
    • 2.1. Brazil
    • 2.2. Argentina
    • 2.3. Rest of South America
  • 3. Europe
    • 3.1. United Kingdom
    • 3.2. Germany
    • 3.3. France
    • 3.4. Italy
    • 3.5. Spain
    • 3.6. Russia
    • 3.7. Benelux
    • 3.8. Nordics
    • 3.9. Rest of Europe
  • 4. Middle East & Africa
    • 4.1. Turkey
    • 4.2. Israel
    • 4.3. GCC
    • 4.4. North Africa
    • 4.5. South Africa
    • 4.6. Rest of Middle East & Africa
  • 5. Asia Pacific
    • 5.1. China
    • 5.2. India
    • 5.3. Japan
    • 5.4. South Korea
    • 5.5. ASEAN
    • 5.6. Oceania
    • 5.7. Rest of Asia Pacific
Cashew Industry Regional Share


Cashew Industry REPORT HIGHLIGHTS

AspectsDetails
Study Period 2019-2033
Base Year 2024
Estimated Year 2025
Forecast Period2025-2033
Historical Period2019-2024
Growth RateCAGR of 4.60% from 2019-2033
Segmentation
    • By Production Analysis
    • By Consumption Analysis
    • By Import Market Analysis (Value & Volume)
    • By Export Market Analysis (Value & Volume)
    • By Price Trend Analysis
  • By Geography
    • North America
      • United States
      • Canada
      • Mexico
    • South America
      • Brazil
      • Argentina
      • Rest of South America
    • Europe
      • United Kingdom
      • Germany
      • France
      • Italy
      • Spain
      • Russia
      • Benelux
      • Nordics
      • Rest of Europe
    • Middle East & Africa
      • Turkey
      • Israel
      • GCC
      • North Africa
      • South Africa
      • Rest of Middle East & Africa
    • Asia Pacific
      • China
      • India
      • Japan
      • South Korea
      • ASEAN
      • Oceania
      • Rest of Asia Pacific


Table of Contents

  1. 1. Introduction
    • 1.1. Research Scope
    • 1.2. Market Segmentation
    • 1.3. Research Methodology
    • 1.4. Definitions and Assumptions
  2. 2. Executive Summary
    • 2.1. Introduction
  3. 3. Market Dynamics
    • 3.1. Introduction
      • 3.2. Market Drivers
        • 3.2.1. Rising Consumption of Cashew Nuts as a Healthy Snack; Increasing Government initiatives; Growing Cashew Nut Imports in The United States
      • 3.3. Market Restrains
        • 3.3.1. Hazardous Climatic Condition Hinders Cashew Production; Stringent Regulations Related To Food Quality Standards
      • 3.4. Market Trends
        • 3.4.1. Increasing Government Initiatives to Boost Cashew Production
  4. 4. Market Factor Analysis
    • 4.1. Porters Five Forces
    • 4.2. Supply/Value Chain
    • 4.3. PESTEL analysis
    • 4.4. Market Entropy
    • 4.5. Patent/Trademark Analysis
  5. 5. Global Cashew Industry Analysis, Insights and Forecast, 2019-2031
    • 5.1. Market Analysis, Insights and Forecast - by Production Analysis
      • 5.2. Market Analysis, Insights and Forecast - by Consumption Analysis
        • 5.3. Market Analysis, Insights and Forecast - by Import Market Analysis (Value & Volume)
          • 5.4. Market Analysis, Insights and Forecast - by Export Market Analysis (Value & Volume)
            • 5.5. Market Analysis, Insights and Forecast - by Price Trend Analysis
              • 5.6. Market Analysis, Insights and Forecast - by Region
                • 5.6.1. North America
                • 5.6.2. South America
                • 5.6.3. Europe
                • 5.6.4. Middle East & Africa
                • 5.6.5. Asia Pacific
            • 6. North America Cashew Industry Analysis, Insights and Forecast, 2019-2031
              • 6.1. Market Analysis, Insights and Forecast - by Production Analysis
                • 6.2. Market Analysis, Insights and Forecast - by Consumption Analysis
                  • 6.3. Market Analysis, Insights and Forecast - by Import Market Analysis (Value & Volume)
                    • 6.4. Market Analysis, Insights and Forecast - by Export Market Analysis (Value & Volume)
                      • 6.5. Market Analysis, Insights and Forecast - by Price Trend Analysis
                      • 7. South America Cashew Industry Analysis, Insights and Forecast, 2019-2031
                        • 7.1. Market Analysis, Insights and Forecast - by Production Analysis
                          • 7.2. Market Analysis, Insights and Forecast - by Consumption Analysis
                            • 7.3. Market Analysis, Insights and Forecast - by Import Market Analysis (Value & Volume)
                              • 7.4. Market Analysis, Insights and Forecast - by Export Market Analysis (Value & Volume)
                                • 7.5. Market Analysis, Insights and Forecast - by Price Trend Analysis
                                • 8. Europe Cashew Industry Analysis, Insights and Forecast, 2019-2031
                                  • 8.1. Market Analysis, Insights and Forecast - by Production Analysis
                                    • 8.2. Market Analysis, Insights and Forecast - by Consumption Analysis
                                      • 8.3. Market Analysis, Insights and Forecast - by Import Market Analysis (Value & Volume)
                                        • 8.4. Market Analysis, Insights and Forecast - by Export Market Analysis (Value & Volume)
                                          • 8.5. Market Analysis, Insights and Forecast - by Price Trend Analysis
                                          • 9. Middle East & Africa Cashew Industry Analysis, Insights and Forecast, 2019-2031
                                            • 9.1. Market Analysis, Insights and Forecast - by Production Analysis
                                              • 9.2. Market Analysis, Insights and Forecast - by Consumption Analysis
                                                • 9.3. Market Analysis, Insights and Forecast - by Import Market Analysis (Value & Volume)
                                                  • 9.4. Market Analysis, Insights and Forecast - by Export Market Analysis (Value & Volume)
                                                    • 9.5. Market Analysis, Insights and Forecast - by Price Trend Analysis
                                                    • 10. Asia Pacific Cashew Industry Analysis, Insights and Forecast, 2019-2031
                                                      • 10.1. Market Analysis, Insights and Forecast - by Production Analysis
                                                        • 10.2. Market Analysis, Insights and Forecast - by Consumption Analysis
                                                          • 10.3. Market Analysis, Insights and Forecast - by Import Market Analysis (Value & Volume)
                                                            • 10.4. Market Analysis, Insights and Forecast - by Export Market Analysis (Value & Volume)
                                                              • 10.5. Market Analysis, Insights and Forecast - by Price Trend Analysis
                                                              • 11. South America Cashew Industry Analysis, Insights and Forecast, 2019-2031
                                                                  • 11.1. Market Analysis, Insights and Forecast - By Country/Sub-region
                                                                    • 11.1.1 Brazil
                                                                    • 11.1.2 Argentina
                                                                    • 11.1.3 Rest of South America
                                                              • 12. North America Cashew Industry Analysis, Insights and Forecast, 2019-2031
                                                                  • 12.1. Market Analysis, Insights and Forecast - By Country/Sub-region
                                                                    • 12.1.1 United States
                                                                    • 12.1.2 Canada
                                                                    • 12.1.3 Mexico
                                                              • 13. Asia Pacific Cashew Industry Analysis, Insights and Forecast, 2019-2031
                                                                  • 13.1. Market Analysis, Insights and Forecast - By Country/Sub-region
                                                                    • 13.1.1 China
                                                                    • 13.1.2 Japan
                                                                    • 13.1.3 India
                                                                    • 13.1.4 South Korea
                                                                    • 13.1.5 Taiwan
                                                                    • 13.1.6 Australia
                                                                    • 13.1.7 Rest of Asia-Pacific
                                                              • 14. Europe Cashew Industry Analysis, Insights and Forecast, 2019-2031
                                                                  • 14.1. Market Analysis, Insights and Forecast - By Country/Sub-region
                                                                    • 14.1.1 Germany
                                                                    • 14.1.2 France
                                                                    • 14.1.3 Italy
                                                                    • 14.1.4 United Kingdom
                                                                    • 14.1.5 Netherlands
                                                                    • 14.1.6 Rest of Europe
                                                              • 15. MEA Cashew Industry Analysis, Insights and Forecast, 2019-2031
                                                                  • 15.1. Market Analysis, Insights and Forecast - By Country/Sub-region
                                                                    • 15.1.1 Middle East
                                                                    • 15.1.2 Africa
                                                              • 16. Competitive Analysis
                                                                • 16.1. Global Market Share Analysis 2024
                                                                  • 16.2. Company Profiles
                                                                    • 16.2.1 The Hershey Company
                                                                      • 16.2.1.1. Overview
                                                                      • 16.2.1.2. Products
                                                                      • 16.2.1.3. SWOT Analysis
                                                                      • 16.2.1.4. Recent Developments
                                                                      • 16.2.1.5. Financials (Based on Availability)
                                                                    • 16.2.2 Olam International
                                                                      • 16.2.2.1. Overview
                                                                      • 16.2.2.2. Products
                                                                      • 16.2.2.3. SWOT Analysis
                                                                      • 16.2.2.4. Recent Developments
                                                                      • 16.2.2.5. Financials (Based on Availability)
                                                                    • 16.2.3 Vietnam Cashew Association
                                                                      • 16.2.3.1. Overview
                                                                      • 16.2.3.2. Products
                                                                      • 16.2.3.3. SWOT Analysis
                                                                      • 16.2.3.4. Recent Developments
                                                                      • 16.2.3.5. Financials (Based on Availability)
                                                                    • 16.2.4 Indian Cashew Exporters Association
                                                                      • 16.2.4.1. Overview
                                                                      • 16.2.4.2. Products
                                                                      • 16.2.4.3. SWOT Analysis
                                                                      • 16.2.4.4. Recent Developments
                                                                      • 16.2.4.5. Financials (Based on Availability)

                                                              List of Figures

                                                              1. Figure 1: Global Cashew Industry Revenue Breakdown (Million, %) by Region 2024 & 2032
                                                              2. Figure 2: Global Cashew Industry Volume Breakdown (Metric Tons, %) by Region 2024 & 2032
                                                              3. Figure 3: South America Cashew Industry Revenue (Million), by Country 2024 & 2032
                                                              4. Figure 4: South America Cashew Industry Volume (Metric Tons), by Country 2024 & 2032
                                                              5. Figure 5: South America Cashew Industry Revenue Share (%), by Country 2024 & 2032
                                                              6. Figure 6: South America Cashew Industry Volume Share (%), by Country 2024 & 2032
                                                              7. Figure 7: North America Cashew Industry Revenue (Million), by Country 2024 & 2032
                                                              8. Figure 8: North America Cashew Industry Volume (Metric Tons), by Country 2024 & 2032
                                                              9. Figure 9: North America Cashew Industry Revenue Share (%), by Country 2024 & 2032
                                                              10. Figure 10: North America Cashew Industry Volume Share (%), by Country 2024 & 2032
                                                              11. Figure 11: Asia Pacific Cashew Industry Revenue (Million), by Country 2024 & 2032
                                                              12. Figure 12: Asia Pacific Cashew Industry Volume (Metric Tons), by Country 2024 & 2032
                                                              13. Figure 13: Asia Pacific Cashew Industry Revenue Share (%), by Country 2024 & 2032
                                                              14. Figure 14: Asia Pacific Cashew Industry Volume Share (%), by Country 2024 & 2032
                                                              15. Figure 15: Europe Cashew Industry Revenue (Million), by Country 2024 & 2032
                                                              16. Figure 16: Europe Cashew Industry Volume (Metric Tons), by Country 2024 & 2032
                                                              17. Figure 17: Europe Cashew Industry Revenue Share (%), by Country 2024 & 2032
                                                              18. Figure 18: Europe Cashew Industry Volume Share (%), by Country 2024 & 2032
                                                              19. Figure 19: MEA Cashew Industry Revenue (Million), by Country 2024 & 2032
                                                              20. Figure 20: MEA Cashew Industry Volume (Metric Tons), by Country 2024 & 2032
                                                              21. Figure 21: MEA Cashew Industry Revenue Share (%), by Country 2024 & 2032
                                                              22. Figure 22: MEA Cashew Industry Volume Share (%), by Country 2024 & 2032
                                                              23. Figure 23: North America Cashew Industry Revenue (Million), by Production Analysis 2024 & 2032
                                                              24. Figure 24: North America Cashew Industry Volume (Metric Tons), by Production Analysis 2024 & 2032
                                                              25. Figure 25: North America Cashew Industry Revenue Share (%), by Production Analysis 2024 & 2032
                                                              26. Figure 26: North America Cashew Industry Volume Share (%), by Production Analysis 2024 & 2032
                                                              27. Figure 27: North America Cashew Industry Revenue (Million), by Consumption Analysis 2024 & 2032
                                                              28. Figure 28: North America Cashew Industry Volume (Metric Tons), by Consumption Analysis 2024 & 2032
                                                              29. Figure 29: North America Cashew Industry Revenue Share (%), by Consumption Analysis 2024 & 2032
                                                              30. Figure 30: North America Cashew Industry Volume Share (%), by Consumption Analysis 2024 & 2032
                                                              31. Figure 31: North America Cashew Industry Revenue (Million), by Import Market Analysis (Value & Volume) 2024 & 2032
                                                              32. Figure 32: North America Cashew Industry Volume (Metric Tons), by Import Market Analysis (Value & Volume) 2024 & 2032
                                                              33. Figure 33: North America Cashew Industry Revenue Share (%), by Import Market Analysis (Value & Volume) 2024 & 2032
                                                              34. Figure 34: North America Cashew Industry Volume Share (%), by Import Market Analysis (Value & Volume) 2024 & 2032
                                                              35. Figure 35: North America Cashew Industry Revenue (Million), by Export Market Analysis (Value & Volume) 2024 & 2032
                                                              36. Figure 36: North America Cashew Industry Volume (Metric Tons), by Export Market Analysis (Value & Volume) 2024 & 2032
                                                              37. Figure 37: North America Cashew Industry Revenue Share (%), by Export Market Analysis (Value & Volume) 2024 & 2032
                                                              38. Figure 38: North America Cashew Industry Volume Share (%), by Export Market Analysis (Value & Volume) 2024 & 2032
                                                              39. Figure 39: North America Cashew Industry Revenue (Million), by Price Trend Analysis 2024 & 2032
                                                              40. Figure 40: North America Cashew Industry Volume (Metric Tons), by Price Trend Analysis 2024 & 2032
                                                              41. Figure 41: North America Cashew Industry Revenue Share (%), by Price Trend Analysis 2024 & 2032
                                                              42. Figure 42: North America Cashew Industry Volume Share (%), by Price Trend Analysis 2024 & 2032
                                                              43. Figure 43: North America Cashew Industry Revenue (Million), by Country 2024 & 2032
                                                              44. Figure 44: North America Cashew Industry Volume (Metric Tons), by Country 2024 & 2032
                                                              45. Figure 45: North America Cashew Industry Revenue Share (%), by Country 2024 & 2032
                                                              46. Figure 46: North America Cashew Industry Volume Share (%), by Country 2024 & 2032
                                                              47. Figure 47: South America Cashew Industry Revenue (Million), by Production Analysis 2024 & 2032
                                                              48. Figure 48: South America Cashew Industry Volume (Metric Tons), by Production Analysis 2024 & 2032
                                                              49. Figure 49: South America Cashew Industry Revenue Share (%), by Production Analysis 2024 & 2032
                                                              50. Figure 50: South America Cashew Industry Volume Share (%), by Production Analysis 2024 & 2032
                                                              51. Figure 51: South America Cashew Industry Revenue (Million), by Consumption Analysis 2024 & 2032
                                                              52. Figure 52: South America Cashew Industry Volume (Metric Tons), by Consumption Analysis 2024 & 2032
                                                              53. Figure 53: South America Cashew Industry Revenue Share (%), by Consumption Analysis 2024 & 2032
                                                              54. Figure 54: South America Cashew Industry Volume Share (%), by Consumption Analysis 2024 & 2032
                                                              55. Figure 55: South America Cashew Industry Revenue (Million), by Import Market Analysis (Value & Volume) 2024 & 2032
                                                              56. Figure 56: South America Cashew Industry Volume (Metric Tons), by Import Market Analysis (Value & Volume) 2024 & 2032
                                                              57. Figure 57: South America Cashew Industry Revenue Share (%), by Import Market Analysis (Value & Volume) 2024 & 2032
                                                              58. Figure 58: South America Cashew Industry Volume Share (%), by Import Market Analysis (Value & Volume) 2024 & 2032
                                                              59. Figure 59: South America Cashew Industry Revenue (Million), by Export Market Analysis (Value & Volume) 2024 & 2032
                                                              60. Figure 60: South America Cashew Industry Volume (Metric Tons), by Export Market Analysis (Value & Volume) 2024 & 2032
                                                              61. Figure 61: South America Cashew Industry Revenue Share (%), by Export Market Analysis (Value & Volume) 2024 & 2032
                                                              62. Figure 62: South America Cashew Industry Volume Share (%), by Export Market Analysis (Value & Volume) 2024 & 2032
                                                              63. Figure 63: South America Cashew Industry Revenue (Million), by Price Trend Analysis 2024 & 2032
                                                              64. Figure 64: South America Cashew Industry Volume (Metric Tons), by Price Trend Analysis 2024 & 2032
                                                              65. Figure 65: South America Cashew Industry Revenue Share (%), by Price Trend Analysis 2024 & 2032
                                                              66. Figure 66: South America Cashew Industry Volume Share (%), by Price Trend Analysis 2024 & 2032
                                                              67. Figure 67: South America Cashew Industry Revenue (Million), by Country 2024 & 2032
                                                              68. Figure 68: South America Cashew Industry Volume (Metric Tons), by Country 2024 & 2032
                                                              69. Figure 69: South America Cashew Industry Revenue Share (%), by Country 2024 & 2032
                                                              70. Figure 70: South America Cashew Industry Volume Share (%), by Country 2024 & 2032
                                                              71. Figure 71: Europe Cashew Industry Revenue (Million), by Production Analysis 2024 & 2032
                                                              72. Figure 72: Europe Cashew Industry Volume (Metric Tons), by Production Analysis 2024 & 2032
                                                              73. Figure 73: Europe Cashew Industry Revenue Share (%), by Production Analysis 2024 & 2032
                                                              74. Figure 74: Europe Cashew Industry Volume Share (%), by Production Analysis 2024 & 2032
                                                              75. Figure 75: Europe Cashew Industry Revenue (Million), by Consumption Analysis 2024 & 2032
                                                              76. Figure 76: Europe Cashew Industry Volume (Metric Tons), by Consumption Analysis 2024 & 2032
                                                              77. Figure 77: Europe Cashew Industry Revenue Share (%), by Consumption Analysis 2024 & 2032
                                                              78. Figure 78: Europe Cashew Industry Volume Share (%), by Consumption Analysis 2024 & 2032
                                                              79. Figure 79: Europe Cashew Industry Revenue (Million), by Import Market Analysis (Value & Volume) 2024 & 2032
                                                              80. Figure 80: Europe Cashew Industry Volume (Metric Tons), by Import Market Analysis (Value & Volume) 2024 & 2032
                                                              81. Figure 81: Europe Cashew Industry Revenue Share (%), by Import Market Analysis (Value & Volume) 2024 & 2032
                                                              82. Figure 82: Europe Cashew Industry Volume Share (%), by Import Market Analysis (Value & Volume) 2024 & 2032
                                                              83. Figure 83: Europe Cashew Industry Revenue (Million), by Export Market Analysis (Value & Volume) 2024 & 2032
                                                              84. Figure 84: Europe Cashew Industry Volume (Metric Tons), by Export Market Analysis (Value & Volume) 2024 & 2032
                                                              85. Figure 85: Europe Cashew Industry Revenue Share (%), by Export Market Analysis (Value & Volume) 2024 & 2032
                                                              86. Figure 86: Europe Cashew Industry Volume Share (%), by Export Market Analysis (Value & Volume) 2024 & 2032
                                                              87. Figure 87: Europe Cashew Industry Revenue (Million), by Price Trend Analysis 2024 & 2032
                                                              88. Figure 88: Europe Cashew Industry Volume (Metric Tons), by Price Trend Analysis 2024 & 2032
                                                              89. Figure 89: Europe Cashew Industry Revenue Share (%), by Price Trend Analysis 2024 & 2032
                                                              90. Figure 90: Europe Cashew Industry Volume Share (%), by Price Trend Analysis 2024 & 2032
                                                              91. Figure 91: Europe Cashew Industry Revenue (Million), by Country 2024 & 2032
                                                              92. Figure 92: Europe Cashew Industry Volume (Metric Tons), by Country 2024 & 2032
                                                              93. Figure 93: Europe Cashew Industry Revenue Share (%), by Country 2024 & 2032
                                                              94. Figure 94: Europe Cashew Industry Volume Share (%), by Country 2024 & 2032
                                                              95. Figure 95: Middle East & Africa Cashew Industry Revenue (Million), by Production Analysis 2024 & 2032
                                                              96. Figure 96: Middle East & Africa Cashew Industry Volume (Metric Tons), by Production Analysis 2024 & 2032
                                                              97. Figure 97: Middle East & Africa Cashew Industry Revenue Share (%), by Production Analysis 2024 & 2032
                                                              98. Figure 98: Middle East & Africa Cashew Industry Volume Share (%), by Production Analysis 2024 & 2032
                                                              99. Figure 99: Middle East & Africa Cashew Industry Revenue (Million), by Consumption Analysis 2024 & 2032
                                                              100. Figure 100: Middle East & Africa Cashew Industry Volume (Metric Tons), by Consumption Analysis 2024 & 2032
                                                              101. Figure 101: Middle East & Africa Cashew Industry Revenue Share (%), by Consumption Analysis 2024 & 2032
                                                              102. Figure 102: Middle East & Africa Cashew Industry Volume Share (%), by Consumption Analysis 2024 & 2032
                                                              103. Figure 103: Middle East & Africa Cashew Industry Revenue (Million), by Import Market Analysis (Value & Volume) 2024 & 2032
                                                              104. Figure 104: Middle East & Africa Cashew Industry Volume (Metric Tons), by Import Market Analysis (Value & Volume) 2024 & 2032
                                                              105. Figure 105: Middle East & Africa Cashew Industry Revenue Share (%), by Import Market Analysis (Value & Volume) 2024 & 2032
                                                              106. Figure 106: Middle East & Africa Cashew Industry Volume Share (%), by Import Market Analysis (Value & Volume) 2024 & 2032
                                                              107. Figure 107: Middle East & Africa Cashew Industry Revenue (Million), by Export Market Analysis (Value & Volume) 2024 & 2032
                                                              108. Figure 108: Middle East & Africa Cashew Industry Volume (Metric Tons), by Export Market Analysis (Value & Volume) 2024 & 2032
                                                              109. Figure 109: Middle East & Africa Cashew Industry Revenue Share (%), by Export Market Analysis (Value & Volume) 2024 & 2032
                                                              110. Figure 110: Middle East & Africa Cashew Industry Volume Share (%), by Export Market Analysis (Value & Volume) 2024 & 2032
                                                              111. Figure 111: Middle East & Africa Cashew Industry Revenue (Million), by Price Trend Analysis 2024 & 2032
                                                              112. Figure 112: Middle East & Africa Cashew Industry Volume (Metric Tons), by Price Trend Analysis 2024 & 2032
                                                              113. Figure 113: Middle East & Africa Cashew Industry Revenue Share (%), by Price Trend Analysis 2024 & 2032
                                                              114. Figure 114: Middle East & Africa Cashew Industry Volume Share (%), by Price Trend Analysis 2024 & 2032
                                                              115. Figure 115: Middle East & Africa Cashew Industry Revenue (Million), by Country 2024 & 2032
                                                              116. Figure 116: Middle East & Africa Cashew Industry Volume (Metric Tons), by Country 2024 & 2032
                                                              117. Figure 117: Middle East & Africa Cashew Industry Revenue Share (%), by Country 2024 & 2032
                                                              118. Figure 118: Middle East & Africa Cashew Industry Volume Share (%), by Country 2024 & 2032
                                                              119. Figure 119: Asia Pacific Cashew Industry Revenue (Million), by Production Analysis 2024 & 2032
                                                              120. Figure 120: Asia Pacific Cashew Industry Volume (Metric Tons), by Production Analysis 2024 & 2032
                                                              121. Figure 121: Asia Pacific Cashew Industry Revenue Share (%), by Production Analysis 2024 & 2032
                                                              122. Figure 122: Asia Pacific Cashew Industry Volume Share (%), by Production Analysis 2024 & 2032
                                                              123. Figure 123: Asia Pacific Cashew Industry Revenue (Million), by Consumption Analysis 2024 & 2032
                                                              124. Figure 124: Asia Pacific Cashew Industry Volume (Metric Tons), by Consumption Analysis 2024 & 2032
                                                              125. Figure 125: Asia Pacific Cashew Industry Revenue Share (%), by Consumption Analysis 2024 & 2032
                                                              126. Figure 126: Asia Pacific Cashew Industry Volume Share (%), by Consumption Analysis 2024 & 2032
                                                              127. Figure 127: Asia Pacific Cashew Industry Revenue (Million), by Import Market Analysis (Value & Volume) 2024 & 2032
                                                              128. Figure 128: Asia Pacific Cashew Industry Volume (Metric Tons), by Import Market Analysis (Value & Volume) 2024 & 2032
                                                              129. Figure 129: Asia Pacific Cashew Industry Revenue Share (%), by Import Market Analysis (Value & Volume) 2024 & 2032
                                                              130. Figure 130: Asia Pacific Cashew Industry Volume Share (%), by Import Market Analysis (Value & Volume) 2024 & 2032
                                                              131. Figure 131: Asia Pacific Cashew Industry Revenue (Million), by Export Market Analysis (Value & Volume) 2024 & 2032
                                                              132. Figure 132: Asia Pacific Cashew Industry Volume (Metric Tons), by Export Market Analysis (Value & Volume) 2024 & 2032
                                                              133. Figure 133: Asia Pacific Cashew Industry Revenue Share (%), by Export Market Analysis (Value & Volume) 2024 & 2032
                                                              134. Figure 134: Asia Pacific Cashew Industry Volume Share (%), by Export Market Analysis (Value & Volume) 2024 & 2032
                                                              135. Figure 135: Asia Pacific Cashew Industry Revenue (Million), by Price Trend Analysis 2024 & 2032
                                                              136. Figure 136: Asia Pacific Cashew Industry Volume (Metric Tons), by Price Trend Analysis 2024 & 2032
                                                              137. Figure 137: Asia Pacific Cashew Industry Revenue Share (%), by Price Trend Analysis 2024 & 2032
                                                              138. Figure 138: Asia Pacific Cashew Industry Volume Share (%), by Price Trend Analysis 2024 & 2032
                                                              139. Figure 139: Asia Pacific Cashew Industry Revenue (Million), by Country 2024 & 2032
                                                              140. Figure 140: Asia Pacific Cashew Industry Volume (Metric Tons), by Country 2024 & 2032
                                                              141. Figure 141: Asia Pacific Cashew Industry Revenue Share (%), by Country 2024 & 2032
                                                              142. Figure 142: Asia Pacific Cashew Industry Volume Share (%), by Country 2024 & 2032

                                                              List of Tables

                                                              1. Table 1: Global Cashew Industry Revenue Million Forecast, by Region 2019 & 2032
                                                              2. Table 2: Global Cashew Industry Volume Metric Tons Forecast, by Region 2019 & 2032
                                                              3. Table 3: Global Cashew Industry Revenue Million Forecast, by Production Analysis 2019 & 2032
                                                              4. Table 4: Global Cashew Industry Volume Metric Tons Forecast, by Production Analysis 2019 & 2032
                                                              5. Table 5: Global Cashew Industry Revenue Million Forecast, by Consumption Analysis 2019 & 2032
                                                              6. Table 6: Global Cashew Industry Volume Metric Tons Forecast, by Consumption Analysis 2019 & 2032
                                                              7. Table 7: Global Cashew Industry Revenue Million Forecast, by Import Market Analysis (Value & Volume) 2019 & 2032
                                                              8. Table 8: Global Cashew Industry Volume Metric Tons Forecast, by Import Market Analysis (Value & Volume) 2019 & 2032
                                                              9. Table 9: Global Cashew Industry Revenue Million Forecast, by Export Market Analysis (Value & Volume) 2019 & 2032
                                                              10. Table 10: Global Cashew Industry Volume Metric Tons Forecast, by Export Market Analysis (Value & Volume) 2019 & 2032
                                                              11. Table 11: Global Cashew Industry Revenue Million Forecast, by Price Trend Analysis 2019 & 2032
                                                              12. Table 12: Global Cashew Industry Volume Metric Tons Forecast, by Price Trend Analysis 2019 & 2032
                                                              13. Table 13: Global Cashew Industry Revenue Million Forecast, by Region 2019 & 2032
                                                              14. Table 14: Global Cashew Industry Volume Metric Tons Forecast, by Region 2019 & 2032
                                                              15. Table 15: Global Cashew Industry Revenue Million Forecast, by Country 2019 & 2032
                                                              16. Table 16: Global Cashew Industry Volume Metric Tons Forecast, by Country 2019 & 2032
                                                              17. Table 17: Brazil Cashew Industry Revenue (Million) Forecast, by Application 2019 & 2032
                                                              18. Table 18: Brazil Cashew Industry Volume (Metric Tons) Forecast, by Application 2019 & 2032
                                                              19. Table 19: Argentina Cashew Industry Revenue (Million) Forecast, by Application 2019 & 2032
                                                              20. Table 20: Argentina Cashew Industry Volume (Metric Tons) Forecast, by Application 2019 & 2032
                                                              21. Table 21: Rest of South America Cashew Industry Revenue (Million) Forecast, by Application 2019 & 2032
                                                              22. Table 22: Rest of South America Cashew Industry Volume (Metric Tons) Forecast, by Application 2019 & 2032
                                                              23. Table 23: Global Cashew Industry Revenue Million Forecast, by Country 2019 & 2032
                                                              24. Table 24: Global Cashew Industry Volume Metric Tons Forecast, by Country 2019 & 2032
                                                              25. Table 25: United States Cashew Industry Revenue (Million) Forecast, by Application 2019 & 2032
                                                              26. Table 26: United States Cashew Industry Volume (Metric Tons) Forecast, by Application 2019 & 2032
                                                              27. Table 27: Canada Cashew Industry Revenue (Million) Forecast, by Application 2019 & 2032
                                                              28. Table 28: Canada Cashew Industry Volume (Metric Tons) Forecast, by Application 2019 & 2032
                                                              29. Table 29: Mexico Cashew Industry Revenue (Million) Forecast, by Application 2019 & 2032
                                                              30. Table 30: Mexico Cashew Industry Volume (Metric Tons) Forecast, by Application 2019 & 2032
                                                              31. Table 31: Global Cashew Industry Revenue Million Forecast, by Country 2019 & 2032
                                                              32. Table 32: Global Cashew Industry Volume Metric Tons Forecast, by Country 2019 & 2032
                                                              33. Table 33: China Cashew Industry Revenue (Million) Forecast, by Application 2019 & 2032
                                                              34. Table 34: China Cashew Industry Volume (Metric Tons) Forecast, by Application 2019 & 2032
                                                              35. Table 35: Japan Cashew Industry Revenue (Million) Forecast, by Application 2019 & 2032
                                                              36. Table 36: Japan Cashew Industry Volume (Metric Tons) Forecast, by Application 2019 & 2032
                                                              37. Table 37: India Cashew Industry Revenue (Million) Forecast, by Application 2019 & 2032
                                                              38. Table 38: India Cashew Industry Volume (Metric Tons) Forecast, by Application 2019 & 2032
                                                              39. Table 39: South Korea Cashew Industry Revenue (Million) Forecast, by Application 2019 & 2032
                                                              40. Table 40: South Korea Cashew Industry Volume (Metric Tons) Forecast, by Application 2019 & 2032
                                                              41. Table 41: Taiwan Cashew Industry Revenue (Million) Forecast, by Application 2019 & 2032
                                                              42. Table 42: Taiwan Cashew Industry Volume (Metric Tons) Forecast, by Application 2019 & 2032
                                                              43. Table 43: Australia Cashew Industry Revenue (Million) Forecast, by Application 2019 & 2032
                                                              44. Table 44: Australia Cashew Industry Volume (Metric Tons) Forecast, by Application 2019 & 2032
                                                              45. Table 45: Rest of Asia-Pacific Cashew Industry Revenue (Million) Forecast, by Application 2019 & 2032
                                                              46. Table 46: Rest of Asia-Pacific Cashew Industry Volume (Metric Tons) Forecast, by Application 2019 & 2032
                                                              47. Table 47: Global Cashew Industry Revenue Million Forecast, by Country 2019 & 2032
                                                              48. Table 48: Global Cashew Industry Volume Metric Tons Forecast, by Country 2019 & 2032
                                                              49. Table 49: Germany Cashew Industry Revenue (Million) Forecast, by Application 2019 & 2032
                                                              50. Table 50: Germany Cashew Industry Volume (Metric Tons) Forecast, by Application 2019 & 2032
                                                              51. Table 51: France Cashew Industry Revenue (Million) Forecast, by Application 2019 & 2032
                                                              52. Table 52: France Cashew Industry Volume (Metric Tons) Forecast, by Application 2019 & 2032
                                                              53. Table 53: Italy Cashew Industry Revenue (Million) Forecast, by Application 2019 & 2032
                                                              54. Table 54: Italy Cashew Industry Volume (Metric Tons) Forecast, by Application 2019 & 2032
                                                              55. Table 55: United Kingdom Cashew Industry Revenue (Million) Forecast, by Application 2019 & 2032
                                                              56. Table 56: United Kingdom Cashew Industry Volume (Metric Tons) Forecast, by Application 2019 & 2032
                                                              57. Table 57: Netherlands Cashew Industry Revenue (Million) Forecast, by Application 2019 & 2032
                                                              58. Table 58: Netherlands Cashew Industry Volume (Metric Tons) Forecast, by Application 2019 & 2032
                                                              59. Table 59: Rest of Europe Cashew Industry Revenue (Million) Forecast, by Application 2019 & 2032
                                                              60. Table 60: Rest of Europe Cashew Industry Volume (Metric Tons) Forecast, by Application 2019 & 2032
                                                              61. Table 61: Global Cashew Industry Revenue Million Forecast, by Country 2019 & 2032
                                                              62. Table 62: Global Cashew Industry Volume Metric Tons Forecast, by Country 2019 & 2032
                                                              63. Table 63: Middle East Cashew Industry Revenue (Million) Forecast, by Application 2019 & 2032
                                                              64. Table 64: Middle East Cashew Industry Volume (Metric Tons) Forecast, by Application 2019 & 2032
                                                              65. Table 65: Africa Cashew Industry Revenue (Million) Forecast, by Application 2019 & 2032
                                                              66. Table 66: Africa Cashew Industry Volume (Metric Tons) Forecast, by Application 2019 & 2032
                                                              67. Table 67: Global Cashew Industry Revenue Million Forecast, by Production Analysis 2019 & 2032
                                                              68. Table 68: Global Cashew Industry Volume Metric Tons Forecast, by Production Analysis 2019 & 2032
                                                              69. Table 69: Global Cashew Industry Revenue Million Forecast, by Consumption Analysis 2019 & 2032
                                                              70. Table 70: Global Cashew Industry Volume Metric Tons Forecast, by Consumption Analysis 2019 & 2032
                                                              71. Table 71: Global Cashew Industry Revenue Million Forecast, by Import Market Analysis (Value & Volume) 2019 & 2032
                                                              72. Table 72: Global Cashew Industry Volume Metric Tons Forecast, by Import Market Analysis (Value & Volume) 2019 & 2032
                                                              73. Table 73: Global Cashew Industry Revenue Million Forecast, by Export Market Analysis (Value & Volume) 2019 & 2032
                                                              74. Table 74: Global Cashew Industry Volume Metric Tons Forecast, by Export Market Analysis (Value & Volume) 2019 & 2032
                                                              75. Table 75: Global Cashew Industry Revenue Million Forecast, by Price Trend Analysis 2019 & 2032
                                                              76. Table 76: Global Cashew Industry Volume Metric Tons Forecast, by Price Trend Analysis 2019 & 2032
                                                              77. Table 77: Global Cashew Industry Revenue Million Forecast, by Country 2019 & 2032
                                                              78. Table 78: Global Cashew Industry Volume Metric Tons Forecast, by Country 2019 & 2032
                                                              79. Table 79: United States Cashew Industry Revenue (Million) Forecast, by Application 2019 & 2032
                                                              80. Table 80: United States Cashew Industry Volume (Metric Tons) Forecast, by Application 2019 & 2032
                                                              81. Table 81: Canada Cashew Industry Revenue (Million) Forecast, by Application 2019 & 2032
                                                              82. Table 82: Canada Cashew Industry Volume (Metric Tons) Forecast, by Application 2019 & 2032
                                                              83. Table 83: Mexico Cashew Industry Revenue (Million) Forecast, by Application 2019 & 2032
                                                              84. Table 84: Mexico Cashew Industry Volume (Metric Tons) Forecast, by Application 2019 & 2032
                                                              85. Table 85: Global Cashew Industry Revenue Million Forecast, by Production Analysis 2019 & 2032
                                                              86. Table 86: Global Cashew Industry Volume Metric Tons Forecast, by Production Analysis 2019 & 2032
                                                              87. Table 87: Global Cashew Industry Revenue Million Forecast, by Consumption Analysis 2019 & 2032
                                                              88. Table 88: Global Cashew Industry Volume Metric Tons Forecast, by Consumption Analysis 2019 & 2032
                                                              89. Table 89: Global Cashew Industry Revenue Million Forecast, by Import Market Analysis (Value & Volume) 2019 & 2032
                                                              90. Table 90: Global Cashew Industry Volume Metric Tons Forecast, by Import Market Analysis (Value & Volume) 2019 & 2032
                                                              91. Table 91: Global Cashew Industry Revenue Million Forecast, by Export Market Analysis (Value & Volume) 2019 & 2032
                                                              92. Table 92: Global Cashew Industry Volume Metric Tons Forecast, by Export Market Analysis (Value & Volume) 2019 & 2032
                                                              93. Table 93: Global Cashew Industry Revenue Million Forecast, by Price Trend Analysis 2019 & 2032
                                                              94. Table 94: Global Cashew Industry Volume Metric Tons Forecast, by Price Trend Analysis 2019 & 2032
                                                              95. Table 95: Global Cashew Industry Revenue Million Forecast, by Country 2019 & 2032
                                                              96. Table 96: Global Cashew Industry Volume Metric Tons Forecast, by Country 2019 & 2032
                                                              97. Table 97: Brazil Cashew Industry Revenue (Million) Forecast, by Application 2019 & 2032
                                                              98. Table 98: Brazil Cashew Industry Volume (Metric Tons) Forecast, by Application 2019 & 2032
                                                              99. Table 99: Argentina Cashew Industry Revenue (Million) Forecast, by Application 2019 & 2032
                                                              100. Table 100: Argentina Cashew Industry Volume (Metric Tons) Forecast, by Application 2019 & 2032
                                                              101. Table 101: Rest of South America Cashew Industry Revenue (Million) Forecast, by Application 2019 & 2032
                                                              102. Table 102: Rest of South America Cashew Industry Volume (Metric Tons) Forecast, by Application 2019 & 2032
                                                              103. Table 103: Global Cashew Industry Revenue Million Forecast, by Production Analysis 2019 & 2032
                                                              104. Table 104: Global Cashew Industry Volume Metric Tons Forecast, by Production Analysis 2019 & 2032
                                                              105. Table 105: Global Cashew Industry Revenue Million Forecast, by Consumption Analysis 2019 & 2032
                                                              106. Table 106: Global Cashew Industry Volume Metric Tons Forecast, by Consumption Analysis 2019 & 2032
                                                              107. Table 107: Global Cashew Industry Revenue Million Forecast, by Import Market Analysis (Value & Volume) 2019 & 2032
                                                              108. Table 108: Global Cashew Industry Volume Metric Tons Forecast, by Import Market Analysis (Value & Volume) 2019 & 2032
                                                              109. Table 109: Global Cashew Industry Revenue Million Forecast, by Export Market Analysis (Value & Volume) 2019 & 2032
                                                              110. Table 110: Global Cashew Industry Volume Metric Tons Forecast, by Export Market Analysis (Value & Volume) 2019 & 2032
                                                              111. Table 111: Global Cashew Industry Revenue Million Forecast, by Price Trend Analysis 2019 & 2032
                                                              112. Table 112: Global Cashew Industry Volume Metric Tons Forecast, by Price Trend Analysis 2019 & 2032
                                                              113. Table 113: Global Cashew Industry Revenue Million Forecast, by Country 2019 & 2032
                                                              114. Table 114: Global Cashew Industry Volume Metric Tons Forecast, by Country 2019 & 2032
                                                              115. Table 115: United Kingdom Cashew Industry Revenue (Million) Forecast, by Application 2019 & 2032
                                                              116. Table 116: United Kingdom Cashew Industry Volume (Metric Tons) Forecast, by Application 2019 & 2032
                                                              117. Table 117: Germany Cashew Industry Revenue (Million) Forecast, by Application 2019 & 2032
                                                              118. Table 118: Germany Cashew Industry Volume (Metric Tons) Forecast, by Application 2019 & 2032
                                                              119. Table 119: France Cashew Industry Revenue (Million) Forecast, by Application 2019 & 2032
                                                              120. Table 120: France Cashew Industry Volume (Metric Tons) Forecast, by Application 2019 & 2032
                                                              121. Table 121: Italy Cashew Industry Revenue (Million) Forecast, by Application 2019 & 2032
                                                              122. Table 122: Italy Cashew Industry Volume (Metric Tons) Forecast, by Application 2019 & 2032
                                                              123. Table 123: Spain Cashew Industry Revenue (Million) Forecast, by Application 2019 & 2032
                                                              124. Table 124: Spain Cashew Industry Volume (Metric Tons) Forecast, by Application 2019 & 2032
                                                              125. Table 125: Russia Cashew Industry Revenue (Million) Forecast, by Application 2019 & 2032
                                                              126. Table 126: Russia Cashew Industry Volume (Metric Tons) Forecast, by Application 2019 & 2032
                                                              127. Table 127: Benelux Cashew Industry Revenue (Million) Forecast, by Application 2019 & 2032
                                                              128. Table 128: Benelux Cashew Industry Volume (Metric Tons) Forecast, by Application 2019 & 2032
                                                              129. Table 129: Nordics Cashew Industry Revenue (Million) Forecast, by Application 2019 & 2032
                                                              130. Table 130: Nordics Cashew Industry Volume (Metric Tons) Forecast, by Application 2019 & 2032
                                                              131. Table 131: Rest of Europe Cashew Industry Revenue (Million) Forecast, by Application 2019 & 2032
                                                              132. Table 132: Rest of Europe Cashew Industry Volume (Metric Tons) Forecast, by Application 2019 & 2032
                                                              133. Table 133: Global Cashew Industry Revenue Million Forecast, by Production Analysis 2019 & 2032
                                                              134. Table 134: Global Cashew Industry Volume Metric Tons Forecast, by Production Analysis 2019 & 2032
                                                              135. Table 135: Global Cashew Industry Revenue Million Forecast, by Consumption Analysis 2019 & 2032
                                                              136. Table 136: Global Cashew Industry Volume Metric Tons Forecast, by Consumption Analysis 2019 & 2032
                                                              137. Table 137: Global Cashew Industry Revenue Million Forecast, by Import Market Analysis (Value & Volume) 2019 & 2032
                                                              138. Table 138: Global Cashew Industry Volume Metric Tons Forecast, by Import Market Analysis (Value & Volume) 2019 & 2032
                                                              139. Table 139: Global Cashew Industry Revenue Million Forecast, by Export Market Analysis (Value & Volume) 2019 & 2032
                                                              140. Table 140: Global Cashew Industry Volume Metric Tons Forecast, by Export Market Analysis (Value & Volume) 2019 & 2032
                                                              141. Table 141: Global Cashew Industry Revenue Million Forecast, by Price Trend Analysis 2019 & 2032
                                                              142. Table 142: Global Cashew Industry Volume Metric Tons Forecast, by Price Trend Analysis 2019 & 2032
                                                              143. Table 143: Global Cashew Industry Revenue Million Forecast, by Country 2019 & 2032
                                                              144. Table 144: Global Cashew Industry Volume Metric Tons Forecast, by Country 2019 & 2032
                                                              145. Table 145: Turkey Cashew Industry Revenue (Million) Forecast, by Application 2019 & 2032
                                                              146. Table 146: Turkey Cashew Industry Volume (Metric Tons) Forecast, by Application 2019 & 2032
                                                              147. Table 147: Israel Cashew Industry Revenue (Million) Forecast, by Application 2019 & 2032
                                                              148. Table 148: Israel Cashew Industry Volume (Metric Tons) Forecast, by Application 2019 & 2032
                                                              149. Table 149: GCC Cashew Industry Revenue (Million) Forecast, by Application 2019 & 2032
                                                              150. Table 150: GCC Cashew Industry Volume (Metric Tons) Forecast, by Application 2019 & 2032
                                                              151. Table 151: North Africa Cashew Industry Revenue (Million) Forecast, by Application 2019 & 2032
                                                              152. Table 152: North Africa Cashew Industry Volume (Metric Tons) Forecast, by Application 2019 & 2032
                                                              153. Table 153: South Africa Cashew Industry Revenue (Million) Forecast, by Application 2019 & 2032
                                                              154. Table 154: South Africa Cashew Industry Volume (Metric Tons) Forecast, by Application 2019 & 2032
                                                              155. Table 155: Rest of Middle East & Africa Cashew Industry Revenue (Million) Forecast, by Application 2019 & 2032
                                                              156. Table 156: Rest of Middle East & Africa Cashew Industry Volume (Metric Tons) Forecast, by Application 2019 & 2032
                                                              157. Table 157: Global Cashew Industry Revenue Million Forecast, by Production Analysis 2019 & 2032
                                                              158. Table 158: Global Cashew Industry Volume Metric Tons Forecast, by Production Analysis 2019 & 2032
                                                              159. Table 159: Global Cashew Industry Revenue Million Forecast, by Consumption Analysis 2019 & 2032
                                                              160. Table 160: Global Cashew Industry Volume Metric Tons Forecast, by Consumption Analysis 2019 & 2032
                                                              161. Table 161: Global Cashew Industry Revenue Million Forecast, by Import Market Analysis (Value & Volume) 2019 & 2032
                                                              162. Table 162: Global Cashew Industry Volume Metric Tons Forecast, by Import Market Analysis (Value & Volume) 2019 & 2032
                                                              163. Table 163: Global Cashew Industry Revenue Million Forecast, by Export Market Analysis (Value & Volume) 2019 & 2032
                                                              164. Table 164: Global Cashew Industry Volume Metric Tons Forecast, by Export Market Analysis (Value & Volume) 2019 & 2032
                                                              165. Table 165: Global Cashew Industry Revenue Million Forecast, by Price Trend Analysis 2019 & 2032
                                                              166. Table 166: Global Cashew Industry Volume Metric Tons Forecast, by Price Trend Analysis 2019 & 2032
                                                              167. Table 167: Global Cashew Industry Revenue Million Forecast, by Country 2019 & 2032
                                                              168. Table 168: Global Cashew Industry Volume Metric Tons Forecast, by Country 2019 & 2032
                                                              169. Table 169: China Cashew Industry Revenue (Million) Forecast, by Application 2019 & 2032
                                                              170. Table 170: China Cashew Industry Volume (Metric Tons) Forecast, by Application 2019 & 2032
                                                              171. Table 171: India Cashew Industry Revenue (Million) Forecast, by Application 2019 & 2032
                                                              172. Table 172: India Cashew Industry Volume (Metric Tons) Forecast, by Application 2019 & 2032
                                                              173. Table 173: Japan Cashew Industry Revenue (Million) Forecast, by Application 2019 & 2032
                                                              174. Table 174: Japan Cashew Industry Volume (Metric Tons) Forecast, by Application 2019 & 2032
                                                              175. Table 175: South Korea Cashew Industry Revenue (Million) Forecast, by Application 2019 & 2032
                                                              176. Table 176: South Korea Cashew Industry Volume (Metric Tons) Forecast, by Application 2019 & 2032
                                                              177. Table 177: ASEAN Cashew Industry Revenue (Million) Forecast, by Application 2019 & 2032
                                                              178. Table 178: ASEAN Cashew Industry Volume (Metric Tons) Forecast, by Application 2019 & 2032
                                                              179. Table 179: Oceania Cashew Industry Revenue (Million) Forecast, by Application 2019 & 2032
                                                              180. Table 180: Oceania Cashew Industry Volume (Metric Tons) Forecast, by Application 2019 & 2032
                                                              181. Table 181: Rest of Asia Pacific Cashew Industry Revenue (Million) Forecast, by Application 2019 & 2032
                                                              182. Table 182: Rest of Asia Pacific Cashew Industry Volume (Metric Tons) Forecast, by Application 2019 & 2032


                                                              Frequently Asked Questions

                                                              1. What is the projected Compound Annual Growth Rate (CAGR) of the Cashew Industry?

                                                              The projected CAGR is approximately 4.60%.

                                                              2. Which companies are prominent players in the Cashew Industry?

                                                              Key companies in the market include The Hershey Company, Olam International, Vietnam Cashew Association , Indian Cashew Exporters Association.

                                                              3. What are the main segments of the Cashew Industry?

                                                              The market segments include Production Analysis, Consumption Analysis, Import Market Analysis (Value & Volume), Export Market Analysis (Value & Volume), Price Trend Analysis.

                                                              4. Can you provide details about the market size?

                                                              The market size is estimated to be USD 8.78 Million as of 2022.

                                                              5. What are some drivers contributing to market growth?

                                                              Rising Consumption of Cashew Nuts as a Healthy Snack; Increasing Government initiatives; Growing Cashew Nut Imports in The United States.

                                                              6. What are the notable trends driving market growth?

                                                              Increasing Government Initiatives to Boost Cashew Production.

                                                              7. Are there any restraints impacting market growth?

                                                              Hazardous Climatic Condition Hinders Cashew Production; Stringent Regulations Related To Food Quality Standards.

                                                              8. Can you provide examples of recent developments in the market?

                                                              N/A

                                                              9. What pricing options are available for accessing the report?

                                                              Pricing options include single-user, multi-user, and enterprise licenses priced at USD 3800, USD 4500, and USD 5800 respectively.

                                                              10. Is the market size provided in terms of value or volume?

                                                              The market size is provided in terms of value, measured in Million and volume, measured in Metric Tons.

                                                              11. Are there any specific market keywords associated with the report?

                                                              Yes, the market keyword associated with the report is "Cashew Industry," which aids in identifying and referencing the specific market segment covered.

                                                              12. How do I determine which pricing option suits my needs best?

                                                              The pricing options vary based on user requirements and access needs. Individual users may opt for single-user licenses, while businesses requiring broader access may choose multi-user or enterprise licenses for cost-effective access to the report.

                                                              13. Are there any additional resources or data provided in the Cashew Industry report?

                                                              While the report offers comprehensive insights, it's advisable to review the specific contents or supplementary materials provided to ascertain if additional resources or data are available.

                                                              14. How can I stay updated on further developments or reports in the Cashew Industry?

                                                              To stay informed about further developments, trends, and reports in the Cashew Industry, consider subscribing to industry newsletters, following relevant companies and organizations, or regularly checking reputable industry news sources and publications.


                                                              Methodology

                                                              Step 1 - Identification of Relevant Samples Size from Population Database

                                                              Step Chart
                                                              Bar Chart
                                                              Method Chart

                                                              Step 2 - Approaches for Defining Global Market Size (Value, Volume* & Price*)

                                                              Approach Chart
                                                              Top-down and bottom-up approaches are used to validate the global market size and estimate the market size for manufactures, regional segments, product, and application.

                                                              Note*: In applicable scenarios

                                                              Step 3 - Data Sources

                                                              Primary Research

                                                              • Web Analytics
                                                              • Survey Reports
                                                              • Research Institute
                                                              • Latest Research Reports
                                                              • Opinion Leaders

                                                              Secondary Research

                                                              • Annual Reports
                                                              • White Paper
                                                              • Latest Press Release
                                                              • Industry Association
                                                              • Paid Database
                                                              • Investor Presentations
                                                              Analyst Chart

                                                              Step 4 - Data Triangulation

                                                              Involves using different sources of information in order to increase the validity of a study

                                                              These sources are likely to be stakeholders in a program - participants, other researchers, program staff, other community members, and so on.

                                                              Then we put all data in single framework & apply various statistical tools to find out the dynamic on the market.

                                                              During the analysis stage, feedback from the stakeholder groups would be compared to determine areas of agreement as well as areas of divergence

                                                              Additionally, after gathering mixed and scattered data from a wide range of sources, data is triangulated and correlated to come up with estimated figures which are further validated through primary mediums or industry experts, opinion leaders.

                                                              About Precision Market View

                                                              Precision Market View offers precise market research, industry intelligence, and data analysis for healthcare, manufacturing, technology, and energy. Our reports provide the clarity you need to make informed decisions and drive growth.

                                                              Our team combines primary research, advanced analytics, and industry expertise to deliver actionable intelligence. We offer syndicated reports, custom research, and consulting services tailored to your business needs.

                                                              At Precision Market View, we are committed to quality, transparency, and client satisfaction. Every report is rigorously validated to ensure accuracy and relevance. Our global perspective and local expertise help you understand both the big picture and the finer details of your market.

                                                              Stay informed with Precision Market View. Subscribe to our newsletter for the latest updates and research highlights, and follow us on social media for real-time insights.

                                                              Precision Market View – Clarity for Your Strategic Decisions.

                                                              artwork spiralartwork spiralRelated Reports
                                                              artwork underline

                                                              Turf & Ornamental Chemical Input Industry Market Report: Trends and Growth

                                                              The Turf & Ornamental Chemical Input market is booming, projected to reach $9.875 billion by 2033 with a 4.34% CAGR. Discover key trends, leading companies (FMC, Bayer, Syngenta), and regional insights in this comprehensive market analysis. Explore the impact of pesticides, fertilizers, and growth regulators on landscaping and gardening.

                                                              July 2025
                                                              Base Year: 2024
                                                              No Of Pages: 234
                                                              Price: $4750

                                                              Brazil Maize Market: Growth Opportunities and Competitive Landscape Overview 2025-2033

                                                              Discover the booming Brazil maize market forecast (2025-2033)! This in-depth analysis reveals key trends, drivers, and challenges impacting hybrid maize, conventional maize, and applications across animal feed, human consumption, and biofuels. Learn about major players like Syngenta and Corteva and the projected market size and CAGR.

                                                              July 2025
                                                              Base Year: 2024
                                                              No Of Pages: 180
                                                              Price: $3800

                                                              Opportunities in North America Crop Protection Chemicals Industry Market 2025-2033

                                                              The North American crop protection chemicals market is booming, projected to reach [estimated 2033 market size in millions] by 2033 with a 4.34% CAGR. Discover key trends, driving forces, and major players shaping this dynamic industry, including insecticides, herbicides, fungicides, and more. Learn about regional variations and market segmentation across various crop types and application methods.

                                                              July 2025
                                                              Base Year: 2024
                                                              No Of Pages: 180
                                                              Price: $3800

                                                              Apple Industry to Grow at XX CAGR: Market Size Analysis and Forecasts 2025-2033

                                                              Discover the latest trends in the global apple industry. This in-depth market analysis reveals a steady growth trajectory, driven by consumer demand, diverse product applications, and expanding online retail. Learn about key players, regional insights, and future projections for the apple market from 2025-2033.

                                                              July 2025
                                                              Base Year: 2024
                                                              No Of Pages: 234
                                                              Price: $4750

                                                              Digital Agriculture Market 2025-2033: Preparing for Growth and Change

                                                              The booming digital agriculture market is projected to reach \$44.14 billion by 2033, fueled by precision farming, AI, and drone technology. Explore market trends, key players (AGCO, Microsoft, Deere), and regional growth in this comprehensive analysis.

                                                              July 2025
                                                              Base Year: 2024
                                                              No Of Pages: 150
                                                              Price: $4750

                                                              North America Maize Industry Charting Growth Trajectories 2025-2033: Strategic Insights and Forecasts

                                                              Discover the booming North American maize market! This comprehensive analysis reveals key trends, drivers, and restraints, including insights into hybrid seeds, field corn, sweet corn, popcorn, and major players like Bayer & Syngenta. Project your business strategy with our forecast to 2033.

                                                              July 2025
                                                              Base Year: 2024
                                                              No Of Pages: 180
                                                              Price: $3800

                                                              North America Agricultural Tractors Machinery Market 2025-2033 Overview: Trends, Competitor Dynamics, and Opportunities

                                                              Discover the booming North American agricultural tractors market! This comprehensive analysis reveals key trends, drivers, and restraints impacting the $16.39 billion industry through 2033, focusing on key players like Deere & Company and Mahindra & Mahindra. Explore market segmentation by HP and drive type, plus regional breakdowns.

                                                              July 2025
                                                              Base Year: 2024
                                                              No Of Pages: 234
                                                              Price: $4750

                                                              APAC Biofertilizers Market Growth Opportunities: Market Size Forecast to 2033

                                                              Discover the booming APAC biofertilizers market! This comprehensive analysis reveals a CAGR of 10.80%, driven by sustainable agriculture and growing demand for organic food. Explore market size projections, key segments (Rhizobium, Azospirillum, etc.), and leading companies shaping this dynamic industry.

                                                              July 2025
                                                              Base Year: 2024
                                                              No Of Pages: 180
                                                              Price: $4750

                                                              Turkey Agricultural Tractor Market Dynamics and Forecasts: 2025-2033 Strategic Insights

                                                              Discover the booming Turkish agricultural tractor market! This comprehensive analysis reveals a 6.10% CAGR, driven by government support and technological advancements. Explore market trends, segmentation by horsepower (50HP, 75HP, 100HP, 200HP+), key players, and growth projections to 2033. Invest wisely in this expanding sector!

                                                              July 2025
                                                              Base Year: 2024
                                                              No Of Pages: 197
                                                              Price: $3800

                                                              North America Herbicide Market Insightful Analysis: Trends, Competitor Dynamics, and Opportunities 2025-2033

                                                              Discover the surging North American herbicide market, projected to reach $XX million by 2033 with a 4.34% CAGR. This in-depth analysis explores key drivers, trends, restraints, and competitive landscapes, covering chemigation, foliar application, crop types, and leading companies like FMC and Bayer. Gain insights into regional market shares and future growth projections.

                                                              July 2025
                                                              Base Year: 2024
                                                              No Of Pages: 180
                                                              Price: $3800

                                                              Vietnam Agro Machinery Market Insights: Growth at XX CAGR Through 2033

                                                              Discover the booming Vietnam agro-machinery market, projected to reach [estimated value] by 2033 with a CAGR of 11.50%. This in-depth analysis explores market drivers, trends, restraints, key players (Yanmar, Kubota, VEAM), and segment insights (tractors, rice transplanters, harvesting machinery). Learn about investment opportunities and future growth potential.

                                                              July 2025
                                                              Base Year: 2024
                                                              No Of Pages: 150
                                                              Price: $3800

                                                              Exploring Key Dynamics of Honey Industry Industry

                                                              Discover the booming honey market! This comprehensive analysis reveals a $11.08B industry with a 5.20% CAGR, exploring key drivers, trends, regional insights (North America, Europe, Asia-Pacific), and leading brands like Dabur Honey and Patanjali Ayurved. Learn about raw honey, organic honey, Manuka honey, and more. Get your free market research now!

                                                              July 2025
                                                              Base Year: 2024
                                                              No Of Pages: 234
                                                              Price: $4750

                                                              Emerging Market Insights in Cotton Trade Analysis Market: 2025-2033 Overview

                                                              Discover the latest insights into the booming global cotton trade market. This comprehensive analysis reveals a $60B market (2025) projected to grow at a 4.5% CAGR through 2033, driven by textile industry growth and sustainable cotton demand. Explore key trends, restraints, and regional market shares.

                                                              July 2025
                                                              Base Year: 2024
                                                              No Of Pages: 150
                                                              Price: $4750

                                                              Asia-pacific Tomato Seed Market Projected to Grow at XX CAGR: Insights and Forecasts 2025-2033

                                                              The Asia-Pacific tomato seed market is booming, driven by rising demand and advancements in breeding technology. Discover key market trends, growth projections (2025-2033), major players, and regional insights in this comprehensive market analysis.

                                                              July 2025
                                                              Base Year: 2024
                                                              No Of Pages: 180
                                                              Price: $3800

                                                              Uganda Agriculture Industry Market Strategies for the Next Decade: 2025-2033

                                                              Discover the booming Ugandan agriculture industry! Explore market size ($4.07B in 2025), 4.20% CAGR growth projections to 2033, key players, and regional trends in cereals, oilseeds, fruits, and vegetables. Invest in Uganda's agricultural future.

                                                              July 2025
                                                              Base Year: 2024
                                                              No Of Pages: 150
                                                              Price: $3800

                                                              Artichokes Industry: Harnessing Emerging Innovations for Growth 2025-2033

                                                              Discover the booming artichoke market! Explore key trends, regional analysis, and leading companies driving growth in this $XX million industry projected to reach [estimated 2033 value] by 2033. Learn about the rising demand for fresh, canned, frozen, and marinated artichokes in the food service, household, and industrial sectors.

                                                              July 2025
                                                              Base Year: 2024
                                                              No Of Pages: 197
                                                              Price: $3800

                                                              Agricultural Inoculants Market Growth Opportunities and Market Forecast 2025-2033: A Strategic Analysis

                                                              Discover the booming agricultural inoculants market! Our comprehensive analysis reveals a CAGR of 10.50%, driven by sustainable farming trends and rising food demands. Explore market size, segmentation, key players (Bioceres, Novozymes, BASF), and regional insights for 2025-2033. Learn how bio-based solutions are revolutionizing agriculture.

                                                              July 2025
                                                              Base Year: 2024
                                                              No Of Pages: 150
                                                              Price: $4750

                                                              US Farm Equipment Industry Market’s Role in Emerging Tech: Insights and Projections 2025-2033

                                                              The US farm equipment market is booming, projected to reach [estimated 2033 value] by 2033, driven by precision agriculture, government initiatives, and rising demand. Explore market trends, key players (John Deere, Kubota, AGCO), and regional insights in this comprehensive analysis.

                                                              July 2025
                                                              Base Year: 2024
                                                              No Of Pages: 150
                                                              Price: $3800

                                                              Tanzania Fruits and Vegetables Industry Market Demand and Consumption Trends: Outlook 2025-2033

                                                              Discover the booming Tanzanian fruits and vegetables market! This comprehensive report reveals a $2.17B market in 2025, projected to grow at a 6.5% CAGR until 2033. Explore key trends, challenges, and opportunities in production, consumption, import/export, and regional analysis. Invest wisely with our detailed insights.

                                                              July 2025
                                                              Base Year: 2024
                                                              No Of Pages: 197
                                                              Price: $3800

                                                              Technological Advances in Hybrid Soybean Seeds Market Market: Trends and Opportunities 2025-2033

                                                              The booming hybrid soybean seeds market, projected to reach $X Billion by 2025 and growing at a CAGR of 10.20%, is analyzed in this comprehensive report. Discover key drivers, trends, and restraints shaping this dynamic sector, along with leading companies and regional market shares. Explore the potential of hybrid soybean seeds for increased yields and disease resistance.

                                                              July 2025
                                                              Base Year: 2024
                                                              No Of Pages: 197
                                                              Price: $3800
                                                              • Home
                                                              • About Us
                                                              • Industries
                                                                • Aerospace & Defense
                                                                • Agriculture
                                                                • Animal Nutrition & Wellness
                                                                • Automotive
                                                                • Chemicals & Materials
                                                                • Consumer Goods and Services
                                                                • Energy & Power
                                                                • Financial Services and Investment Intelligence
                                                                • Food & Beverage
                                                                • Home and Property Improvement
                                                                • Hospitality and Tourism
                                                                • Logistics
                                                                • Manufacturing Products and Services
                                                                • Packaging
                                                                • Professional and Commercial Services
                                                                • Real Estate and Construction
                                                                • Retail
                                                                • Technology, Media and Telecom
                                                                • Healthcare
                                                              • Services
                                                              • Contact
                                                              Main Logo
                                                              • Home
                                                              • About Us
                                                              • Industries
                                                                • Aerospace & Defense
                                                                • Agriculture
                                                                • Animal Nutrition & Wellness
                                                                • Automotive
                                                                • Chemicals & Materials
                                                                • Consumer Goods and Services
                                                                • Energy & Power
                                                                • Financial Services and Investment Intelligence
                                                                • Food & Beverage
                                                                • Home and Property Improvement
                                                                • Hospitality and Tourism
                                                                • Logistics
                                                                • Manufacturing Products and Services
                                                                • Packaging
                                                                • Professional and Commercial Services
                                                                • Real Estate and Construction
                                                                • Retail
                                                                • Technology, Media and Telecom
                                                                • Healthcare
                                                              • Services
                                                              • Contact
                                                              +17162654855
                                                              [email protected]

                                                              +17162654855

                                                              [email protected]

                                                              Business Address

                                                              Head Office

                                                              Office no. A 5010, fifth floor, Solitaire Business Hub, Near Phoenix mall, Pune, Maharashtra 411014

                                                              Contact Information

                                                              Craig Francis

                                                              Business Development Head

                                                              +17162654855

                                                              [email protected]

                                                              Connect With Us

                                                              Secure Payment Partners

                                                              payment image
                                                              RetailLogisticsPackagingAutomotiveHealthcareAgricultureEnergy & PowerFood & BeverageAerospace & DefenseChemicals & MaterialsHospitality and TourismAnimal Nutrition & WellnessConsumer Goods and ServicesReal Estate and ConstructionHome and Property ImprovementTechnology, Media and TelecomManufacturing Products and ServicesFinancial Services and Investment Intelligence

                                                              © 2025 All rights reserved


                                                              Privacy Policy
                                                              Terms and Conditions
                                                              FAQ