
Key Insights
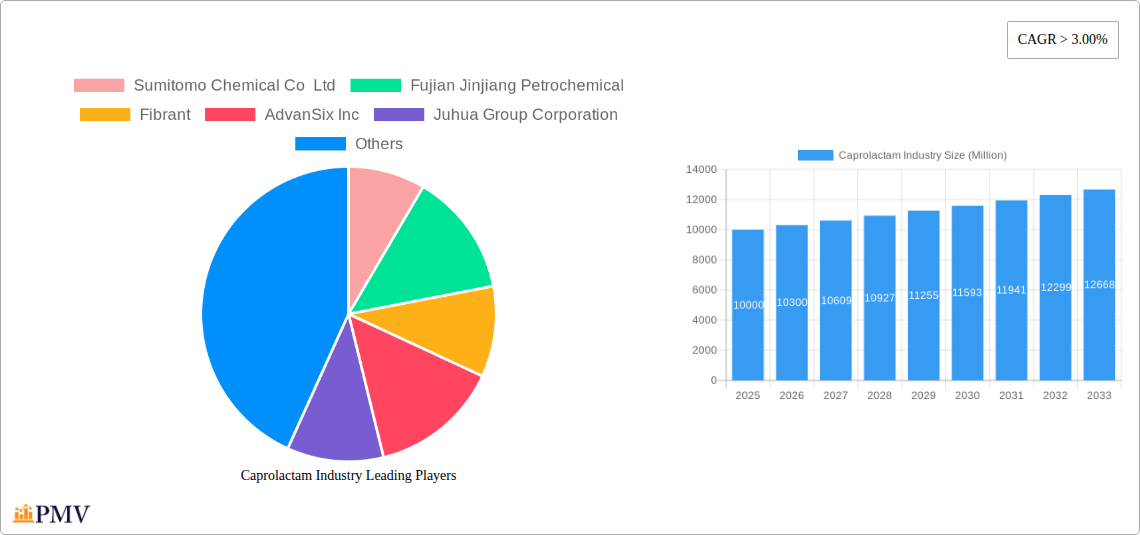
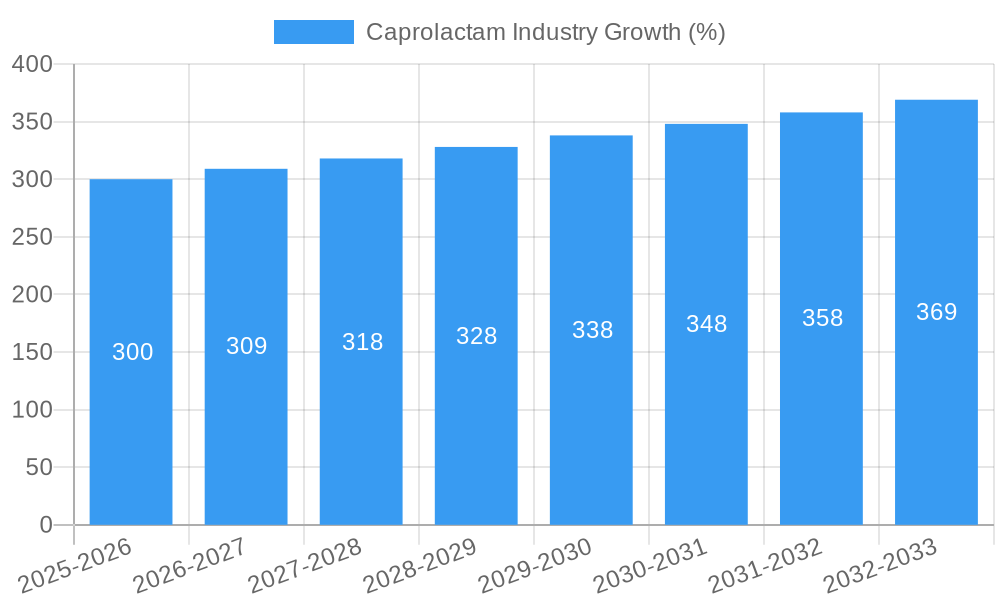
The global caprolactam market, valued at approximately $XX million in 2025, is projected to experience robust growth, exhibiting a Compound Annual Growth Rate (CAGR) exceeding 3.00% from 2025 to 2033. This expansion is driven by the increasing demand for nylon 6 resins and fibers across diverse end-use sectors, including automotive, textiles, carpets, and engineering applications. The automotive industry's growth, particularly in Asia-Pacific, fuels significant demand for high-performance nylon 6 materials in components like dashboards, interior trim, and fuel lines. Simultaneously, the burgeoning textile and carpet industries, especially in developing economies, contribute to the market's upward trajectory. Furthermore, technological advancements leading to the development of more durable and sustainable nylon 6 products are fostering market growth. However, fluctuations in raw material prices, particularly phenol and cyclohexane, pose a significant challenge. Stringent environmental regulations and concerns regarding the environmental impact of nylon 6 production also act as potential restraints on market expansion. The market is segmented by raw materials (phenol, cyclohexane), end products (Nylon 6 resins, Nylon 6 fibers, other end products), applications (engineering resins and films, industrial yarns, textiles and carpets, other applications), and end-user industries (automotive, carpet, textile, other end-user industries). Key players like Sumitomo Chemical, BASF, and Toray Industries hold significant market share, actively engaging in strategic expansions and collaborations to consolidate their position. Geographic growth is largely concentrated in Asia-Pacific, driven by China's robust industrial growth and expanding manufacturing base.
The forecast period (2025-2033) anticipates continued growth, albeit with potential variations influenced by global economic conditions and technological advancements within the polymer industry. The market’s segmentation offers opportunities for specialized players focusing on specific applications or geographic regions. Companies are likely to focus on sustainable manufacturing processes and innovative product development to maintain competitiveness in an increasingly environmentally conscious market. Despite potential headwinds, the long-term outlook for the caprolactam market remains positive, underpinned by the sustained demand for nylon 6-based products across a wide range of applications and industries.
Caprolactam Industry Market Report: 2019-2033
This comprehensive report provides an in-depth analysis of the global caprolactam industry, covering market size, growth drivers, competitive landscape, and future outlook from 2019 to 2033. The study period spans the historical period (2019-2024), the base year (2025), and the forecast period (2025-2033). This report is essential for industry stakeholders, investors, and researchers seeking a clear understanding of this dynamic market. It features detailed segmentations, including raw materials (phenol, cyclohexane), end products (nylon 6 resins, nylon 6 fibers, other end products), applications (engineering resins and films, industrial yarns, textiles and carpets, other applications), and end-user industries (automotive, carpet, textile, other end-user industries).
Caprolactam Industry Market Structure & Competitive Dynamics
The global caprolactam market is characterized by a moderately concentrated structure, with several major players holding significant market share. The industry's competitive dynamics are shaped by factors including innovation ecosystems, stringent regulatory frameworks, the availability of product substitutes, evolving end-user trends, and ongoing mergers and acquisitions (M&A) activities. Market share calculations reveal that the top five players collectively account for approximately xx% of the global market in 2025, indicating a moderate level of concentration. However, the presence of numerous smaller regional players ensures a competitive landscape. Innovation plays a crucial role, with companies investing in R&D to enhance product quality and efficiency. Stringent environmental regulations influence production processes and necessitate compliance. The availability of substitute materials poses a challenge, requiring continuous innovation to maintain market share. Finally, M&A activities, such as the xx Million deal between [Company A] and [Company B] in 2024, reshape the competitive landscape by expanding production capacity and market reach.
- Market Concentration: Moderately concentrated, with top 5 players holding approximately xx% market share in 2025.
- Innovation Ecosystems: Companies focus on R&D to improve product quality, efficiency, and sustainability.
- Regulatory Frameworks: Stringent environmental regulations influence production processes and cost structures.
- Product Substitutes: The presence of substitute materials creates competitive pressure.
- End-User Trends: Shifts in end-user demand (e.g., growth in automotive and textile sectors) impact market dynamics.
- M&A Activities: Consolidation through mergers and acquisitions are reshaping the competitive landscape.
Caprolactam Industry Industry Trends & Insights
The global caprolactam market exhibits a robust growth trajectory, driven by several key factors. The increasing demand for nylon 6 products across various applications, such as automotive, textiles, and carpets, is a primary growth driver. The automotive industry's expansion and the rising preference for lightweight materials contribute significantly to the demand for nylon 6 resins. Similarly, growth in the textile and carpet sectors fuels demand for nylon 6 fibers. The CAGR for the global caprolactam market is projected to be xx% from 2025 to 2033. Technological advancements, such as the development of high-performance caprolactam grades with enhanced properties, are further fueling market expansion. However, factors like fluctuations in raw material prices and economic slowdowns in certain regions might pose challenges. Market penetration of caprolactam in new applications, including specialized engineering plastics, continues to increase. Competitive dynamics are shaped by companies' strategies to enhance efficiency, expand production capacity, and develop innovative products.
Dominant Markets & Segments in Caprolactam Industry
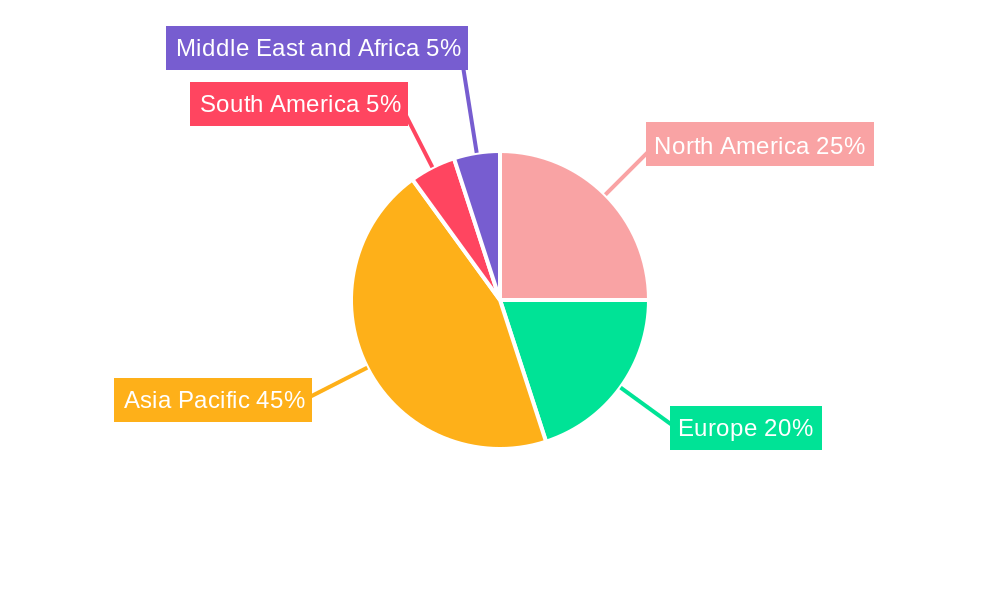
The Asia-Pacific region holds the dominant position in the global caprolactam market, driven by rapid industrialization, rising disposable incomes, and robust growth in the end-user industries. Within this region, China stands out as a key market due to its large-scale manufacturing activities.
- Leading Region: Asia-Pacific, due to rapid industrialization, rising incomes, and robust end-user industries.
- Leading Country: China, owing to its extensive manufacturing sector and high demand for nylon 6 products.
- Dominant Raw Material: Cyclohexane, due to its widespread availability and cost-effectiveness.
- Dominant End Product: Nylon 6 Fibers, driven by high demand from the textile and carpet sectors.
- Dominant Application: Textiles and Carpets, due to the extensive use of nylon 6 fibers in these sectors.
- Dominant End-user Industry: Textile Industry, fueled by growing global apparel consumption.
Key Drivers for Asia-Pacific Dominance:
- Favorable government policies supporting industrial growth.
- Increasing investment in infrastructure development.
- Strong domestic demand from a large and growing population.
Caprolactam Industry Product Innovations
Recent innovations in the caprolactam industry focus on enhancing product properties to meet the evolving needs of various applications. Companies are developing high-performance grades with improved strength, durability, and resistance to chemicals and heat. This is aligned with the industry’s trend toward sustainable manufacturing practices and the growing demand for environmentally friendly materials. New applications for caprolactam are being explored, expanding market opportunities. The development of specialty polymers derived from caprolactam is a key area of focus for future growth.
Report Segmentation & Scope
This report segments the caprolactam market based on raw materials (phenol and cyclohexane), end products (nylon 6 resins, nylon 6 fibers, and other end products), applications (engineering resins and films, industrial yarns, textiles and carpets, and other applications), and end-user industries (automotive, carpet, textile, and other end-user industries). Each segment is analyzed in detail, providing market size, growth projections, and competitive dynamics. The report encompasses a detailed analysis of historical data (2019-2024), providing a base year for forecasting market trends during the forecast period (2025-2033).
Key Drivers of Caprolactam Industry Growth
Several factors fuel the growth of the caprolactam industry. The escalating demand for nylon 6 polymers in diverse sectors, notably automotive and textiles, is a primary driver. Technological advancements leading to improved product quality and efficiency contribute significantly. Favorable government policies supporting industrial development in key markets also play a crucial role. Furthermore, the rising disposable incomes in developing economies further fuel demand.
Challenges in the Caprolactam Industry Sector
The caprolactam industry faces challenges such as volatility in raw material prices, particularly cyclohexane and phenol. Stringent environmental regulations necessitate compliance and investment in emission control technologies. Intense competition from substitute materials also poses a threat to market share. Supply chain disruptions can impact production and delivery timelines.
Leading Players in the Caprolactam Industry Market
- Sumitomo Chemical Co Ltd
- Fujian Jinjiang Petrochemical
- Fibrant
- AdvanSix Inc
- Juhua Group Corporation
- UBE Corporation
- Fertilisers And Chemicals Travancore Limited (FACT)
- Alpek S A B de CV
- Toray Industries Inc
- Domo Chemicals
- Capro Co
- China Petrochemical Development Corporation
- BASF SE
- Shandong Haili Chemical Industry Co Ltd
- Lanxess
- PJSC Kuibyshevazot
- Xuyang Group
- China Petroleum & Chemical Corporation (Sinopec)
Key Developments in Caprolactam Industry Sector
- September 2022: Xuyang Group increased its caprolactam production capacity to 750,000 tons per year.
- April 2022: Sumitomo Chemical exited the caprolactam business, closing its production facilities.
- March 2022: Domo Chemicals expanded its caprolactam production capacity to 500,000 tons/year.
Strategic Caprolactam Industry Market Outlook
The future of the caprolactam market appears promising, driven by the sustained growth of end-user industries and continuous product innovation. Strategic opportunities exist for companies to expand into new markets, develop sustainable production processes, and explore innovative applications. Focusing on high-performance grades, tailored to specific customer needs, will be crucial for success. Investment in research and development, along with efficient supply chain management, will be key determinants of future market leadership.
Caprolactam Industry Segmentation
-
1. Raw Material
- 1.1. Phenol
- 1.2. Cyclohexane
-
2. End Product
- 2.1. Nylon 6 Resins
- 2.2. Nylon 6 Fibers
- 2.3. Other End Products
-
3. Application
- 3.1. Engineering Resins and Films
- 3.2. Industrial Yarns
- 3.3. Textiles and Carpets
- 3.4. Other Applications
-
4. End-user Industry
- 4.1. Automotive
- 4.2. Carpet
- 4.3. Textile
- 4.4. Other End-user Industries
Caprolactam Industry Segmentation By Geography
-
1. Asia Pacific
- 1.1. China
- 1.2. Japan
- 1.3. South Korea
- 1.4. Rest of Asia Pacific
-
2. North America
- 2.1. United States
- 2.2. Canada
- 2.3. Mexico
-
3. Europe
- 3.1. Germany
- 3.2. United Kingdom
- 3.3. France
- 3.4. Italy
- 3.5. Rest of Europe
-
4. South America
- 4.1. Brazil
- 4.2. Argentina
- 4.3. Rest of South America
-
5. Middle East and Africa
- 5.1. Saudi Arabia
- 5.2. South Africa
- 5.3. Rest of Middle East and Africa
Caprolactam Industry REPORT HIGHLIGHTS
| Aspects | Details |
|---|---|
| Study Period | 2019-2033 |
| Base Year | 2024 |
| Estimated Year | 2025 |
| Forecast Period | 2025-2033 |
| Historical Period | 2019-2024 |
| Growth Rate | CAGR of > 3.00% from 2019-2033 |
| Segmentation |
|
Table of Contents
- 1. Introduction
- 1.1. Research Scope
- 1.2. Market Segmentation
- 1.3. Research Methodology
- 1.4. Definitions and Assumptions
- 2. Executive Summary
- 2.1. Introduction
- 3. Market Dynamics
- 3.1. Introduction
- 3.2. Market Drivers
- 3.2.1. Growing Production Capacity of Nylon 6
- 3.3. Market Restrains
- 3.3.1. Toxicity of caprolactam; Presence of substitute products for Nylon-6
- 3.4. Market Trends
- 3.4.1. Increasing Demand for Textile and Carpets
- 4. Market Factor Analysis
- 4.1. Porters Five Forces
- 4.2. Supply/Value Chain
- 4.3. PESTEL analysis
- 4.4. Market Entropy
- 4.5. Patent/Trademark Analysis
- 5. Global Caprolactam Industry Analysis, Insights and Forecast, 2019-2031
- 5.1. Market Analysis, Insights and Forecast - by Raw Material
- 5.1.1. Phenol
- 5.1.2. Cyclohexane
- 5.2. Market Analysis, Insights and Forecast - by End Product
- 5.2.1. Nylon 6 Resins
- 5.2.2. Nylon 6 Fibers
- 5.2.3. Other End Products
- 5.3. Market Analysis, Insights and Forecast - by Application
- 5.3.1. Engineering Resins and Films
- 5.3.2. Industrial Yarns
- 5.3.3. Textiles and Carpets
- 5.3.4. Other Applications
- 5.4. Market Analysis, Insights and Forecast - by End-user Industry
- 5.4.1. Automotive
- 5.4.2. Carpet
- 5.4.3. Textile
- 5.4.4. Other End-user Industries
- 5.5. Market Analysis, Insights and Forecast - by Region
- 5.5.1. Asia Pacific
- 5.5.2. North America
- 5.5.3. Europe
- 5.5.4. South America
- 5.5.5. Middle East and Africa
- 5.1. Market Analysis, Insights and Forecast - by Raw Material
- 6. Asia Pacific Caprolactam Industry Analysis, Insights and Forecast, 2019-2031
- 6.1. Market Analysis, Insights and Forecast - by Raw Material
- 6.1.1. Phenol
- 6.1.2. Cyclohexane
- 6.2. Market Analysis, Insights and Forecast - by End Product
- 6.2.1. Nylon 6 Resins
- 6.2.2. Nylon 6 Fibers
- 6.2.3. Other End Products
- 6.3. Market Analysis, Insights and Forecast - by Application
- 6.3.1. Engineering Resins and Films
- 6.3.2. Industrial Yarns
- 6.3.3. Textiles and Carpets
- 6.3.4. Other Applications
- 6.4. Market Analysis, Insights and Forecast - by End-user Industry
- 6.4.1. Automotive
- 6.4.2. Carpet
- 6.4.3. Textile
- 6.4.4. Other End-user Industries
- 6.1. Market Analysis, Insights and Forecast - by Raw Material
- 7. North America Caprolactam Industry Analysis, Insights and Forecast, 2019-2031
- 7.1. Market Analysis, Insights and Forecast - by Raw Material
- 7.1.1. Phenol
- 7.1.2. Cyclohexane
- 7.2. Market Analysis, Insights and Forecast - by End Product
- 7.2.1. Nylon 6 Resins
- 7.2.2. Nylon 6 Fibers
- 7.2.3. Other End Products
- 7.3. Market Analysis, Insights and Forecast - by Application
- 7.3.1. Engineering Resins and Films
- 7.3.2. Industrial Yarns
- 7.3.3. Textiles and Carpets
- 7.3.4. Other Applications
- 7.4. Market Analysis, Insights and Forecast - by End-user Industry
- 7.4.1. Automotive
- 7.4.2. Carpet
- 7.4.3. Textile
- 7.4.4. Other End-user Industries
- 7.1. Market Analysis, Insights and Forecast - by Raw Material
- 8. Europe Caprolactam Industry Analysis, Insights and Forecast, 2019-2031
- 8.1. Market Analysis, Insights and Forecast - by Raw Material
- 8.1.1. Phenol
- 8.1.2. Cyclohexane
- 8.2. Market Analysis, Insights and Forecast - by End Product
- 8.2.1. Nylon 6 Resins
- 8.2.2. Nylon 6 Fibers
- 8.2.3. Other End Products
- 8.3. Market Analysis, Insights and Forecast - by Application
- 8.3.1. Engineering Resins and Films
- 8.3.2. Industrial Yarns
- 8.3.3. Textiles and Carpets
- 8.3.4. Other Applications
- 8.4. Market Analysis, Insights and Forecast - by End-user Industry
- 8.4.1. Automotive
- 8.4.2. Carpet
- 8.4.3. Textile
- 8.4.4. Other End-user Industries
- 8.1. Market Analysis, Insights and Forecast - by Raw Material
- 9. South America Caprolactam Industry Analysis, Insights and Forecast, 2019-2031
- 9.1. Market Analysis, Insights and Forecast - by Raw Material
- 9.1.1. Phenol
- 9.1.2. Cyclohexane
- 9.2. Market Analysis, Insights and Forecast - by End Product
- 9.2.1. Nylon 6 Resins
- 9.2.2. Nylon 6 Fibers
- 9.2.3. Other End Products
- 9.3. Market Analysis, Insights and Forecast - by Application
- 9.3.1. Engineering Resins and Films
- 9.3.2. Industrial Yarns
- 9.3.3. Textiles and Carpets
- 9.3.4. Other Applications
- 9.4. Market Analysis, Insights and Forecast - by End-user Industry
- 9.4.1. Automotive
- 9.4.2. Carpet
- 9.4.3. Textile
- 9.4.4. Other End-user Industries
- 9.1. Market Analysis, Insights and Forecast - by Raw Material
- 10. Middle East and Africa Caprolactam Industry Analysis, Insights and Forecast, 2019-2031
- 10.1. Market Analysis, Insights and Forecast - by Raw Material
- 10.1.1. Phenol
- 10.1.2. Cyclohexane
- 10.2. Market Analysis, Insights and Forecast - by End Product
- 10.2.1. Nylon 6 Resins
- 10.2.2. Nylon 6 Fibers
- 10.2.3. Other End Products
- 10.3. Market Analysis, Insights and Forecast - by Application
- 10.3.1. Engineering Resins and Films
- 10.3.2. Industrial Yarns
- 10.3.3. Textiles and Carpets
- 10.3.4. Other Applications
- 10.4. Market Analysis, Insights and Forecast - by End-user Industry
- 10.4.1. Automotive
- 10.4.2. Carpet
- 10.4.3. Textile
- 10.4.4. Other End-user Industries
- 10.1. Market Analysis, Insights and Forecast - by Raw Material
- 11. Asia Pacific Caprolactam Industry Analysis, Insights and Forecast, 2019-2031
- 11.1. Market Analysis, Insights and Forecast - By Country/Sub-region
- 11.1.1 China
- 11.1.2 Japan
- 11.1.3 South Korea
- 11.1.4 Rest of Asia Pacific
- 12. North America Caprolactam Industry Analysis, Insights and Forecast, 2019-2031
- 12.1. Market Analysis, Insights and Forecast - By Country/Sub-region
- 12.1.1 United States
- 12.1.2 Canada
- 12.1.3 Mexico
- 13. Europe Caprolactam Industry Analysis, Insights and Forecast, 2019-2031
- 13.1. Market Analysis, Insights and Forecast - By Country/Sub-region
- 13.1.1 Germany
- 13.1.2 United Kingdom
- 13.1.3 France
- 13.1.4 Italy
- 13.1.5 Rest of Europe
- 14. South America Caprolactam Industry Analysis, Insights and Forecast, 2019-2031
- 14.1. Market Analysis, Insights and Forecast - By Country/Sub-region
- 14.1.1 Brazil
- 14.1.2 Argentina
- 14.1.3 Rest of South America
- 15. Middle East and Africa Caprolactam Industry Analysis, Insights and Forecast, 2019-2031
- 15.1. Market Analysis, Insights and Forecast - By Country/Sub-region
- 15.1.1 Saudi Arabia
- 15.1.2 South Africa
- 15.1.3 Rest of Middle East and Africa
- 16. Competitive Analysis
- 16.1. Global Market Share Analysis 2024
- 16.2. Company Profiles
- 16.2.1 Sumitomo Chemical Co Ltd
- 16.2.1.1. Overview
- 16.2.1.2. Products
- 16.2.1.3. SWOT Analysis
- 16.2.1.4. Recent Developments
- 16.2.1.5. Financials (Based on Availability)
- 16.2.2 Fujian Jinjiang Petrochemical
- 16.2.2.1. Overview
- 16.2.2.2. Products
- 16.2.2.3. SWOT Analysis
- 16.2.2.4. Recent Developments
- 16.2.2.5. Financials (Based on Availability)
- 16.2.3 Fibrant
- 16.2.3.1. Overview
- 16.2.3.2. Products
- 16.2.3.3. SWOT Analysis
- 16.2.3.4. Recent Developments
- 16.2.3.5. Financials (Based on Availability)
- 16.2.4 AdvanSix Inc
- 16.2.4.1. Overview
- 16.2.4.2. Products
- 16.2.4.3. SWOT Analysis
- 16.2.4.4. Recent Developments
- 16.2.4.5. Financials (Based on Availability)
- 16.2.5 Juhua Group Corporation
- 16.2.5.1. Overview
- 16.2.5.2. Products
- 16.2.5.3. SWOT Analysis
- 16.2.5.4. Recent Developments
- 16.2.5.5. Financials (Based on Availability)
- 16.2.6 UBE Corporation
- 16.2.6.1. Overview
- 16.2.6.2. Products
- 16.2.6.3. SWOT Analysis
- 16.2.6.4. Recent Developments
- 16.2.6.5. Financials (Based on Availability)
- 16.2.7 Fertilisers And Chemicals Travancore Limited (FACT)
- 16.2.7.1. Overview
- 16.2.7.2. Products
- 16.2.7.3. SWOT Analysis
- 16.2.7.4. Recent Developments
- 16.2.7.5. Financials (Based on Availability)
- 16.2.8 Alpek S A B de CV
- 16.2.8.1. Overview
- 16.2.8.2. Products
- 16.2.8.3. SWOT Analysis
- 16.2.8.4. Recent Developments
- 16.2.8.5. Financials (Based on Availability)
- 16.2.9 Toray Industries Inc
- 16.2.9.1. Overview
- 16.2.9.2. Products
- 16.2.9.3. SWOT Analysis
- 16.2.9.4. Recent Developments
- 16.2.9.5. Financials (Based on Availability)
- 16.2.10 Domo Chemicals
- 16.2.10.1. Overview
- 16.2.10.2. Products
- 16.2.10.3. SWOT Analysis
- 16.2.10.4. Recent Developments
- 16.2.10.5. Financials (Based on Availability)
- 16.2.11 Capro Co
- 16.2.11.1. Overview
- 16.2.11.2. Products
- 16.2.11.3. SWOT Analysis
- 16.2.11.4. Recent Developments
- 16.2.11.5. Financials (Based on Availability)
- 16.2.12 China Petrochemical Development Corporation
- 16.2.12.1. Overview
- 16.2.12.2. Products
- 16.2.12.3. SWOT Analysis
- 16.2.12.4. Recent Developments
- 16.2.12.5. Financials (Based on Availability)
- 16.2.13 BASF SE
- 16.2.13.1. Overview
- 16.2.13.2. Products
- 16.2.13.3. SWOT Analysis
- 16.2.13.4. Recent Developments
- 16.2.13.5. Financials (Based on Availability)
- 16.2.14 Shandong Haili Chemical Industry Co Ltd
- 16.2.14.1. Overview
- 16.2.14.2. Products
- 16.2.14.3. SWOT Analysis
- 16.2.14.4. Recent Developments
- 16.2.14.5. Financials (Based on Availability)
- 16.2.15 Lanxess
- 16.2.15.1. Overview
- 16.2.15.2. Products
- 16.2.15.3. SWOT Analysis
- 16.2.15.4. Recent Developments
- 16.2.15.5. Financials (Based on Availability)
- 16.2.16 PJSC Kuibyshevazot
- 16.2.16.1. Overview
- 16.2.16.2. Products
- 16.2.16.3. SWOT Analysis
- 16.2.16.4. Recent Developments
- 16.2.16.5. Financials (Based on Availability)
- 16.2.17 Xuyang Group*List Not Exhaustive
- 16.2.17.1. Overview
- 16.2.17.2. Products
- 16.2.17.3. SWOT Analysis
- 16.2.17.4. Recent Developments
- 16.2.17.5. Financials (Based on Availability)
- 16.2.18 China Petroleum & Chemical Corporation (Sinopec)
- 16.2.18.1. Overview
- 16.2.18.2. Products
- 16.2.18.3. SWOT Analysis
- 16.2.18.4. Recent Developments
- 16.2.18.5. Financials (Based on Availability)
- 16.2.1 Sumitomo Chemical Co Ltd
List of Figures
- Figure 1: Global Caprolactam Industry Revenue Breakdown (Million, %) by Region 2024 & 2032
- Figure 2: Asia Pacific Caprolactam Industry Revenue (Million), by Country 2024 & 2032
- Figure 3: Asia Pacific Caprolactam Industry Revenue Share (%), by Country 2024 & 2032
- Figure 4: North America Caprolactam Industry Revenue (Million), by Country 2024 & 2032
- Figure 5: North America Caprolactam Industry Revenue Share (%), by Country 2024 & 2032
- Figure 6: Europe Caprolactam Industry Revenue (Million), by Country 2024 & 2032
- Figure 7: Europe Caprolactam Industry Revenue Share (%), by Country 2024 & 2032
- Figure 8: South America Caprolactam Industry Revenue (Million), by Country 2024 & 2032
- Figure 9: South America Caprolactam Industry Revenue Share (%), by Country 2024 & 2032
- Figure 10: Middle East and Africa Caprolactam Industry Revenue (Million), by Country 2024 & 2032
- Figure 11: Middle East and Africa Caprolactam Industry Revenue Share (%), by Country 2024 & 2032
- Figure 12: Asia Pacific Caprolactam Industry Revenue (Million), by Raw Material 2024 & 2032
- Figure 13: Asia Pacific Caprolactam Industry Revenue Share (%), by Raw Material 2024 & 2032
- Figure 14: Asia Pacific Caprolactam Industry Revenue (Million), by End Product 2024 & 2032
- Figure 15: Asia Pacific Caprolactam Industry Revenue Share (%), by End Product 2024 & 2032
- Figure 16: Asia Pacific Caprolactam Industry Revenue (Million), by Application 2024 & 2032
- Figure 17: Asia Pacific Caprolactam Industry Revenue Share (%), by Application 2024 & 2032
- Figure 18: Asia Pacific Caprolactam Industry Revenue (Million), by End-user Industry 2024 & 2032
- Figure 19: Asia Pacific Caprolactam Industry Revenue Share (%), by End-user Industry 2024 & 2032
- Figure 20: Asia Pacific Caprolactam Industry Revenue (Million), by Country 2024 & 2032
- Figure 21: Asia Pacific Caprolactam Industry Revenue Share (%), by Country 2024 & 2032
- Figure 22: North America Caprolactam Industry Revenue (Million), by Raw Material 2024 & 2032
- Figure 23: North America Caprolactam Industry Revenue Share (%), by Raw Material 2024 & 2032
- Figure 24: North America Caprolactam Industry Revenue (Million), by End Product 2024 & 2032
- Figure 25: North America Caprolactam Industry Revenue Share (%), by End Product 2024 & 2032
- Figure 26: North America Caprolactam Industry Revenue (Million), by Application 2024 & 2032
- Figure 27: North America Caprolactam Industry Revenue Share (%), by Application 2024 & 2032
- Figure 28: North America Caprolactam Industry Revenue (Million), by End-user Industry 2024 & 2032
- Figure 29: North America Caprolactam Industry Revenue Share (%), by End-user Industry 2024 & 2032
- Figure 30: North America Caprolactam Industry Revenue (Million), by Country 2024 & 2032
- Figure 31: North America Caprolactam Industry Revenue Share (%), by Country 2024 & 2032
- Figure 32: Europe Caprolactam Industry Revenue (Million), by Raw Material 2024 & 2032
- Figure 33: Europe Caprolactam Industry Revenue Share (%), by Raw Material 2024 & 2032
- Figure 34: Europe Caprolactam Industry Revenue (Million), by End Product 2024 & 2032
- Figure 35: Europe Caprolactam Industry Revenue Share (%), by End Product 2024 & 2032
- Figure 36: Europe Caprolactam Industry Revenue (Million), by Application 2024 & 2032
- Figure 37: Europe Caprolactam Industry Revenue Share (%), by Application 2024 & 2032
- Figure 38: Europe Caprolactam Industry Revenue (Million), by End-user Industry 2024 & 2032
- Figure 39: Europe Caprolactam Industry Revenue Share (%), by End-user Industry 2024 & 2032
- Figure 40: Europe Caprolactam Industry Revenue (Million), by Country 2024 & 2032
- Figure 41: Europe Caprolactam Industry Revenue Share (%), by Country 2024 & 2032
- Figure 42: South America Caprolactam Industry Revenue (Million), by Raw Material 2024 & 2032
- Figure 43: South America Caprolactam Industry Revenue Share (%), by Raw Material 2024 & 2032
- Figure 44: South America Caprolactam Industry Revenue (Million), by End Product 2024 & 2032
- Figure 45: South America Caprolactam Industry Revenue Share (%), by End Product 2024 & 2032
- Figure 46: South America Caprolactam Industry Revenue (Million), by Application 2024 & 2032
- Figure 47: South America Caprolactam Industry Revenue Share (%), by Application 2024 & 2032
- Figure 48: South America Caprolactam Industry Revenue (Million), by End-user Industry 2024 & 2032
- Figure 49: South America Caprolactam Industry Revenue Share (%), by End-user Industry 2024 & 2032
- Figure 50: South America Caprolactam Industry Revenue (Million), by Country 2024 & 2032
- Figure 51: South America Caprolactam Industry Revenue Share (%), by Country 2024 & 2032
- Figure 52: Middle East and Africa Caprolactam Industry Revenue (Million), by Raw Material 2024 & 2032
- Figure 53: Middle East and Africa Caprolactam Industry Revenue Share (%), by Raw Material 2024 & 2032
- Figure 54: Middle East and Africa Caprolactam Industry Revenue (Million), by End Product 2024 & 2032
- Figure 55: Middle East and Africa Caprolactam Industry Revenue Share (%), by End Product 2024 & 2032
- Figure 56: Middle East and Africa Caprolactam Industry Revenue (Million), by Application 2024 & 2032
- Figure 57: Middle East and Africa Caprolactam Industry Revenue Share (%), by Application 2024 & 2032
- Figure 58: Middle East and Africa Caprolactam Industry Revenue (Million), by End-user Industry 2024 & 2032
- Figure 59: Middle East and Africa Caprolactam Industry Revenue Share (%), by End-user Industry 2024 & 2032
- Figure 60: Middle East and Africa Caprolactam Industry Revenue (Million), by Country 2024 & 2032
- Figure 61: Middle East and Africa Caprolactam Industry Revenue Share (%), by Country 2024 & 2032
List of Tables
- Table 1: Global Caprolactam Industry Revenue Million Forecast, by Region 2019 & 2032
- Table 2: Global Caprolactam Industry Revenue Million Forecast, by Raw Material 2019 & 2032
- Table 3: Global Caprolactam Industry Revenue Million Forecast, by End Product 2019 & 2032
- Table 4: Global Caprolactam Industry Revenue Million Forecast, by Application 2019 & 2032
- Table 5: Global Caprolactam Industry Revenue Million Forecast, by End-user Industry 2019 & 2032
- Table 6: Global Caprolactam Industry Revenue Million Forecast, by Region 2019 & 2032
- Table 7: Global Caprolactam Industry Revenue Million Forecast, by Country 2019 & 2032
- Table 8: China Caprolactam Industry Revenue (Million) Forecast, by Application 2019 & 2032
- Table 9: Japan Caprolactam Industry Revenue (Million) Forecast, by Application 2019 & 2032
- Table 10: South Korea Caprolactam Industry Revenue (Million) Forecast, by Application 2019 & 2032
- Table 11: Rest of Asia Pacific Caprolactam Industry Revenue (Million) Forecast, by Application 2019 & 2032
- Table 12: Global Caprolactam Industry Revenue Million Forecast, by Country 2019 & 2032
- Table 13: United States Caprolactam Industry Revenue (Million) Forecast, by Application 2019 & 2032
- Table 14: Canada Caprolactam Industry Revenue (Million) Forecast, by Application 2019 & 2032
- Table 15: Mexico Caprolactam Industry Revenue (Million) Forecast, by Application 2019 & 2032
- Table 16: Global Caprolactam Industry Revenue Million Forecast, by Country 2019 & 2032
- Table 17: Germany Caprolactam Industry Revenue (Million) Forecast, by Application 2019 & 2032
- Table 18: United Kingdom Caprolactam Industry Revenue (Million) Forecast, by Application 2019 & 2032
- Table 19: France Caprolactam Industry Revenue (Million) Forecast, by Application 2019 & 2032
- Table 20: Italy Caprolactam Industry Revenue (Million) Forecast, by Application 2019 & 2032
- Table 21: Rest of Europe Caprolactam Industry Revenue (Million) Forecast, by Application 2019 & 2032
- Table 22: Global Caprolactam Industry Revenue Million Forecast, by Country 2019 & 2032
- Table 23: Brazil Caprolactam Industry Revenue (Million) Forecast, by Application 2019 & 2032
- Table 24: Argentina Caprolactam Industry Revenue (Million) Forecast, by Application 2019 & 2032
- Table 25: Rest of South America Caprolactam Industry Revenue (Million) Forecast, by Application 2019 & 2032
- Table 26: Global Caprolactam Industry Revenue Million Forecast, by Country 2019 & 2032
- Table 27: Saudi Arabia Caprolactam Industry Revenue (Million) Forecast, by Application 2019 & 2032
- Table 28: South Africa Caprolactam Industry Revenue (Million) Forecast, by Application 2019 & 2032
- Table 29: Rest of Middle East and Africa Caprolactam Industry Revenue (Million) Forecast, by Application 2019 & 2032
- Table 30: Global Caprolactam Industry Revenue Million Forecast, by Raw Material 2019 & 2032
- Table 31: Global Caprolactam Industry Revenue Million Forecast, by End Product 2019 & 2032
- Table 32: Global Caprolactam Industry Revenue Million Forecast, by Application 2019 & 2032
- Table 33: Global Caprolactam Industry Revenue Million Forecast, by End-user Industry 2019 & 2032
- Table 34: Global Caprolactam Industry Revenue Million Forecast, by Country 2019 & 2032
- Table 35: China Caprolactam Industry Revenue (Million) Forecast, by Application 2019 & 2032
- Table 36: Japan Caprolactam Industry Revenue (Million) Forecast, by Application 2019 & 2032
- Table 37: South Korea Caprolactam Industry Revenue (Million) Forecast, by Application 2019 & 2032
- Table 38: Rest of Asia Pacific Caprolactam Industry Revenue (Million) Forecast, by Application 2019 & 2032
- Table 39: Global Caprolactam Industry Revenue Million Forecast, by Raw Material 2019 & 2032
- Table 40: Global Caprolactam Industry Revenue Million Forecast, by End Product 2019 & 2032
- Table 41: Global Caprolactam Industry Revenue Million Forecast, by Application 2019 & 2032
- Table 42: Global Caprolactam Industry Revenue Million Forecast, by End-user Industry 2019 & 2032
- Table 43: Global Caprolactam Industry Revenue Million Forecast, by Country 2019 & 2032
- Table 44: United States Caprolactam Industry Revenue (Million) Forecast, by Application 2019 & 2032
- Table 45: Canada Caprolactam Industry Revenue (Million) Forecast, by Application 2019 & 2032
- Table 46: Mexico Caprolactam Industry Revenue (Million) Forecast, by Application 2019 & 2032
- Table 47: Global Caprolactam Industry Revenue Million Forecast, by Raw Material 2019 & 2032
- Table 48: Global Caprolactam Industry Revenue Million Forecast, by End Product 2019 & 2032
- Table 49: Global Caprolactam Industry Revenue Million Forecast, by Application 2019 & 2032
- Table 50: Global Caprolactam Industry Revenue Million Forecast, by End-user Industry 2019 & 2032
- Table 51: Global Caprolactam Industry Revenue Million Forecast, by Country 2019 & 2032
- Table 52: Germany Caprolactam Industry Revenue (Million) Forecast, by Application 2019 & 2032
- Table 53: United Kingdom Caprolactam Industry Revenue (Million) Forecast, by Application 2019 & 2032
- Table 54: France Caprolactam Industry Revenue (Million) Forecast, by Application 2019 & 2032
- Table 55: Italy Caprolactam Industry Revenue (Million) Forecast, by Application 2019 & 2032
- Table 56: Rest of Europe Caprolactam Industry Revenue (Million) Forecast, by Application 2019 & 2032
- Table 57: Global Caprolactam Industry Revenue Million Forecast, by Raw Material 2019 & 2032
- Table 58: Global Caprolactam Industry Revenue Million Forecast, by End Product 2019 & 2032
- Table 59: Global Caprolactam Industry Revenue Million Forecast, by Application 2019 & 2032
- Table 60: Global Caprolactam Industry Revenue Million Forecast, by End-user Industry 2019 & 2032
- Table 61: Global Caprolactam Industry Revenue Million Forecast, by Country 2019 & 2032
- Table 62: Brazil Caprolactam Industry Revenue (Million) Forecast, by Application 2019 & 2032
- Table 63: Argentina Caprolactam Industry Revenue (Million) Forecast, by Application 2019 & 2032
- Table 64: Rest of South America Caprolactam Industry Revenue (Million) Forecast, by Application 2019 & 2032
- Table 65: Global Caprolactam Industry Revenue Million Forecast, by Raw Material 2019 & 2032
- Table 66: Global Caprolactam Industry Revenue Million Forecast, by End Product 2019 & 2032
- Table 67: Global Caprolactam Industry Revenue Million Forecast, by Application 2019 & 2032
- Table 68: Global Caprolactam Industry Revenue Million Forecast, by End-user Industry 2019 & 2032
- Table 69: Global Caprolactam Industry Revenue Million Forecast, by Country 2019 & 2032
- Table 70: Saudi Arabia Caprolactam Industry Revenue (Million) Forecast, by Application 2019 & 2032
- Table 71: South Africa Caprolactam Industry Revenue (Million) Forecast, by Application 2019 & 2032
- Table 72: Rest of Middle East and Africa Caprolactam Industry Revenue (Million) Forecast, by Application 2019 & 2032
Frequently Asked Questions
1. What is the projected Compound Annual Growth Rate (CAGR) of the Caprolactam Industry?
The projected CAGR is approximately > 3.00%.
2. Which companies are prominent players in the Caprolactam Industry?
Key companies in the market include Sumitomo Chemical Co Ltd, Fujian Jinjiang Petrochemical, Fibrant, AdvanSix Inc, Juhua Group Corporation, UBE Corporation, Fertilisers And Chemicals Travancore Limited (FACT), Alpek S A B de CV, Toray Industries Inc, Domo Chemicals, Capro Co, China Petrochemical Development Corporation, BASF SE, Shandong Haili Chemical Industry Co Ltd, Lanxess, PJSC Kuibyshevazot, Xuyang Group*List Not Exhaustive, China Petroleum & Chemical Corporation (Sinopec).
3. What are the main segments of the Caprolactam Industry?
The market segments include Raw Material, End Product, Application, End-user Industry.
4. Can you provide details about the market size?
The market size is estimated to be USD XX Million as of 2022.
5. What are some drivers contributing to market growth?
Growing Production Capacity of Nylon 6.
6. What are the notable trends driving market growth?
Increasing Demand for Textile and Carpets.
7. Are there any restraints impacting market growth?
Toxicity of caprolactam; Presence of substitute products for Nylon-6.
8. Can you provide examples of recent developments in the market?
In September 2022, Xuyang Group at its Cangzhou Park site started the production of caprolactam post-completion of its second phase of the 300,000 tons per year caprolactam expansion project. With this expansion project, the company's total production capacity increased to 750,000 tons per year.
9. What pricing options are available for accessing the report?
Pricing options include single-user, multi-user, and enterprise licenses priced at USD 4750, USD 5250, and USD 8750 respectively.
10. Is the market size provided in terms of value or volume?
The market size is provided in terms of value, measured in Million.
11. Are there any specific market keywords associated with the report?
Yes, the market keyword associated with the report is "Caprolactam Industry," which aids in identifying and referencing the specific market segment covered.
12. How do I determine which pricing option suits my needs best?
The pricing options vary based on user requirements and access needs. Individual users may opt for single-user licenses, while businesses requiring broader access may choose multi-user or enterprise licenses for cost-effective access to the report.
13. Are there any additional resources or data provided in the Caprolactam Industry report?
While the report offers comprehensive insights, it's advisable to review the specific contents or supplementary materials provided to ascertain if additional resources or data are available.
14. How can I stay updated on further developments or reports in the Caprolactam Industry?
To stay informed about further developments, trends, and reports in the Caprolactam Industry, consider subscribing to industry newsletters, following relevant companies and organizations, or regularly checking reputable industry news sources and publications.
Methodology
Step 1 - Identification of Relevant Samples Size from Population Database


Step 2 - Approaches for Defining Global Market Size (Value, Volume* & Price*)

Note*: In applicable scenarios
Step 3 - Data Sources
Primary Research
- Web Analytics
- Survey Reports
- Research Institute
- Latest Research Reports
- Opinion Leaders
Secondary Research
- Annual Reports
- White Paper
- Latest Press Release
- Industry Association
- Paid Database
- Investor Presentations

Step 4 - Data Triangulation
Involves using different sources of information in order to increase the validity of a study
These sources are likely to be stakeholders in a program - participants, other researchers, program staff, other community members, and so on.
Then we put all data in single framework & apply various statistical tools to find out the dynamic on the market.
During the analysis stage, feedback from the stakeholder groups would be compared to determine areas of agreement as well as areas of divergence


