
Key Insights
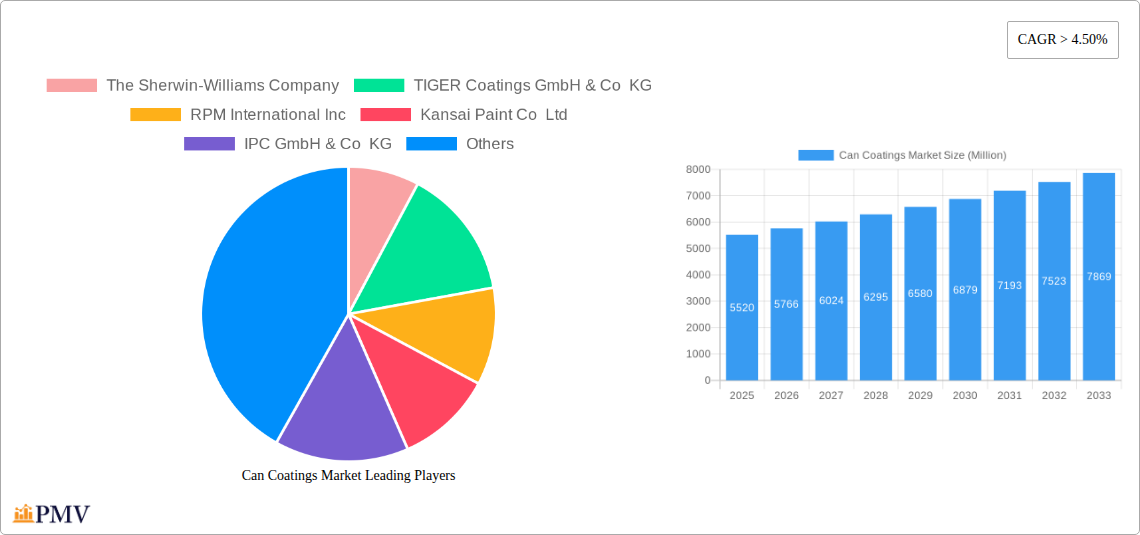
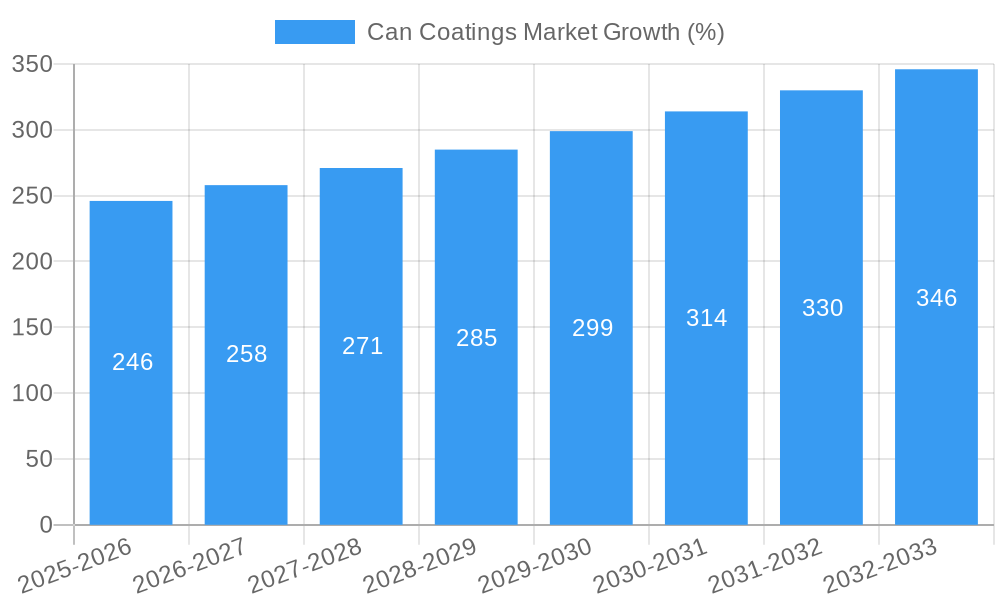
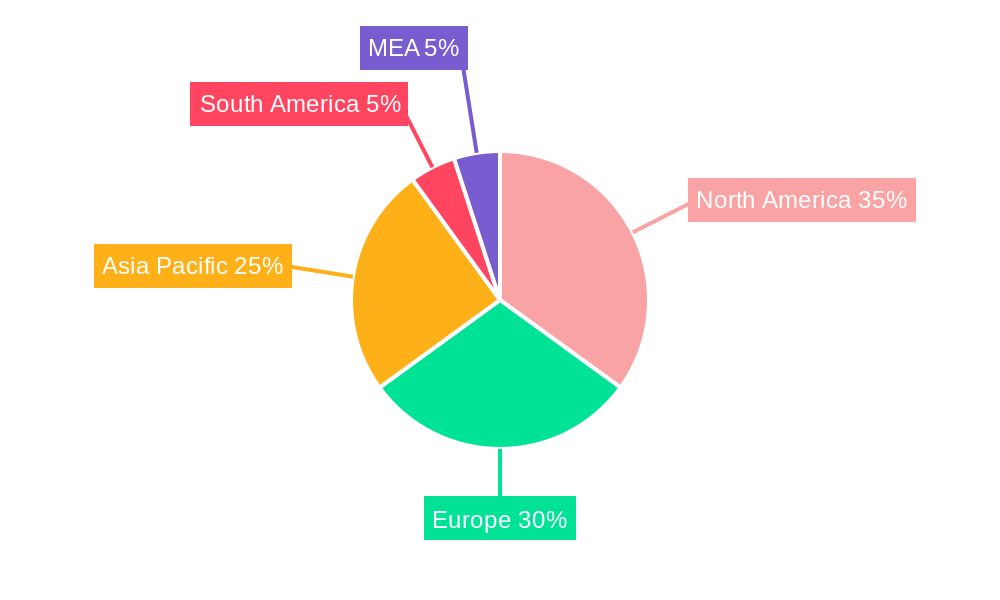
The global can coatings market, valued at $5.52 billion in 2025, is projected to experience robust growth, exceeding a compound annual growth rate (CAGR) of 4.50% from 2025 to 2033. This expansion is driven by several key factors. The burgeoning food and beverage industry, coupled with increasing demand for convenient packaging solutions, fuels the need for protective and aesthetically pleasing can coatings. Consumer preference for sustainable and eco-friendly packaging is also influencing market dynamics, pushing manufacturers towards developing water-based and low-VOC coatings. Furthermore, advancements in coating technology, such as improved corrosion resistance and enhanced printability, are contributing to market growth. The rising adoption of innovative coating types like acrylic and epoxy, offering superior performance characteristics, further supports this positive outlook. However, fluctuating raw material prices and stringent environmental regulations pose challenges to market expansion. Geographic segmentation reveals a significant presence across North America and Europe, with Asia Pacific emerging as a rapidly growing market due to increasing industrialization and rising disposable incomes. The competitive landscape is characterized by the presence of both established multinational corporations and regional players, each striving for market share through product innovation and strategic partnerships. The market is segmented by coating type (acrylic, epoxy, polyester, others) and application (beverage cans, food cans, aerosol cans, others). The increasing demand across different applications will greatly impact future market growth. Specific growth within regions will depend on the development and adoption of sustainable coatings.
The forecast period of 2025-2033 presents promising opportunities for market participants. Companies are focusing on developing specialized coatings to address specific industry requirements and consumer demands. This includes coatings that enhance shelf life, improve product safety, and contribute to reducing the environmental impact of packaging waste. The ongoing technological advancements and increased focus on sustainability will be central to shaping the market’s future trajectory, resulting in higher value products and growth. Strategic mergers and acquisitions, along with the development of new distribution channels, are anticipated to further intensify competition and drive innovation within the can coatings market.
Can Coatings Market: A Comprehensive Report (2019-2033)
This detailed report provides a comprehensive analysis of the Can Coatings Market, offering invaluable insights for industry stakeholders, investors, and researchers. Covering the period from 2019 to 2033, with a focus on 2025, this report meticulously examines market dynamics, competitive landscapes, and future growth prospects. The study period encompasses the historical period (2019-2024), the base year (2025), and the forecast period (2025-2033). The report segments the market by type (Acrylic, Epoxy, Polyester, Other Types) and application (Beverage Can, Food Can, Aerosol Can, Other Applications), providing granular market size estimations and growth projections in Millions.
Can Coatings Market Market Structure & Competitive Dynamics
The Can Coatings market exhibits a moderately concentrated structure, with a handful of multinational corporations commanding significant market share. Key players like The Sherwin-Williams Company, PPG Industries Inc, Akzo Nobel N.V., and Kansai Paint Co. Ltd. leverage their extensive distribution networks and established brand recognition to maintain dominance. However, smaller regional players also contribute significantly, particularly in niche applications. The market’s innovative ecosystem is characterized by continuous R&D efforts focused on developing sustainable, high-performance coatings. Stringent regulatory frameworks, particularly concerning environmental compliance and food safety, influence product formulation and manufacturing processes. The market experiences competitive pressures through the emergence of substitute materials and innovative technologies. M&A activities play a significant role in shaping the market landscape, with deal values ranging from xx Million to xx Million, primarily driven by strategies to expand product portfolios and geographic reach. The following metrics highlight the competitive dynamics:
- Market Concentration: High (Top 5 players hold approximately xx% market share).
- M&A Activity: Moderate (xx deals recorded in the last 5 years, with an average deal value of xx Million).
- Innovation Focus: Sustainable coatings, improved performance characteristics, and cost reduction.
- Regulatory Landscape: Stringent environmental regulations and food safety standards.
Can Coatings Market Industry Trends & Insights
The global Can Coatings market is projected to experience robust growth, with a CAGR of xx% during the forecast period (2025-2033). This growth is primarily driven by the burgeoning demand for canned food and beverages, fueled by increasing urbanization, changing consumer lifestyles, and the convenience offered by canned products. Technological advancements, particularly in coating formulation and application techniques, further contribute to market expansion. The growing preference for sustainable and eco-friendly coatings is pushing manufacturers towards developing bisphenol-A (BPA)-free and other environmentally benign products. Market penetration of these sustainable options is increasing, projected to reach xx% by 2033. The shift towards lightweight cans for improved resource efficiency is also shaping market trends. Intense competition among major players continues to fuel innovation and drive down prices, creating opportunities for consumers and end-users. Factors such as fluctuating raw material costs and geopolitical uncertainties can pose challenges to market growth.
Dominant Markets & Segments in Can Coatings Market
The North American region currently holds the largest market share in the Can Coatings sector, driven by strong demand from the food and beverage industry. Within the market segments, the beverage can application holds the largest share, with a projected value of xx Million by 2033, primarily due to the widespread consumption of carbonated soft drinks and alcoholic beverages.
- Key Drivers for North American Dominance:
- Large and established food and beverage industry.
- High per capita consumption of canned goods.
- Advanced manufacturing infrastructure.
- Favorable economic conditions.
The Acrylic segment dominates the type segment due to its excellent properties, cost-effectiveness, and versatile nature. Other types, including water-based coatings, are gaining traction due to rising sustainability concerns and regulatory pressures. These trends will likely shape market dynamics in the coming years.
Can Coatings Market Product Innovations
Recent innovations in can coatings have focused on developing sustainable, high-performance solutions that address growing environmental concerns and enhance product shelf life. The introduction of BPA-free coatings is a significant development, addressing health and environmental safety issues. Improved application techniques, such as enhanced spray coatings, are boosting efficiency and reducing waste. These innovations not only meet the needs of manufacturers but also attract environmentally conscious consumers, aligning with broader sustainability goals.
Report Segmentation & Scope
The Can Coatings Market is segmented by type and application:
By Type:
- Acrylic: This segment is characterized by its cost-effectiveness, versatility, and excellent performance characteristics, making it the largest segment. The market size is projected to reach xx Million by 2033, with a CAGR of xx%.
- Epoxy: Epoxy coatings are known for their durability and chemical resistance, making them suitable for specific applications. Market size is projected at xx Million by 2033, with a CAGR of xx%.
- Polyester: Polyester coatings offer good aesthetics and weatherability, finding application in specific can types. The market size is projected to reach xx Million by 2033, with a CAGR of xx%.
- Other Types: This category encompasses various other types of coatings and is expected to grow at a CAGR of xx% reaching xx Million by 2033.
By Application:
- Beverage Can: The largest application segment, driven by high consumption of canned beverages. Projected to reach xx Million by 2033, with a CAGR of xx%.
- Food Can: This segment is expected to experience consistent growth, driven by the convenience of canned food. Projected to reach xx Million by 2033, with a CAGR of xx%.
- Aerosol Can: This segment exhibits moderate growth, driven by various applications across industries. Projected to reach xx Million by 2033, with a CAGR of xx%.
- Other Applications: This category includes industrial and specialty applications, and is expected to grow at a CAGR of xx%, reaching xx Million by 2033.
Key Drivers of Can Coatings Market Growth
Several factors contribute to the market’s growth:
- Rising Demand for Canned Goods: The increasing global consumption of canned food and beverages is a primary driver.
- Technological Advancements: Innovations in coating formulations and application techniques enhance product performance and sustainability.
- Stringent Regulatory Frameworks: Regulations promoting environmentally friendly coatings are driving the adoption of sustainable options.
- Economic Growth: Economic growth in developing economies stimulates demand for canned products.
Challenges in the Can Coatings Market Sector
The Can Coatings market faces several challenges:
- Fluctuating Raw Material Prices: Price volatility of raw materials impacts production costs and profitability.
- Stringent Environmental Regulations: Compliance with evolving environmental standards requires continuous innovation and investment.
- Intense Competition: The market is characterized by intense competition, necessitating constant product innovation and cost optimization.
Leading Players in the Can Coatings Market Market
- The Sherwin-Williams Company
- TIGER Coatings GmbH & Co KG
- RPM International Inc
- Kansai Paint Co Ltd
- IPC GmbH & Co KG
- PPG Industries Inc
- TOYOCHEM CO LTD
- VPL Coatings GmbH & Co KG
- Axalta Coating Systems
- Akzo Nobel N V
- National Paints Factories Co Ltd
- Kupsa Coatings
Key Developments in Can Coatings Market Sector
- November 2023: AkzoNobel's EUR 32 million (~USD 34.99 million) investment in a new factory for bisphenol-free coatings signifies a significant shift towards sustainable practices within the metal packaging industry. This investment will likely enhance the company's market position and drive adoption of eco-friendly coatings.
- August 2022: PPG Industries' launch of PPG INNOVEL PRO, a BPA-free internal spray coating, showcases the industry's focus on sustainability and enhanced performance. This new product is likely to gain traction among manufacturers seeking eco-friendly and high-performing solutions.
- July 2022: PPG Industries' expansion of its Delaware facility, including increased production of over-varnish coatings, highlights the growing demand for high-quality coatings in the beverage can market. This expansion reflects confidence in the market's future growth and PPG's commitment to catering to this demand.
Strategic Can Coatings Market Market Outlook
The Can Coatings market presents significant growth potential driven by continued demand for canned products, especially in emerging economies. Strategic opportunities lie in developing sustainable, high-performance coatings that address environmental concerns and enhance product durability. Companies focused on innovation, particularly in BPA-free and other environmentally conscious coatings, are poised for significant market share gains. Expansion into new geographical markets and strategic alliances will further fuel growth in this dynamic sector.
Can Coatings Market Segmentation
-
1. Type
- 1.1. Acrylic
- 1.2. Epoxy
- 1.3. Polyester
- 1.4. Other Types
-
2. Application
- 2.1. Beverage Can
- 2.2. Food Can
- 2.3. Aerosol Can
- 2.4. Other Applications
Can Coatings Market Segmentation By Geography
-
1. Asia Pacific
- 1.1. China
- 1.2. India
- 1.3. Japan
- 1.4. South Korea
- 1.5. Indonesia
- 1.6. Malaysia
- 1.7. Thailand
- 1.8. Vietnam
- 1.9. Rest of Asia Pacific
-
2. North America
- 2.1. United States
- 2.2. Canada
- 2.3. Mexico
-
3. Europe
- 3.1. Germany
- 3.2. United Kingdom
- 3.3. France
- 3.4. Italy
- 3.5. Spain
- 3.6. Russia
- 3.7. Turkey
- 3.8. NORDIC Countries
- 3.9. Rest of Europe
-
4. South America
- 4.1. Brazil
- 4.2. Argentina
- 4.3. Colombia
- 4.4. Rest of South America
-
5. Middle East and Africa
- 5.1. Saudi Arabia
- 5.2. South Africa
- 5.3. Qatar
- 5.4. UAE
- 5.5. Egypt
- 5.6. Algeria
- 5.7. Rest of Middle East and Africa
Can Coatings Market REPORT HIGHLIGHTS
| Aspects | Details |
|---|---|
| Study Period | 2019-2033 |
| Base Year | 2024 |
| Estimated Year | 2025 |
| Forecast Period | 2025-2033 |
| Historical Period | 2019-2024 |
| Growth Rate | CAGR of > 4.50% from 2019-2033 |
| Segmentation |
|
Table of Contents
- 1. Introduction
- 1.1. Research Scope
- 1.2. Market Segmentation
- 1.3. Research Methodology
- 1.4. Definitions and Assumptions
- 2. Executive Summary
- 2.1. Introduction
- 3. Market Dynamics
- 3.1. Introduction
- 3.2. Market Drivers
- 3.2.1. Increasing Demand from Food and Beverage Packaging; Growing Utilization of Aerosol Cans for Personal Care Industry
- 3.3. Market Restrains
- 3.3.1. Stringent VOC Regulatory Policies; Other Restraints
- 3.4. Market Trends
- 3.4.1. Beverage Cans to Dominate the market
- 4. Market Factor Analysis
- 4.1. Porters Five Forces
- 4.2. Supply/Value Chain
- 4.3. PESTEL analysis
- 4.4. Market Entropy
- 4.5. Patent/Trademark Analysis
- 5. Global Can Coatings Market Analysis, Insights and Forecast, 2019-2031
- 5.1. Market Analysis, Insights and Forecast - by Type
- 5.1.1. Acrylic
- 5.1.2. Epoxy
- 5.1.3. Polyester
- 5.1.4. Other Types
- 5.2. Market Analysis, Insights and Forecast - by Application
- 5.2.1. Beverage Can
- 5.2.2. Food Can
- 5.2.3. Aerosol Can
- 5.2.4. Other Applications
- 5.3. Market Analysis, Insights and Forecast - by Region
- 5.3.1. Asia Pacific
- 5.3.2. North America
- 5.3.3. Europe
- 5.3.4. South America
- 5.3.5. Middle East and Africa
- 5.1. Market Analysis, Insights and Forecast - by Type
- 6. Asia Pacific Can Coatings Market Analysis, Insights and Forecast, 2019-2031
- 6.1. Market Analysis, Insights and Forecast - by Type
- 6.1.1. Acrylic
- 6.1.2. Epoxy
- 6.1.3. Polyester
- 6.1.4. Other Types
- 6.2. Market Analysis, Insights and Forecast - by Application
- 6.2.1. Beverage Can
- 6.2.2. Food Can
- 6.2.3. Aerosol Can
- 6.2.4. Other Applications
- 6.1. Market Analysis, Insights and Forecast - by Type
- 7. North America Can Coatings Market Analysis, Insights and Forecast, 2019-2031
- 7.1. Market Analysis, Insights and Forecast - by Type
- 7.1.1. Acrylic
- 7.1.2. Epoxy
- 7.1.3. Polyester
- 7.1.4. Other Types
- 7.2. Market Analysis, Insights and Forecast - by Application
- 7.2.1. Beverage Can
- 7.2.2. Food Can
- 7.2.3. Aerosol Can
- 7.2.4. Other Applications
- 7.1. Market Analysis, Insights and Forecast - by Type
- 8. Europe Can Coatings Market Analysis, Insights and Forecast, 2019-2031
- 8.1. Market Analysis, Insights and Forecast - by Type
- 8.1.1. Acrylic
- 8.1.2. Epoxy
- 8.1.3. Polyester
- 8.1.4. Other Types
- 8.2. Market Analysis, Insights and Forecast - by Application
- 8.2.1. Beverage Can
- 8.2.2. Food Can
- 8.2.3. Aerosol Can
- 8.2.4. Other Applications
- 8.1. Market Analysis, Insights and Forecast - by Type
- 9. South America Can Coatings Market Analysis, Insights and Forecast, 2019-2031
- 9.1. Market Analysis, Insights and Forecast - by Type
- 9.1.1. Acrylic
- 9.1.2. Epoxy
- 9.1.3. Polyester
- 9.1.4. Other Types
- 9.2. Market Analysis, Insights and Forecast - by Application
- 9.2.1. Beverage Can
- 9.2.2. Food Can
- 9.2.3. Aerosol Can
- 9.2.4. Other Applications
- 9.1. Market Analysis, Insights and Forecast - by Type
- 10. Middle East and Africa Can Coatings Market Analysis, Insights and Forecast, 2019-2031
- 10.1. Market Analysis, Insights and Forecast - by Type
- 10.1.1. Acrylic
- 10.1.2. Epoxy
- 10.1.3. Polyester
- 10.1.4. Other Types
- 10.2. Market Analysis, Insights and Forecast - by Application
- 10.2.1. Beverage Can
- 10.2.2. Food Can
- 10.2.3. Aerosol Can
- 10.2.4. Other Applications
- 10.1. Market Analysis, Insights and Forecast - by Type
- 11. North America Can Coatings Market Analysis, Insights and Forecast, 2019-2031
- 11.1. Market Analysis, Insights and Forecast - By Country/Sub-region
- 11.1.1 United States
- 11.1.2 Canada
- 11.1.3 Mexico
- 12. Europe Can Coatings Market Analysis, Insights and Forecast, 2019-2031
- 12.1. Market Analysis, Insights and Forecast - By Country/Sub-region
- 12.1.1 Germany
- 12.1.2 United Kingdom
- 12.1.3 France
- 12.1.4 Spain
- 12.1.5 Italy
- 12.1.6 Spain
- 12.1.7 Belgium
- 12.1.8 Netherland
- 12.1.9 Nordics
- 12.1.10 Rest of Europe
- 13. Asia Pacific Can Coatings Market Analysis, Insights and Forecast, 2019-2031
- 13.1. Market Analysis, Insights and Forecast - By Country/Sub-region
- 13.1.1 China
- 13.1.2 Japan
- 13.1.3 India
- 13.1.4 South Korea
- 13.1.5 Southeast Asia
- 13.1.6 Australia
- 13.1.7 Indonesia
- 13.1.8 Phillipes
- 13.1.9 Singapore
- 13.1.10 Thailandc
- 13.1.11 Rest of Asia Pacific
- 14. South America Can Coatings Market Analysis, Insights and Forecast, 2019-2031
- 14.1. Market Analysis, Insights and Forecast - By Country/Sub-region
- 14.1.1 Brazil
- 14.1.2 Argentina
- 14.1.3 Peru
- 14.1.4 Chile
- 14.1.5 Colombia
- 14.1.6 Ecuador
- 14.1.7 Venezuela
- 14.1.8 Rest of South America
- 15. MEA Can Coatings Market Analysis, Insights and Forecast, 2019-2031
- 15.1. Market Analysis, Insights and Forecast - By Country/Sub-region
- 15.1.1 United Arab Emirates
- 15.1.2 Saudi Arabia
- 15.1.3 South Africa
- 15.1.4 Rest of Middle East and Africa
- 16. Competitive Analysis
- 16.1. Global Market Share Analysis 2024
- 16.2. Company Profiles
- 16.2.1 The Sherwin-Williams Company
- 16.2.1.1. Overview
- 16.2.1.2. Products
- 16.2.1.3. SWOT Analysis
- 16.2.1.4. Recent Developments
- 16.2.1.5. Financials (Based on Availability)
- 16.2.2 TIGER Coatings GmbH & Co KG
- 16.2.2.1. Overview
- 16.2.2.2. Products
- 16.2.2.3. SWOT Analysis
- 16.2.2.4. Recent Developments
- 16.2.2.5. Financials (Based on Availability)
- 16.2.3 RPM International Inc
- 16.2.3.1. Overview
- 16.2.3.2. Products
- 16.2.3.3. SWOT Analysis
- 16.2.3.4. Recent Developments
- 16.2.3.5. Financials (Based on Availability)
- 16.2.4 Kansai Paint Co Ltd
- 16.2.4.1. Overview
- 16.2.4.2. Products
- 16.2.4.3. SWOT Analysis
- 16.2.4.4. Recent Developments
- 16.2.4.5. Financials (Based on Availability)
- 16.2.5 IPC GmbH & Co KG
- 16.2.5.1. Overview
- 16.2.5.2. Products
- 16.2.5.3. SWOT Analysis
- 16.2.5.4. Recent Developments
- 16.2.5.5. Financials (Based on Availability)
- 16.2.6 PPG Industries Inc
- 16.2.6.1. Overview
- 16.2.6.2. Products
- 16.2.6.3. SWOT Analysis
- 16.2.6.4. Recent Developments
- 16.2.6.5. Financials (Based on Availability)
- 16.2.7 TOYOCHEM CO LTD
- 16.2.7.1. Overview
- 16.2.7.2. Products
- 16.2.7.3. SWOT Analysis
- 16.2.7.4. Recent Developments
- 16.2.7.5. Financials (Based on Availability)
- 16.2.8 VPL Coatings GmbH & Co KG*List Not Exhaustive
- 16.2.8.1. Overview
- 16.2.8.2. Products
- 16.2.8.3. SWOT Analysis
- 16.2.8.4. Recent Developments
- 16.2.8.5. Financials (Based on Availability)
- 16.2.9 Axalta Coating Systems
- 16.2.9.1. Overview
- 16.2.9.2. Products
- 16.2.9.3. SWOT Analysis
- 16.2.9.4. Recent Developments
- 16.2.9.5. Financials (Based on Availability)
- 16.2.10 Akzo Nobel N V
- 16.2.10.1. Overview
- 16.2.10.2. Products
- 16.2.10.3. SWOT Analysis
- 16.2.10.4. Recent Developments
- 16.2.10.5. Financials (Based on Availability)
- 16.2.11 National Paints Factories Co Ltd
- 16.2.11.1. Overview
- 16.2.11.2. Products
- 16.2.11.3. SWOT Analysis
- 16.2.11.4. Recent Developments
- 16.2.11.5. Financials (Based on Availability)
- 16.2.12 Kupsa Coatings
- 16.2.12.1. Overview
- 16.2.12.2. Products
- 16.2.12.3. SWOT Analysis
- 16.2.12.4. Recent Developments
- 16.2.12.5. Financials (Based on Availability)
- 16.2.1 The Sherwin-Williams Company
List of Figures
- Figure 1: Global Can Coatings Market Revenue Breakdown (Million, %) by Region 2024 & 2032
- Figure 2: Global Can Coatings Market Volume Breakdown (liter per unit, %) by Region 2024 & 2032
- Figure 3: North America Can Coatings Market Revenue (Million), by Country 2024 & 2032
- Figure 4: North America Can Coatings Market Volume (liter per unit), by Country 2024 & 2032
- Figure 5: North America Can Coatings Market Revenue Share (%), by Country 2024 & 2032
- Figure 6: North America Can Coatings Market Volume Share (%), by Country 2024 & 2032
- Figure 7: Europe Can Coatings Market Revenue (Million), by Country 2024 & 2032
- Figure 8: Europe Can Coatings Market Volume (liter per unit), by Country 2024 & 2032
- Figure 9: Europe Can Coatings Market Revenue Share (%), by Country 2024 & 2032
- Figure 10: Europe Can Coatings Market Volume Share (%), by Country 2024 & 2032
- Figure 11: Asia Pacific Can Coatings Market Revenue (Million), by Country 2024 & 2032
- Figure 12: Asia Pacific Can Coatings Market Volume (liter per unit), by Country 2024 & 2032
- Figure 13: Asia Pacific Can Coatings Market Revenue Share (%), by Country 2024 & 2032
- Figure 14: Asia Pacific Can Coatings Market Volume Share (%), by Country 2024 & 2032
- Figure 15: South America Can Coatings Market Revenue (Million), by Country 2024 & 2032
- Figure 16: South America Can Coatings Market Volume (liter per unit), by Country 2024 & 2032
- Figure 17: South America Can Coatings Market Revenue Share (%), by Country 2024 & 2032
- Figure 18: South America Can Coatings Market Volume Share (%), by Country 2024 & 2032
- Figure 19: MEA Can Coatings Market Revenue (Million), by Country 2024 & 2032
- Figure 20: MEA Can Coatings Market Volume (liter per unit), by Country 2024 & 2032
- Figure 21: MEA Can Coatings Market Revenue Share (%), by Country 2024 & 2032
- Figure 22: MEA Can Coatings Market Volume Share (%), by Country 2024 & 2032
- Figure 23: Asia Pacific Can Coatings Market Revenue (Million), by Type 2024 & 2032
- Figure 24: Asia Pacific Can Coatings Market Volume (liter per unit), by Type 2024 & 2032
- Figure 25: Asia Pacific Can Coatings Market Revenue Share (%), by Type 2024 & 2032
- Figure 26: Asia Pacific Can Coatings Market Volume Share (%), by Type 2024 & 2032
- Figure 27: Asia Pacific Can Coatings Market Revenue (Million), by Application 2024 & 2032
- Figure 28: Asia Pacific Can Coatings Market Volume (liter per unit), by Application 2024 & 2032
- Figure 29: Asia Pacific Can Coatings Market Revenue Share (%), by Application 2024 & 2032
- Figure 30: Asia Pacific Can Coatings Market Volume Share (%), by Application 2024 & 2032
- Figure 31: Asia Pacific Can Coatings Market Revenue (Million), by Country 2024 & 2032
- Figure 32: Asia Pacific Can Coatings Market Volume (liter per unit), by Country 2024 & 2032
- Figure 33: Asia Pacific Can Coatings Market Revenue Share (%), by Country 2024 & 2032
- Figure 34: Asia Pacific Can Coatings Market Volume Share (%), by Country 2024 & 2032
- Figure 35: North America Can Coatings Market Revenue (Million), by Type 2024 & 2032
- Figure 36: North America Can Coatings Market Volume (liter per unit), by Type 2024 & 2032
- Figure 37: North America Can Coatings Market Revenue Share (%), by Type 2024 & 2032
- Figure 38: North America Can Coatings Market Volume Share (%), by Type 2024 & 2032
- Figure 39: North America Can Coatings Market Revenue (Million), by Application 2024 & 2032
- Figure 40: North America Can Coatings Market Volume (liter per unit), by Application 2024 & 2032
- Figure 41: North America Can Coatings Market Revenue Share (%), by Application 2024 & 2032
- Figure 42: North America Can Coatings Market Volume Share (%), by Application 2024 & 2032
- Figure 43: North America Can Coatings Market Revenue (Million), by Country 2024 & 2032
- Figure 44: North America Can Coatings Market Volume (liter per unit), by Country 2024 & 2032
- Figure 45: North America Can Coatings Market Revenue Share (%), by Country 2024 & 2032
- Figure 46: North America Can Coatings Market Volume Share (%), by Country 2024 & 2032
- Figure 47: Europe Can Coatings Market Revenue (Million), by Type 2024 & 2032
- Figure 48: Europe Can Coatings Market Volume (liter per unit), by Type 2024 & 2032
- Figure 49: Europe Can Coatings Market Revenue Share (%), by Type 2024 & 2032
- Figure 50: Europe Can Coatings Market Volume Share (%), by Type 2024 & 2032
- Figure 51: Europe Can Coatings Market Revenue (Million), by Application 2024 & 2032
- Figure 52: Europe Can Coatings Market Volume (liter per unit), by Application 2024 & 2032
- Figure 53: Europe Can Coatings Market Revenue Share (%), by Application 2024 & 2032
- Figure 54: Europe Can Coatings Market Volume Share (%), by Application 2024 & 2032
- Figure 55: Europe Can Coatings Market Revenue (Million), by Country 2024 & 2032
- Figure 56: Europe Can Coatings Market Volume (liter per unit), by Country 2024 & 2032
- Figure 57: Europe Can Coatings Market Revenue Share (%), by Country 2024 & 2032
- Figure 58: Europe Can Coatings Market Volume Share (%), by Country 2024 & 2032
- Figure 59: South America Can Coatings Market Revenue (Million), by Type 2024 & 2032
- Figure 60: South America Can Coatings Market Volume (liter per unit), by Type 2024 & 2032
- Figure 61: South America Can Coatings Market Revenue Share (%), by Type 2024 & 2032
- Figure 62: South America Can Coatings Market Volume Share (%), by Type 2024 & 2032
- Figure 63: South America Can Coatings Market Revenue (Million), by Application 2024 & 2032
- Figure 64: South America Can Coatings Market Volume (liter per unit), by Application 2024 & 2032
- Figure 65: South America Can Coatings Market Revenue Share (%), by Application 2024 & 2032
- Figure 66: South America Can Coatings Market Volume Share (%), by Application 2024 & 2032
- Figure 67: South America Can Coatings Market Revenue (Million), by Country 2024 & 2032
- Figure 68: South America Can Coatings Market Volume (liter per unit), by Country 2024 & 2032
- Figure 69: South America Can Coatings Market Revenue Share (%), by Country 2024 & 2032
- Figure 70: South America Can Coatings Market Volume Share (%), by Country 2024 & 2032
- Figure 71: Middle East and Africa Can Coatings Market Revenue (Million), by Type 2024 & 2032
- Figure 72: Middle East and Africa Can Coatings Market Volume (liter per unit), by Type 2024 & 2032
- Figure 73: Middle East and Africa Can Coatings Market Revenue Share (%), by Type 2024 & 2032
- Figure 74: Middle East and Africa Can Coatings Market Volume Share (%), by Type 2024 & 2032
- Figure 75: Middle East and Africa Can Coatings Market Revenue (Million), by Application 2024 & 2032
- Figure 76: Middle East and Africa Can Coatings Market Volume (liter per unit), by Application 2024 & 2032
- Figure 77: Middle East and Africa Can Coatings Market Revenue Share (%), by Application 2024 & 2032
- Figure 78: Middle East and Africa Can Coatings Market Volume Share (%), by Application 2024 & 2032
- Figure 79: Middle East and Africa Can Coatings Market Revenue (Million), by Country 2024 & 2032
- Figure 80: Middle East and Africa Can Coatings Market Volume (liter per unit), by Country 2024 & 2032
- Figure 81: Middle East and Africa Can Coatings Market Revenue Share (%), by Country 2024 & 2032
- Figure 82: Middle East and Africa Can Coatings Market Volume Share (%), by Country 2024 & 2032
List of Tables
- Table 1: Global Can Coatings Market Revenue Million Forecast, by Region 2019 & 2032
- Table 2: Global Can Coatings Market Volume liter per unit Forecast, by Region 2019 & 2032
- Table 3: Global Can Coatings Market Revenue Million Forecast, by Type 2019 & 2032
- Table 4: Global Can Coatings Market Volume liter per unit Forecast, by Type 2019 & 2032
- Table 5: Global Can Coatings Market Revenue Million Forecast, by Application 2019 & 2032
- Table 6: Global Can Coatings Market Volume liter per unit Forecast, by Application 2019 & 2032
- Table 7: Global Can Coatings Market Revenue Million Forecast, by Region 2019 & 2032
- Table 8: Global Can Coatings Market Volume liter per unit Forecast, by Region 2019 & 2032
- Table 9: Global Can Coatings Market Revenue Million Forecast, by Country 2019 & 2032
- Table 10: Global Can Coatings Market Volume liter per unit Forecast, by Country 2019 & 2032
- Table 11: United States Can Coatings Market Revenue (Million) Forecast, by Application 2019 & 2032
- Table 12: United States Can Coatings Market Volume (liter per unit) Forecast, by Application 2019 & 2032
- Table 13: Canada Can Coatings Market Revenue (Million) Forecast, by Application 2019 & 2032
- Table 14: Canada Can Coatings Market Volume (liter per unit) Forecast, by Application 2019 & 2032
- Table 15: Mexico Can Coatings Market Revenue (Million) Forecast, by Application 2019 & 2032
- Table 16: Mexico Can Coatings Market Volume (liter per unit) Forecast, by Application 2019 & 2032
- Table 17: Global Can Coatings Market Revenue Million Forecast, by Country 2019 & 2032
- Table 18: Global Can Coatings Market Volume liter per unit Forecast, by Country 2019 & 2032
- Table 19: Germany Can Coatings Market Revenue (Million) Forecast, by Application 2019 & 2032
- Table 20: Germany Can Coatings Market Volume (liter per unit) Forecast, by Application 2019 & 2032
- Table 21: United Kingdom Can Coatings Market Revenue (Million) Forecast, by Application 2019 & 2032
- Table 22: United Kingdom Can Coatings Market Volume (liter per unit) Forecast, by Application 2019 & 2032
- Table 23: France Can Coatings Market Revenue (Million) Forecast, by Application 2019 & 2032
- Table 24: France Can Coatings Market Volume (liter per unit) Forecast, by Application 2019 & 2032
- Table 25: Spain Can Coatings Market Revenue (Million) Forecast, by Application 2019 & 2032
- Table 26: Spain Can Coatings Market Volume (liter per unit) Forecast, by Application 2019 & 2032
- Table 27: Italy Can Coatings Market Revenue (Million) Forecast, by Application 2019 & 2032
- Table 28: Italy Can Coatings Market Volume (liter per unit) Forecast, by Application 2019 & 2032
- Table 29: Spain Can Coatings Market Revenue (Million) Forecast, by Application 2019 & 2032
- Table 30: Spain Can Coatings Market Volume (liter per unit) Forecast, by Application 2019 & 2032
- Table 31: Belgium Can Coatings Market Revenue (Million) Forecast, by Application 2019 & 2032
- Table 32: Belgium Can Coatings Market Volume (liter per unit) Forecast, by Application 2019 & 2032
- Table 33: Netherland Can Coatings Market Revenue (Million) Forecast, by Application 2019 & 2032
- Table 34: Netherland Can Coatings Market Volume (liter per unit) Forecast, by Application 2019 & 2032
- Table 35: Nordics Can Coatings Market Revenue (Million) Forecast, by Application 2019 & 2032
- Table 36: Nordics Can Coatings Market Volume (liter per unit) Forecast, by Application 2019 & 2032
- Table 37: Rest of Europe Can Coatings Market Revenue (Million) Forecast, by Application 2019 & 2032
- Table 38: Rest of Europe Can Coatings Market Volume (liter per unit) Forecast, by Application 2019 & 2032
- Table 39: Global Can Coatings Market Revenue Million Forecast, by Country 2019 & 2032
- Table 40: Global Can Coatings Market Volume liter per unit Forecast, by Country 2019 & 2032
- Table 41: China Can Coatings Market Revenue (Million) Forecast, by Application 2019 & 2032
- Table 42: China Can Coatings Market Volume (liter per unit) Forecast, by Application 2019 & 2032
- Table 43: Japan Can Coatings Market Revenue (Million) Forecast, by Application 2019 & 2032
- Table 44: Japan Can Coatings Market Volume (liter per unit) Forecast, by Application 2019 & 2032
- Table 45: India Can Coatings Market Revenue (Million) Forecast, by Application 2019 & 2032
- Table 46: India Can Coatings Market Volume (liter per unit) Forecast, by Application 2019 & 2032
- Table 47: South Korea Can Coatings Market Revenue (Million) Forecast, by Application 2019 & 2032
- Table 48: South Korea Can Coatings Market Volume (liter per unit) Forecast, by Application 2019 & 2032
- Table 49: Southeast Asia Can Coatings Market Revenue (Million) Forecast, by Application 2019 & 2032
- Table 50: Southeast Asia Can Coatings Market Volume (liter per unit) Forecast, by Application 2019 & 2032
- Table 51: Australia Can Coatings Market Revenue (Million) Forecast, by Application 2019 & 2032
- Table 52: Australia Can Coatings Market Volume (liter per unit) Forecast, by Application 2019 & 2032
- Table 53: Indonesia Can Coatings Market Revenue (Million) Forecast, by Application 2019 & 2032
- Table 54: Indonesia Can Coatings Market Volume (liter per unit) Forecast, by Application 2019 & 2032
- Table 55: Phillipes Can Coatings Market Revenue (Million) Forecast, by Application 2019 & 2032
- Table 56: Phillipes Can Coatings Market Volume (liter per unit) Forecast, by Application 2019 & 2032
- Table 57: Singapore Can Coatings Market Revenue (Million) Forecast, by Application 2019 & 2032
- Table 58: Singapore Can Coatings Market Volume (liter per unit) Forecast, by Application 2019 & 2032
- Table 59: Thailandc Can Coatings Market Revenue (Million) Forecast, by Application 2019 & 2032
- Table 60: Thailandc Can Coatings Market Volume (liter per unit) Forecast, by Application 2019 & 2032
- Table 61: Rest of Asia Pacific Can Coatings Market Revenue (Million) Forecast, by Application 2019 & 2032
- Table 62: Rest of Asia Pacific Can Coatings Market Volume (liter per unit) Forecast, by Application 2019 & 2032
- Table 63: Global Can Coatings Market Revenue Million Forecast, by Country 2019 & 2032
- Table 64: Global Can Coatings Market Volume liter per unit Forecast, by Country 2019 & 2032
- Table 65: Brazil Can Coatings Market Revenue (Million) Forecast, by Application 2019 & 2032
- Table 66: Brazil Can Coatings Market Volume (liter per unit) Forecast, by Application 2019 & 2032
- Table 67: Argentina Can Coatings Market Revenue (Million) Forecast, by Application 2019 & 2032
- Table 68: Argentina Can Coatings Market Volume (liter per unit) Forecast, by Application 2019 & 2032
- Table 69: Peru Can Coatings Market Revenue (Million) Forecast, by Application 2019 & 2032
- Table 70: Peru Can Coatings Market Volume (liter per unit) Forecast, by Application 2019 & 2032
- Table 71: Chile Can Coatings Market Revenue (Million) Forecast, by Application 2019 & 2032
- Table 72: Chile Can Coatings Market Volume (liter per unit) Forecast, by Application 2019 & 2032
- Table 73: Colombia Can Coatings Market Revenue (Million) Forecast, by Application 2019 & 2032
- Table 74: Colombia Can Coatings Market Volume (liter per unit) Forecast, by Application 2019 & 2032
- Table 75: Ecuador Can Coatings Market Revenue (Million) Forecast, by Application 2019 & 2032
- Table 76: Ecuador Can Coatings Market Volume (liter per unit) Forecast, by Application 2019 & 2032
- Table 77: Venezuela Can Coatings Market Revenue (Million) Forecast, by Application 2019 & 2032
- Table 78: Venezuela Can Coatings Market Volume (liter per unit) Forecast, by Application 2019 & 2032
- Table 79: Rest of South America Can Coatings Market Revenue (Million) Forecast, by Application 2019 & 2032
- Table 80: Rest of South America Can Coatings Market Volume (liter per unit) Forecast, by Application 2019 & 2032
- Table 81: Global Can Coatings Market Revenue Million Forecast, by Country 2019 & 2032
- Table 82: Global Can Coatings Market Volume liter per unit Forecast, by Country 2019 & 2032
- Table 83: United Arab Emirates Can Coatings Market Revenue (Million) Forecast, by Application 2019 & 2032
- Table 84: United Arab Emirates Can Coatings Market Volume (liter per unit) Forecast, by Application 2019 & 2032
- Table 85: Saudi Arabia Can Coatings Market Revenue (Million) Forecast, by Application 2019 & 2032
- Table 86: Saudi Arabia Can Coatings Market Volume (liter per unit) Forecast, by Application 2019 & 2032
- Table 87: South Africa Can Coatings Market Revenue (Million) Forecast, by Application 2019 & 2032
- Table 88: South Africa Can Coatings Market Volume (liter per unit) Forecast, by Application 2019 & 2032
- Table 89: Rest of Middle East and Africa Can Coatings Market Revenue (Million) Forecast, by Application 2019 & 2032
- Table 90: Rest of Middle East and Africa Can Coatings Market Volume (liter per unit) Forecast, by Application 2019 & 2032
- Table 91: Global Can Coatings Market Revenue Million Forecast, by Type 2019 & 2032
- Table 92: Global Can Coatings Market Volume liter per unit Forecast, by Type 2019 & 2032
- Table 93: Global Can Coatings Market Revenue Million Forecast, by Application 2019 & 2032
- Table 94: Global Can Coatings Market Volume liter per unit Forecast, by Application 2019 & 2032
- Table 95: Global Can Coatings Market Revenue Million Forecast, by Country 2019 & 2032
- Table 96: Global Can Coatings Market Volume liter per unit Forecast, by Country 2019 & 2032
- Table 97: China Can Coatings Market Revenue (Million) Forecast, by Application 2019 & 2032
- Table 98: China Can Coatings Market Volume (liter per unit) Forecast, by Application 2019 & 2032
- Table 99: India Can Coatings Market Revenue (Million) Forecast, by Application 2019 & 2032
- Table 100: India Can Coatings Market Volume (liter per unit) Forecast, by Application 2019 & 2032
- Table 101: Japan Can Coatings Market Revenue (Million) Forecast, by Application 2019 & 2032
- Table 102: Japan Can Coatings Market Volume (liter per unit) Forecast, by Application 2019 & 2032
- Table 103: South Korea Can Coatings Market Revenue (Million) Forecast, by Application 2019 & 2032
- Table 104: South Korea Can Coatings Market Volume (liter per unit) Forecast, by Application 2019 & 2032
- Table 105: Indonesia Can Coatings Market Revenue (Million) Forecast, by Application 2019 & 2032
- Table 106: Indonesia Can Coatings Market Volume (liter per unit) Forecast, by Application 2019 & 2032
- Table 107: Malaysia Can Coatings Market Revenue (Million) Forecast, by Application 2019 & 2032
- Table 108: Malaysia Can Coatings Market Volume (liter per unit) Forecast, by Application 2019 & 2032
- Table 109: Thailand Can Coatings Market Revenue (Million) Forecast, by Application 2019 & 2032
- Table 110: Thailand Can Coatings Market Volume (liter per unit) Forecast, by Application 2019 & 2032
- Table 111: Vietnam Can Coatings Market Revenue (Million) Forecast, by Application 2019 & 2032
- Table 112: Vietnam Can Coatings Market Volume (liter per unit) Forecast, by Application 2019 & 2032
- Table 113: Rest of Asia Pacific Can Coatings Market Revenue (Million) Forecast, by Application 2019 & 2032
- Table 114: Rest of Asia Pacific Can Coatings Market Volume (liter per unit) Forecast, by Application 2019 & 2032
- Table 115: Global Can Coatings Market Revenue Million Forecast, by Type 2019 & 2032
- Table 116: Global Can Coatings Market Volume liter per unit Forecast, by Type 2019 & 2032
- Table 117: Global Can Coatings Market Revenue Million Forecast, by Application 2019 & 2032
- Table 118: Global Can Coatings Market Volume liter per unit Forecast, by Application 2019 & 2032
- Table 119: Global Can Coatings Market Revenue Million Forecast, by Country 2019 & 2032
- Table 120: Global Can Coatings Market Volume liter per unit Forecast, by Country 2019 & 2032
- Table 121: United States Can Coatings Market Revenue (Million) Forecast, by Application 2019 & 2032
- Table 122: United States Can Coatings Market Volume (liter per unit) Forecast, by Application 2019 & 2032
- Table 123: Canada Can Coatings Market Revenue (Million) Forecast, by Application 2019 & 2032
- Table 124: Canada Can Coatings Market Volume (liter per unit) Forecast, by Application 2019 & 2032
- Table 125: Mexico Can Coatings Market Revenue (Million) Forecast, by Application 2019 & 2032
- Table 126: Mexico Can Coatings Market Volume (liter per unit) Forecast, by Application 2019 & 2032
- Table 127: Global Can Coatings Market Revenue Million Forecast, by Type 2019 & 2032
- Table 128: Global Can Coatings Market Volume liter per unit Forecast, by Type 2019 & 2032
- Table 129: Global Can Coatings Market Revenue Million Forecast, by Application 2019 & 2032
- Table 130: Global Can Coatings Market Volume liter per unit Forecast, by Application 2019 & 2032
- Table 131: Global Can Coatings Market Revenue Million Forecast, by Country 2019 & 2032
- Table 132: Global Can Coatings Market Volume liter per unit Forecast, by Country 2019 & 2032
- Table 133: Germany Can Coatings Market Revenue (Million) Forecast, by Application 2019 & 2032
- Table 134: Germany Can Coatings Market Volume (liter per unit) Forecast, by Application 2019 & 2032
- Table 135: United Kingdom Can Coatings Market Revenue (Million) Forecast, by Application 2019 & 2032
- Table 136: United Kingdom Can Coatings Market Volume (liter per unit) Forecast, by Application 2019 & 2032
- Table 137: France Can Coatings Market Revenue (Million) Forecast, by Application 2019 & 2032
- Table 138: France Can Coatings Market Volume (liter per unit) Forecast, by Application 2019 & 2032
- Table 139: Italy Can Coatings Market Revenue (Million) Forecast, by Application 2019 & 2032
- Table 140: Italy Can Coatings Market Volume (liter per unit) Forecast, by Application 2019 & 2032
- Table 141: Spain Can Coatings Market Revenue (Million) Forecast, by Application 2019 & 2032
- Table 142: Spain Can Coatings Market Volume (liter per unit) Forecast, by Application 2019 & 2032
- Table 143: Russia Can Coatings Market Revenue (Million) Forecast, by Application 2019 & 2032
- Table 144: Russia Can Coatings Market Volume (liter per unit) Forecast, by Application 2019 & 2032
- Table 145: Turkey Can Coatings Market Revenue (Million) Forecast, by Application 2019 & 2032
- Table 146: Turkey Can Coatings Market Volume (liter per unit) Forecast, by Application 2019 & 2032
- Table 147: NORDIC Countries Can Coatings Market Revenue (Million) Forecast, by Application 2019 & 2032
- Table 148: NORDIC Countries Can Coatings Market Volume (liter per unit) Forecast, by Application 2019 & 2032
- Table 149: Rest of Europe Can Coatings Market Revenue (Million) Forecast, by Application 2019 & 2032
- Table 150: Rest of Europe Can Coatings Market Volume (liter per unit) Forecast, by Application 2019 & 2032
- Table 151: Global Can Coatings Market Revenue Million Forecast, by Type 2019 & 2032
- Table 152: Global Can Coatings Market Volume liter per unit Forecast, by Type 2019 & 2032
- Table 153: Global Can Coatings Market Revenue Million Forecast, by Application 2019 & 2032
- Table 154: Global Can Coatings Market Volume liter per unit Forecast, by Application 2019 & 2032
- Table 155: Global Can Coatings Market Revenue Million Forecast, by Country 2019 & 2032
- Table 156: Global Can Coatings Market Volume liter per unit Forecast, by Country 2019 & 2032
- Table 157: Brazil Can Coatings Market Revenue (Million) Forecast, by Application 2019 & 2032
- Table 158: Brazil Can Coatings Market Volume (liter per unit) Forecast, by Application 2019 & 2032
- Table 159: Argentina Can Coatings Market Revenue (Million) Forecast, by Application 2019 & 2032
- Table 160: Argentina Can Coatings Market Volume (liter per unit) Forecast, by Application 2019 & 2032
- Table 161: Colombia Can Coatings Market Revenue (Million) Forecast, by Application 2019 & 2032
- Table 162: Colombia Can Coatings Market Volume (liter per unit) Forecast, by Application 2019 & 2032
- Table 163: Rest of South America Can Coatings Market Revenue (Million) Forecast, by Application 2019 & 2032
- Table 164: Rest of South America Can Coatings Market Volume (liter per unit) Forecast, by Application 2019 & 2032
- Table 165: Global Can Coatings Market Revenue Million Forecast, by Type 2019 & 2032
- Table 166: Global Can Coatings Market Volume liter per unit Forecast, by Type 2019 & 2032
- Table 167: Global Can Coatings Market Revenue Million Forecast, by Application 2019 & 2032
- Table 168: Global Can Coatings Market Volume liter per unit Forecast, by Application 2019 & 2032
- Table 169: Global Can Coatings Market Revenue Million Forecast, by Country 2019 & 2032
- Table 170: Global Can Coatings Market Volume liter per unit Forecast, by Country 2019 & 2032
- Table 171: Saudi Arabia Can Coatings Market Revenue (Million) Forecast, by Application 2019 & 2032
- Table 172: Saudi Arabia Can Coatings Market Volume (liter per unit) Forecast, by Application 2019 & 2032
- Table 173: South Africa Can Coatings Market Revenue (Million) Forecast, by Application 2019 & 2032
- Table 174: South Africa Can Coatings Market Volume (liter per unit) Forecast, by Application 2019 & 2032
- Table 175: Qatar Can Coatings Market Revenue (Million) Forecast, by Application 2019 & 2032
- Table 176: Qatar Can Coatings Market Volume (liter per unit) Forecast, by Application 2019 & 2032
- Table 177: UAE Can Coatings Market Revenue (Million) Forecast, by Application 2019 & 2032
- Table 178: UAE Can Coatings Market Volume (liter per unit) Forecast, by Application 2019 & 2032
- Table 179: Egypt Can Coatings Market Revenue (Million) Forecast, by Application 2019 & 2032
- Table 180: Egypt Can Coatings Market Volume (liter per unit) Forecast, by Application 2019 & 2032
- Table 181: Algeria Can Coatings Market Revenue (Million) Forecast, by Application 2019 & 2032
- Table 182: Algeria Can Coatings Market Volume (liter per unit) Forecast, by Application 2019 & 2032
- Table 183: Rest of Middle East and Africa Can Coatings Market Revenue (Million) Forecast, by Application 2019 & 2032
- Table 184: Rest of Middle East and Africa Can Coatings Market Volume (liter per unit) Forecast, by Application 2019 & 2032
Frequently Asked Questions
1. What is the projected Compound Annual Growth Rate (CAGR) of the Can Coatings Market?
The projected CAGR is approximately > 4.50%.
2. Which companies are prominent players in the Can Coatings Market?
Key companies in the market include The Sherwin-Williams Company, TIGER Coatings GmbH & Co KG, RPM International Inc, Kansai Paint Co Ltd, IPC GmbH & Co KG, PPG Industries Inc, TOYOCHEM CO LTD, VPL Coatings GmbH & Co KG*List Not Exhaustive, Axalta Coating Systems, Akzo Nobel N V, National Paints Factories Co Ltd, Kupsa Coatings.
3. What are the main segments of the Can Coatings Market?
The market segments include Type, Application.
4. Can you provide details about the market size?
The market size is estimated to be USD 5.52 Million as of 2022.
5. What are some drivers contributing to market growth?
Increasing Demand from Food and Beverage Packaging; Growing Utilization of Aerosol Cans for Personal Care Industry.
6. What are the notable trends driving market growth?
Beverage Cans to Dominate the market.
7. Are there any restraints impacting market growth?
Stringent VOC Regulatory Policies; Other Restraints.
8. Can you provide examples of recent developments in the market?
November 2023: AkzoNobel will invest EUR 32 million (~USD 34.99 million) in a new factory at its Vilafranca site to manufacture bisphenol-free coatings for the metal packaging industry in EMEA (Europe, Middle East, and Africa). The facility will use advanced automation and has been designed to meet high eco-efficiency requirements, allowing the company to achieve significant improvements in energy and material economy. It is projected to be operational by the middle of 2025.
9. What pricing options are available for accessing the report?
Pricing options include single-user, multi-user, and enterprise licenses priced at USD 4750, USD 5250, and USD 8750 respectively.
10. Is the market size provided in terms of value or volume?
The market size is provided in terms of value, measured in Million and volume, measured in liter per unit.
11. Are there any specific market keywords associated with the report?
Yes, the market keyword associated with the report is "Can Coatings Market," which aids in identifying and referencing the specific market segment covered.
12. How do I determine which pricing option suits my needs best?
The pricing options vary based on user requirements and access needs. Individual users may opt for single-user licenses, while businesses requiring broader access may choose multi-user or enterprise licenses for cost-effective access to the report.
13. Are there any additional resources or data provided in the Can Coatings Market report?
While the report offers comprehensive insights, it's advisable to review the specific contents or supplementary materials provided to ascertain if additional resources or data are available.
14. How can I stay updated on further developments or reports in the Can Coatings Market?
To stay informed about further developments, trends, and reports in the Can Coatings Market, consider subscribing to industry newsletters, following relevant companies and organizations, or regularly checking reputable industry news sources and publications.
Methodology
Step 1 - Identification of Relevant Samples Size from Population Database


Step 2 - Approaches for Defining Global Market Size (Value, Volume* & Price*)

Note*: In applicable scenarios
Step 3 - Data Sources
Primary Research
- Web Analytics
- Survey Reports
- Research Institute
- Latest Research Reports
- Opinion Leaders
Secondary Research
- Annual Reports
- White Paper
- Latest Press Release
- Industry Association
- Paid Database
- Investor Presentations

Step 4 - Data Triangulation
Involves using different sources of information in order to increase the validity of a study
These sources are likely to be stakeholders in a program - participants, other researchers, program staff, other community members, and so on.
Then we put all data in single framework & apply various statistical tools to find out the dynamic on the market.
During the analysis stage, feedback from the stakeholder groups would be compared to determine areas of agreement as well as areas of divergence


