
Key Insights
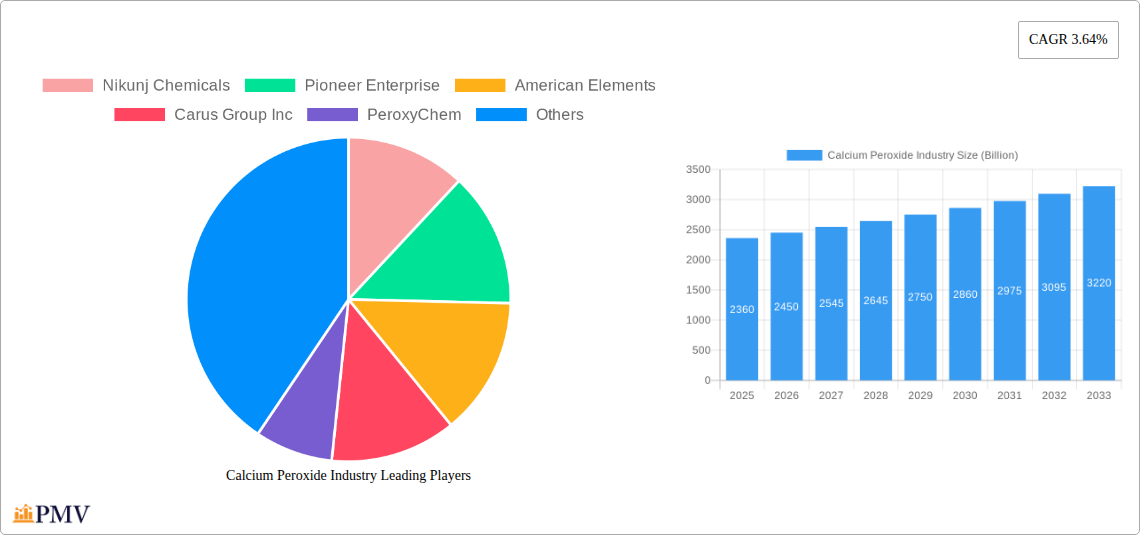
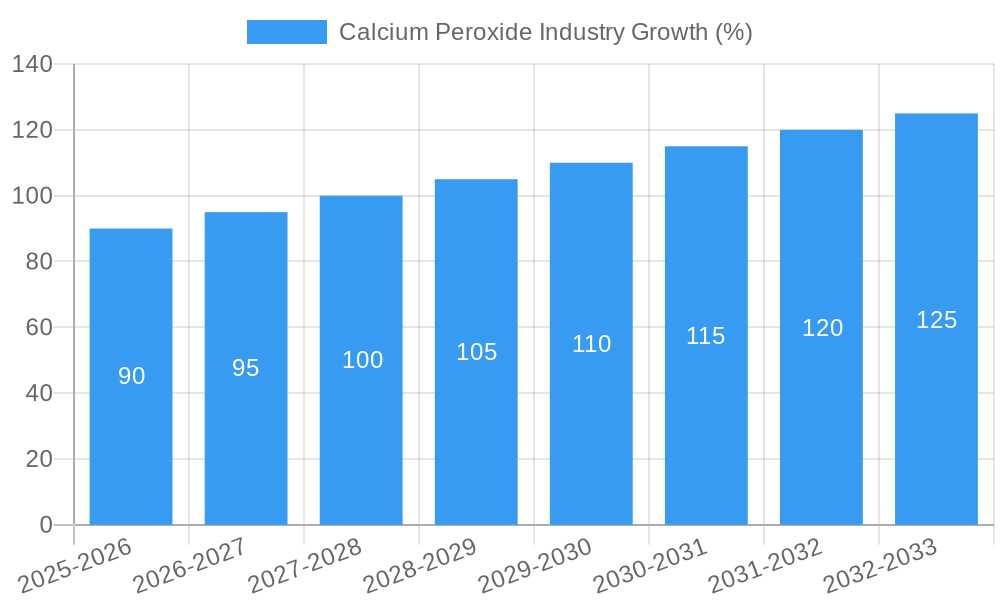
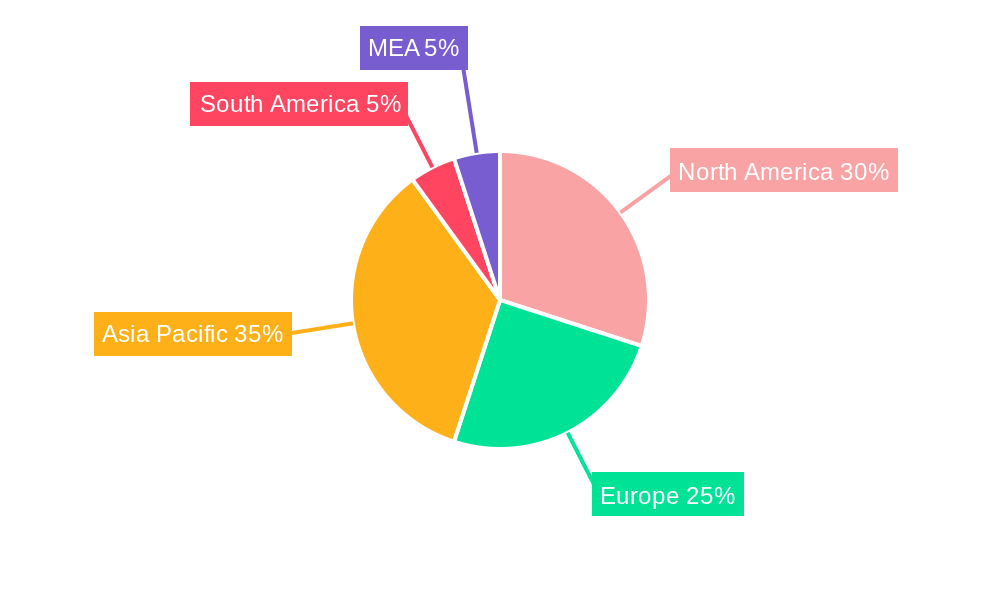
The global calcium peroxide market, valued at $2.36 billion in 2025, is projected to experience steady growth, driven by its diverse applications across various industries. A compound annual growth rate (CAGR) of 3.64% from 2025 to 2033 indicates a significant expansion, primarily fueled by increasing demand in the food and beverage sector for bleaching and dough conditioning agents, and in agriculture for seed disinfectants. The rising awareness of food safety and the need for effective preservation techniques further boost market growth. Growth within the industrial segment is expected to be driven by its use as an oxidizing agent and intermediary chemical in various manufacturing processes. While potential regulatory hurdles and price fluctuations in raw materials could pose challenges, ongoing research and development efforts focused on enhancing the efficacy and sustainability of calcium peroxide are expected to mitigate these risks and drive market expansion. Geographic expansion will also influence growth with the Asia-Pacific region projected to witness substantial growth due to increasing industrialization and agricultural activities. North America and Europe will continue to hold significant market shares owing to established industries and stringent regulations on food safety and environmental protection.
The competitive landscape is characterized by a mix of established players and regional manufacturers. Key players such as Solvay SA, Carus Group Inc., and PeroxyChem are leveraging their established distribution networks and technological advancements to maintain market leadership. However, emerging companies are also gaining traction by focusing on niche applications and regional markets. The market is likely to see increased consolidation and strategic partnerships in the coming years, driven by the need for innovation and market expansion. Future growth will depend on the success of companies in developing innovative products, expanding into new geographic markets, and strategically addressing environmental concerns associated with chemical production. Focus on sustainable manufacturing practices will be critical for long-term success in this industry.
Calcium Peroxide Industry Market Report: 2019-2033
This comprehensive report provides a detailed analysis of the global Calcium Peroxide market, offering invaluable insights for businesses, investors, and researchers seeking to understand this dynamic sector. The report covers the period from 2019 to 2033, with a focus on the forecast period from 2025 to 2033 and a base year of 2025. The market is segmented by grade (Food, Industrial), application (Seed Disinfectant, Bleaching Agent, Dough Conditioner, Oxidizing Agent, Intermediary Chemicals, Other Applications), and end-user industry (Food and Beverages, Agriculture, Mining, Pharmaceuticals, Paper and Pulp, Other End-user Industries). The total market size is projected to reach xx Billion by 2033.
Calcium Peroxide Industry Market Structure & Competitive Dynamics
This section analyzes the competitive landscape of the Calcium Peroxide industry, examining market concentration, innovation ecosystems, regulatory frameworks, product substitutes, end-user trends, and mergers and acquisitions (M&A) activities. The market is moderately concentrated, with key players holding significant market share. However, the presence of several smaller players indicates a dynamic competitive environment. Innovation is driven by the need for higher efficiency and improved product performance, particularly in niche applications. Regulatory frameworks vary across regions, influencing product standards and market access. Substitutes for Calcium Peroxide exist, but their effectiveness and cost-competitiveness often limit their adoption. End-user trends, particularly in the food and agriculture sectors, significantly impact demand. M&A activity has been moderate, with deal values ranging from xx Billion to xx Billion in recent years, primarily focused on expanding geographic reach and product portfolios. Key metrics like market share and deal values are further detailed within the complete report.
- Market Concentration: Moderately concentrated, with top 5 players holding approximately xx% market share.
- Innovation Ecosystems: Focus on improving efficiency, developing niche applications, and enhancing safety profiles.
- Regulatory Frameworks: Vary significantly across regions, impacting product approvals and market access.
- Product Substitutes: Limited, with existing substitutes often less cost-effective or less effective than Calcium Peroxide.
- M&A Activity: Moderate activity observed, primarily focused on expansion and diversification.
Calcium Peroxide Industry Industry Trends & Insights
This section explores the key trends and insights shaping the Calcium Peroxide market. Market growth is driven by increasing demand from various end-use sectors, particularly in agriculture (as a seed disinfectant) and food and beverages (as a bleaching agent and dough conditioner). Technological advancements are leading to improved production efficiency and the development of specialized grades for niche applications. Consumer preference for natural and organic products is also influencing market growth, with demand for food-grade Calcium Peroxide on the rise. The Compound Annual Growth Rate (CAGR) during the forecast period (2025-2033) is estimated to be xx%, driven by factors such as increasing industrialization and rising demand for environmentally friendly solutions. Market penetration in specific regions, especially in developing economies, is expected to increase significantly.
Dominant Markets & Segments in Calcium Peroxide Industry
This section identifies the leading regions, countries, and segments within the Calcium Peroxide market. The report reveals that [Specify Leading Region/Country - e.g., North America] currently dominates the market, driven by strong demand from the pharmaceutical and food and beverage industries. [Specify Leading Segment - e.g., Industrial grade Calcium Peroxide] holds the largest market share, mainly due to its wide application in various industrial processes.
Key Drivers for Dominant Regions/Segments:
- North America: Strong regulatory framework, established industrial base, and high per capita consumption.
- [Specify Leading Segment - e.g., Industrial grade Calcium Peroxide]: Wide range of applications across multiple end-user industries.
- Specific country analysis further explores economic policies, infrastructure development, and other factors contributing to market dominance.
Calcium Peroxide Industry Product Innovations
Recent product innovations include the development of higher-purity Calcium Peroxide grades tailored to specific applications, enhancing efficiency and reducing waste. This also involves advancements in controlled release formulations, improving efficacy and reducing environmental impact. These innovations are aimed at meeting the specific requirements of various end-users, enhancing the competitive advantages of Calcium Peroxide in various sectors.
Report Segmentation & Scope
The report segments the Calcium Peroxide market by grade (Food, Industrial), application (Seed Disinfectant, Bleaching Agent, Dough Conditioner, Oxidizing Agent, Intermediary Chemicals, Other Applications), and end-user industry (Food and Beverages, Agriculture, Mining, Pharmaceuticals, Paper and Pulp, Other End-user Industries). Each segment is analyzed in detail, providing insights into market size, growth projections, and competitive dynamics. For example, the Food grade segment is expected to experience significant growth driven by increasing consumer demand for naturally processed foods. Similarly, the agricultural applications segment exhibits high growth potential due to its efficacy as a seed disinfectant and soil amendment.
Key Drivers of Calcium Peroxide Industry Growth
The growth of the Calcium Peroxide industry is fueled by several factors: increasing demand from diverse end-use sectors (especially agriculture and food processing), technological advancements leading to improved product efficacy and production efficiency, and the rising preference for eco-friendly alternatives in various industries. Favorable government regulations in certain regions also contribute to market expansion.
Challenges in the Calcium Peroxide Industry Sector
The Calcium Peroxide industry faces challenges such as fluctuations in raw material prices, stringent regulatory compliance requirements, and the presence of substitute products. Supply chain disruptions and intense competition from other bleaching agents and oxidants can also affect market growth. These factors can impact profitability and hinder the industry's growth trajectory, leading to a need for strategic adaptation and innovation.
Leading Players in the Calcium Peroxide Industry Market
- Nikunj Chemicals
- Pioneer Enterprise
- American Elements
- Carus Group Inc
- PeroxyChem
- Sunway Lab
- Zhengzhou Huize Biochemical Technology Co Ltd
- Solvay SA
- Mahalaxmi Enterprise
- Shangyu Jie Hua Chemical Co
- STP Chem Solutions Co Ltd
- Noshly Pty Ltd
Key Developments in Calcium Peroxide Industry Sector
- 2022-Q4: [Company Name] launched a new high-purity grade of Calcium Peroxide targeting the pharmaceutical industry.
- 2023-Q1: [Company Name] and [Company Name] announced a strategic partnership to expand their distribution network.
- 2023-Q3: New regulatory guidelines impacting the use of Calcium Peroxide in the food and beverage industry were introduced in [Region/Country]. (Further developments will be included in the complete report)
Strategic Calcium Peroxide Industry Market Outlook
The Calcium Peroxide market holds significant future potential, driven by continuous technological innovations, the expansion of its applications across diverse sectors, and growing demand for sustainable solutions. Strategic opportunities exist in developing specialized grades for niche applications and expanding into emerging markets. Focus on research and development, coupled with effective supply chain management, is crucial for capturing future market share and achieving sustainable growth.
Calcium Peroxide Industry Segmentation
-
1. Grade
- 1.1. Food
- 1.2. Industrial
-
2. Application
- 2.1. Seed Disinfectant
- 2.2. Bleaching Agent
- 2.3. Dough Conditioner
- 2.4. Oxidizing Agent
- 2.5. Intermediary Chemicals
- 2.6. Other Applications
-
3. End-user Industry
- 3.1. Food and Beverages
- 3.2. Agriculture
- 3.3. Mining
- 3.4. Pharmaceuticals
- 3.5. Paper and Pulp
- 3.6. Other End-user Industries
Calcium Peroxide Industry Segmentation By Geography
-
1. Asia Pacific
- 1.1. China
- 1.2. India
- 1.3. Japan
- 1.4. South Korea
- 1.5. Rest of Asia Pacific
-
2. North America
- 2.1. United States
- 2.2. Canada
- 2.3. Mexico
-
3. Europe
- 3.1. Germany
- 3.2. United Kingdom
- 3.3. Italy
- 3.4. France
- 3.5. Rest of Europe
-
4. South America
- 4.1. Brazil
- 4.2. Argentina
- 4.3. Rest of South America
-
5. Middle East and Africa
- 5.1. Saudi Arabia
- 5.2. South Africa
- 5.3. Rest of Middle East and Africa
Calcium Peroxide Industry REPORT HIGHLIGHTS
| Aspects | Details |
|---|---|
| Study Period | 2019-2033 |
| Base Year | 2024 |
| Estimated Year | 2025 |
| Forecast Period | 2025-2033 |
| Historical Period | 2019-2024 |
| Growth Rate | CAGR of 3.64% from 2019-2033 |
| Segmentation |
|
Table of Contents
- 1. Introduction
- 1.1. Research Scope
- 1.2. Market Segmentation
- 1.3. Research Methodology
- 1.4. Definitions and Assumptions
- 2. Executive Summary
- 2.1. Introduction
- 3. Market Dynamics
- 3.1. Introduction
- 3.2. Market Drivers
- 3.2.1. ; Increase in Utilization as Dough Conditioner in the Food Industry; Increase in Usage in the Oral Care Industry
- 3.3. Market Restrains
- 3.3.1. ; Potential Hazardous Effects of Calcium Peroxide
- 3.4. Market Trends
- 3.4.1. Increasing Demand from Food and Beverage Industry
- 4. Market Factor Analysis
- 4.1. Porters Five Forces
- 4.2. Supply/Value Chain
- 4.3. PESTEL analysis
- 4.4. Market Entropy
- 4.5. Patent/Trademark Analysis
- 5. Global Calcium Peroxide Industry Analysis, Insights and Forecast, 2019-2031
- 5.1. Market Analysis, Insights and Forecast - by Grade
- 5.1.1. Food
- 5.1.2. Industrial
- 5.2. Market Analysis, Insights and Forecast - by Application
- 5.2.1. Seed Disinfectant
- 5.2.2. Bleaching Agent
- 5.2.3. Dough Conditioner
- 5.2.4. Oxidizing Agent
- 5.2.5. Intermediary Chemicals
- 5.2.6. Other Applications
- 5.3. Market Analysis, Insights and Forecast - by End-user Industry
- 5.3.1. Food and Beverages
- 5.3.2. Agriculture
- 5.3.3. Mining
- 5.3.4. Pharmaceuticals
- 5.3.5. Paper and Pulp
- 5.3.6. Other End-user Industries
- 5.4. Market Analysis, Insights and Forecast - by Region
- 5.4.1. Asia Pacific
- 5.4.2. North America
- 5.4.3. Europe
- 5.4.4. South America
- 5.4.5. Middle East and Africa
- 5.1. Market Analysis, Insights and Forecast - by Grade
- 6. Asia Pacific Calcium Peroxide Industry Analysis, Insights and Forecast, 2019-2031
- 6.1. Market Analysis, Insights and Forecast - by Grade
- 6.1.1. Food
- 6.1.2. Industrial
- 6.2. Market Analysis, Insights and Forecast - by Application
- 6.2.1. Seed Disinfectant
- 6.2.2. Bleaching Agent
- 6.2.3. Dough Conditioner
- 6.2.4. Oxidizing Agent
- 6.2.5. Intermediary Chemicals
- 6.2.6. Other Applications
- 6.3. Market Analysis, Insights and Forecast - by End-user Industry
- 6.3.1. Food and Beverages
- 6.3.2. Agriculture
- 6.3.3. Mining
- 6.3.4. Pharmaceuticals
- 6.3.5. Paper and Pulp
- 6.3.6. Other End-user Industries
- 6.1. Market Analysis, Insights and Forecast - by Grade
- 7. North America Calcium Peroxide Industry Analysis, Insights and Forecast, 2019-2031
- 7.1. Market Analysis, Insights and Forecast - by Grade
- 7.1.1. Food
- 7.1.2. Industrial
- 7.2. Market Analysis, Insights and Forecast - by Application
- 7.2.1. Seed Disinfectant
- 7.2.2. Bleaching Agent
- 7.2.3. Dough Conditioner
- 7.2.4. Oxidizing Agent
- 7.2.5. Intermediary Chemicals
- 7.2.6. Other Applications
- 7.3. Market Analysis, Insights and Forecast - by End-user Industry
- 7.3.1. Food and Beverages
- 7.3.2. Agriculture
- 7.3.3. Mining
- 7.3.4. Pharmaceuticals
- 7.3.5. Paper and Pulp
- 7.3.6. Other End-user Industries
- 7.1. Market Analysis, Insights and Forecast - by Grade
- 8. Europe Calcium Peroxide Industry Analysis, Insights and Forecast, 2019-2031
- 8.1. Market Analysis, Insights and Forecast - by Grade
- 8.1.1. Food
- 8.1.2. Industrial
- 8.2. Market Analysis, Insights and Forecast - by Application
- 8.2.1. Seed Disinfectant
- 8.2.2. Bleaching Agent
- 8.2.3. Dough Conditioner
- 8.2.4. Oxidizing Agent
- 8.2.5. Intermediary Chemicals
- 8.2.6. Other Applications
- 8.3. Market Analysis, Insights and Forecast - by End-user Industry
- 8.3.1. Food and Beverages
- 8.3.2. Agriculture
- 8.3.3. Mining
- 8.3.4. Pharmaceuticals
- 8.3.5. Paper and Pulp
- 8.3.6. Other End-user Industries
- 8.1. Market Analysis, Insights and Forecast - by Grade
- 9. South America Calcium Peroxide Industry Analysis, Insights and Forecast, 2019-2031
- 9.1. Market Analysis, Insights and Forecast - by Grade
- 9.1.1. Food
- 9.1.2. Industrial
- 9.2. Market Analysis, Insights and Forecast - by Application
- 9.2.1. Seed Disinfectant
- 9.2.2. Bleaching Agent
- 9.2.3. Dough Conditioner
- 9.2.4. Oxidizing Agent
- 9.2.5. Intermediary Chemicals
- 9.2.6. Other Applications
- 9.3. Market Analysis, Insights and Forecast - by End-user Industry
- 9.3.1. Food and Beverages
- 9.3.2. Agriculture
- 9.3.3. Mining
- 9.3.4. Pharmaceuticals
- 9.3.5. Paper and Pulp
- 9.3.6. Other End-user Industries
- 9.1. Market Analysis, Insights and Forecast - by Grade
- 10. Middle East and Africa Calcium Peroxide Industry Analysis, Insights and Forecast, 2019-2031
- 10.1. Market Analysis, Insights and Forecast - by Grade
- 10.1.1. Food
- 10.1.2. Industrial
- 10.2. Market Analysis, Insights and Forecast - by Application
- 10.2.1. Seed Disinfectant
- 10.2.2. Bleaching Agent
- 10.2.3. Dough Conditioner
- 10.2.4. Oxidizing Agent
- 10.2.5. Intermediary Chemicals
- 10.2.6. Other Applications
- 10.3. Market Analysis, Insights and Forecast - by End-user Industry
- 10.3.1. Food and Beverages
- 10.3.2. Agriculture
- 10.3.3. Mining
- 10.3.4. Pharmaceuticals
- 10.3.5. Paper and Pulp
- 10.3.6. Other End-user Industries
- 10.1. Market Analysis, Insights and Forecast - by Grade
- 11. North America Calcium Peroxide Industry Analysis, Insights and Forecast, 2019-2031
- 11.1. Market Analysis, Insights and Forecast - By Country/Sub-region
- 11.1.1 United States
- 11.1.2 Canada
- 11.1.3 Mexico
- 12. Europe Calcium Peroxide Industry Analysis, Insights and Forecast, 2019-2031
- 12.1. Market Analysis, Insights and Forecast - By Country/Sub-region
- 12.1.1 Germany
- 12.1.2 France
- 12.1.3 Italy
- 12.1.4 United Kingdom
- 12.1.5 Netherlands
- 12.1.6 Rest of Europe
- 13. Asia Pacific Calcium Peroxide Industry Analysis, Insights and Forecast, 2019-2031
- 13.1. Market Analysis, Insights and Forecast - By Country/Sub-region
- 13.1.1 China
- 13.1.2 Japan
- 13.1.3 India
- 13.1.4 South Korea
- 13.1.5 Taiwan
- 13.1.6 Australia
- 13.1.7 Rest of Asia-Pacific
- 14. South America Calcium Peroxide Industry Analysis, Insights and Forecast, 2019-2031
- 14.1. Market Analysis, Insights and Forecast - By Country/Sub-region
- 14.1.1 Brazil
- 14.1.2 Argentina
- 14.1.3 Rest of South America
- 15. MEA Calcium Peroxide Industry Analysis, Insights and Forecast, 2019-2031
- 15.1. Market Analysis, Insights and Forecast - By Country/Sub-region
- 15.1.1 Middle East
- 15.1.2 Africa
- 16. Competitive Analysis
- 16.1. Global Market Share Analysis 2024
- 16.2. Company Profiles
- 16.2.1 Nikunj Chemicals
- 16.2.1.1. Overview
- 16.2.1.2. Products
- 16.2.1.3. SWOT Analysis
- 16.2.1.4. Recent Developments
- 16.2.1.5. Financials (Based on Availability)
- 16.2.2 Pioneer Enterprise
- 16.2.2.1. Overview
- 16.2.2.2. Products
- 16.2.2.3. SWOT Analysis
- 16.2.2.4. Recent Developments
- 16.2.2.5. Financials (Based on Availability)
- 16.2.3 American Elements
- 16.2.3.1. Overview
- 16.2.3.2. Products
- 16.2.3.3. SWOT Analysis
- 16.2.3.4. Recent Developments
- 16.2.3.5. Financials (Based on Availability)
- 16.2.4 Carus Group Inc
- 16.2.4.1. Overview
- 16.2.4.2. Products
- 16.2.4.3. SWOT Analysis
- 16.2.4.4. Recent Developments
- 16.2.4.5. Financials (Based on Availability)
- 16.2.5 PeroxyChem
- 16.2.5.1. Overview
- 16.2.5.2. Products
- 16.2.5.3. SWOT Analysis
- 16.2.5.4. Recent Developments
- 16.2.5.5. Financials (Based on Availability)
- 16.2.6 Sunway Lab
- 16.2.6.1. Overview
- 16.2.6.2. Products
- 16.2.6.3. SWOT Analysis
- 16.2.6.4. Recent Developments
- 16.2.6.5. Financials (Based on Availability)
- 16.2.7 Zhengzhou Huize Biochemical Technology Co Ltd
- 16.2.7.1. Overview
- 16.2.7.2. Products
- 16.2.7.3. SWOT Analysis
- 16.2.7.4. Recent Developments
- 16.2.7.5. Financials (Based on Availability)
- 16.2.8 Solvay SA
- 16.2.8.1. Overview
- 16.2.8.2. Products
- 16.2.8.3. SWOT Analysis
- 16.2.8.4. Recent Developments
- 16.2.8.5. Financials (Based on Availability)
- 16.2.9 Mahalaxmi Enterprise
- 16.2.9.1. Overview
- 16.2.9.2. Products
- 16.2.9.3. SWOT Analysis
- 16.2.9.4. Recent Developments
- 16.2.9.5. Financials (Based on Availability)
- 16.2.10 Shangyu Jie Hua Chemical Co
- 16.2.10.1. Overview
- 16.2.10.2. Products
- 16.2.10.3. SWOT Analysis
- 16.2.10.4. Recent Developments
- 16.2.10.5. Financials (Based on Availability)
- 16.2.11 STP Chem Solutions Co Ltd
- 16.2.11.1. Overview
- 16.2.11.2. Products
- 16.2.11.3. SWOT Analysis
- 16.2.11.4. Recent Developments
- 16.2.11.5. Financials (Based on Availability)
- 16.2.12 Noshly Pty Ltd
- 16.2.12.1. Overview
- 16.2.12.2. Products
- 16.2.12.3. SWOT Analysis
- 16.2.12.4. Recent Developments
- 16.2.12.5. Financials (Based on Availability)
- 16.2.1 Nikunj Chemicals
List of Figures
- Figure 1: Global Calcium Peroxide Industry Revenue Breakdown (Billion, %) by Region 2024 & 2032
- Figure 2: Global Calcium Peroxide Industry Volume Breakdown (K Tons, %) by Region 2024 & 2032
- Figure 3: North America Calcium Peroxide Industry Revenue (Billion), by Country 2024 & 2032
- Figure 4: North America Calcium Peroxide Industry Volume (K Tons), by Country 2024 & 2032
- Figure 5: North America Calcium Peroxide Industry Revenue Share (%), by Country 2024 & 2032
- Figure 6: North America Calcium Peroxide Industry Volume Share (%), by Country 2024 & 2032
- Figure 7: Europe Calcium Peroxide Industry Revenue (Billion), by Country 2024 & 2032
- Figure 8: Europe Calcium Peroxide Industry Volume (K Tons), by Country 2024 & 2032
- Figure 9: Europe Calcium Peroxide Industry Revenue Share (%), by Country 2024 & 2032
- Figure 10: Europe Calcium Peroxide Industry Volume Share (%), by Country 2024 & 2032
- Figure 11: Asia Pacific Calcium Peroxide Industry Revenue (Billion), by Country 2024 & 2032
- Figure 12: Asia Pacific Calcium Peroxide Industry Volume (K Tons), by Country 2024 & 2032
- Figure 13: Asia Pacific Calcium Peroxide Industry Revenue Share (%), by Country 2024 & 2032
- Figure 14: Asia Pacific Calcium Peroxide Industry Volume Share (%), by Country 2024 & 2032
- Figure 15: South America Calcium Peroxide Industry Revenue (Billion), by Country 2024 & 2032
- Figure 16: South America Calcium Peroxide Industry Volume (K Tons), by Country 2024 & 2032
- Figure 17: South America Calcium Peroxide Industry Revenue Share (%), by Country 2024 & 2032
- Figure 18: South America Calcium Peroxide Industry Volume Share (%), by Country 2024 & 2032
- Figure 19: MEA Calcium Peroxide Industry Revenue (Billion), by Country 2024 & 2032
- Figure 20: MEA Calcium Peroxide Industry Volume (K Tons), by Country 2024 & 2032
- Figure 21: MEA Calcium Peroxide Industry Revenue Share (%), by Country 2024 & 2032
- Figure 22: MEA Calcium Peroxide Industry Volume Share (%), by Country 2024 & 2032
- Figure 23: Asia Pacific Calcium Peroxide Industry Revenue (Billion), by Grade 2024 & 2032
- Figure 24: Asia Pacific Calcium Peroxide Industry Volume (K Tons), by Grade 2024 & 2032
- Figure 25: Asia Pacific Calcium Peroxide Industry Revenue Share (%), by Grade 2024 & 2032
- Figure 26: Asia Pacific Calcium Peroxide Industry Volume Share (%), by Grade 2024 & 2032
- Figure 27: Asia Pacific Calcium Peroxide Industry Revenue (Billion), by Application 2024 & 2032
- Figure 28: Asia Pacific Calcium Peroxide Industry Volume (K Tons), by Application 2024 & 2032
- Figure 29: Asia Pacific Calcium Peroxide Industry Revenue Share (%), by Application 2024 & 2032
- Figure 30: Asia Pacific Calcium Peroxide Industry Volume Share (%), by Application 2024 & 2032
- Figure 31: Asia Pacific Calcium Peroxide Industry Revenue (Billion), by End-user Industry 2024 & 2032
- Figure 32: Asia Pacific Calcium Peroxide Industry Volume (K Tons), by End-user Industry 2024 & 2032
- Figure 33: Asia Pacific Calcium Peroxide Industry Revenue Share (%), by End-user Industry 2024 & 2032
- Figure 34: Asia Pacific Calcium Peroxide Industry Volume Share (%), by End-user Industry 2024 & 2032
- Figure 35: Asia Pacific Calcium Peroxide Industry Revenue (Billion), by Country 2024 & 2032
- Figure 36: Asia Pacific Calcium Peroxide Industry Volume (K Tons), by Country 2024 & 2032
- Figure 37: Asia Pacific Calcium Peroxide Industry Revenue Share (%), by Country 2024 & 2032
- Figure 38: Asia Pacific Calcium Peroxide Industry Volume Share (%), by Country 2024 & 2032
- Figure 39: North America Calcium Peroxide Industry Revenue (Billion), by Grade 2024 & 2032
- Figure 40: North America Calcium Peroxide Industry Volume (K Tons), by Grade 2024 & 2032
- Figure 41: North America Calcium Peroxide Industry Revenue Share (%), by Grade 2024 & 2032
- Figure 42: North America Calcium Peroxide Industry Volume Share (%), by Grade 2024 & 2032
- Figure 43: North America Calcium Peroxide Industry Revenue (Billion), by Application 2024 & 2032
- Figure 44: North America Calcium Peroxide Industry Volume (K Tons), by Application 2024 & 2032
- Figure 45: North America Calcium Peroxide Industry Revenue Share (%), by Application 2024 & 2032
- Figure 46: North America Calcium Peroxide Industry Volume Share (%), by Application 2024 & 2032
- Figure 47: North America Calcium Peroxide Industry Revenue (Billion), by End-user Industry 2024 & 2032
- Figure 48: North America Calcium Peroxide Industry Volume (K Tons), by End-user Industry 2024 & 2032
- Figure 49: North America Calcium Peroxide Industry Revenue Share (%), by End-user Industry 2024 & 2032
- Figure 50: North America Calcium Peroxide Industry Volume Share (%), by End-user Industry 2024 & 2032
- Figure 51: North America Calcium Peroxide Industry Revenue (Billion), by Country 2024 & 2032
- Figure 52: North America Calcium Peroxide Industry Volume (K Tons), by Country 2024 & 2032
- Figure 53: North America Calcium Peroxide Industry Revenue Share (%), by Country 2024 & 2032
- Figure 54: North America Calcium Peroxide Industry Volume Share (%), by Country 2024 & 2032
- Figure 55: Europe Calcium Peroxide Industry Revenue (Billion), by Grade 2024 & 2032
- Figure 56: Europe Calcium Peroxide Industry Volume (K Tons), by Grade 2024 & 2032
- Figure 57: Europe Calcium Peroxide Industry Revenue Share (%), by Grade 2024 & 2032
- Figure 58: Europe Calcium Peroxide Industry Volume Share (%), by Grade 2024 & 2032
- Figure 59: Europe Calcium Peroxide Industry Revenue (Billion), by Application 2024 & 2032
- Figure 60: Europe Calcium Peroxide Industry Volume (K Tons), by Application 2024 & 2032
- Figure 61: Europe Calcium Peroxide Industry Revenue Share (%), by Application 2024 & 2032
- Figure 62: Europe Calcium Peroxide Industry Volume Share (%), by Application 2024 & 2032
- Figure 63: Europe Calcium Peroxide Industry Revenue (Billion), by End-user Industry 2024 & 2032
- Figure 64: Europe Calcium Peroxide Industry Volume (K Tons), by End-user Industry 2024 & 2032
- Figure 65: Europe Calcium Peroxide Industry Revenue Share (%), by End-user Industry 2024 & 2032
- Figure 66: Europe Calcium Peroxide Industry Volume Share (%), by End-user Industry 2024 & 2032
- Figure 67: Europe Calcium Peroxide Industry Revenue (Billion), by Country 2024 & 2032
- Figure 68: Europe Calcium Peroxide Industry Volume (K Tons), by Country 2024 & 2032
- Figure 69: Europe Calcium Peroxide Industry Revenue Share (%), by Country 2024 & 2032
- Figure 70: Europe Calcium Peroxide Industry Volume Share (%), by Country 2024 & 2032
- Figure 71: South America Calcium Peroxide Industry Revenue (Billion), by Grade 2024 & 2032
- Figure 72: South America Calcium Peroxide Industry Volume (K Tons), by Grade 2024 & 2032
- Figure 73: South America Calcium Peroxide Industry Revenue Share (%), by Grade 2024 & 2032
- Figure 74: South America Calcium Peroxide Industry Volume Share (%), by Grade 2024 & 2032
- Figure 75: South America Calcium Peroxide Industry Revenue (Billion), by Application 2024 & 2032
- Figure 76: South America Calcium Peroxide Industry Volume (K Tons), by Application 2024 & 2032
- Figure 77: South America Calcium Peroxide Industry Revenue Share (%), by Application 2024 & 2032
- Figure 78: South America Calcium Peroxide Industry Volume Share (%), by Application 2024 & 2032
- Figure 79: South America Calcium Peroxide Industry Revenue (Billion), by End-user Industry 2024 & 2032
- Figure 80: South America Calcium Peroxide Industry Volume (K Tons), by End-user Industry 2024 & 2032
- Figure 81: South America Calcium Peroxide Industry Revenue Share (%), by End-user Industry 2024 & 2032
- Figure 82: South America Calcium Peroxide Industry Volume Share (%), by End-user Industry 2024 & 2032
- Figure 83: South America Calcium Peroxide Industry Revenue (Billion), by Country 2024 & 2032
- Figure 84: South America Calcium Peroxide Industry Volume (K Tons), by Country 2024 & 2032
- Figure 85: South America Calcium Peroxide Industry Revenue Share (%), by Country 2024 & 2032
- Figure 86: South America Calcium Peroxide Industry Volume Share (%), by Country 2024 & 2032
- Figure 87: Middle East and Africa Calcium Peroxide Industry Revenue (Billion), by Grade 2024 & 2032
- Figure 88: Middle East and Africa Calcium Peroxide Industry Volume (K Tons), by Grade 2024 & 2032
- Figure 89: Middle East and Africa Calcium Peroxide Industry Revenue Share (%), by Grade 2024 & 2032
- Figure 90: Middle East and Africa Calcium Peroxide Industry Volume Share (%), by Grade 2024 & 2032
- Figure 91: Middle East and Africa Calcium Peroxide Industry Revenue (Billion), by Application 2024 & 2032
- Figure 92: Middle East and Africa Calcium Peroxide Industry Volume (K Tons), by Application 2024 & 2032
- Figure 93: Middle East and Africa Calcium Peroxide Industry Revenue Share (%), by Application 2024 & 2032
- Figure 94: Middle East and Africa Calcium Peroxide Industry Volume Share (%), by Application 2024 & 2032
- Figure 95: Middle East and Africa Calcium Peroxide Industry Revenue (Billion), by End-user Industry 2024 & 2032
- Figure 96: Middle East and Africa Calcium Peroxide Industry Volume (K Tons), by End-user Industry 2024 & 2032
- Figure 97: Middle East and Africa Calcium Peroxide Industry Revenue Share (%), by End-user Industry 2024 & 2032
- Figure 98: Middle East and Africa Calcium Peroxide Industry Volume Share (%), by End-user Industry 2024 & 2032
- Figure 99: Middle East and Africa Calcium Peroxide Industry Revenue (Billion), by Country 2024 & 2032
- Figure 100: Middle East and Africa Calcium Peroxide Industry Volume (K Tons), by Country 2024 & 2032
- Figure 101: Middle East and Africa Calcium Peroxide Industry Revenue Share (%), by Country 2024 & 2032
- Figure 102: Middle East and Africa Calcium Peroxide Industry Volume Share (%), by Country 2024 & 2032
List of Tables
- Table 1: Global Calcium Peroxide Industry Revenue Billion Forecast, by Region 2019 & 2032
- Table 2: Global Calcium Peroxide Industry Volume K Tons Forecast, by Region 2019 & 2032
- Table 3: Global Calcium Peroxide Industry Revenue Billion Forecast, by Grade 2019 & 2032
- Table 4: Global Calcium Peroxide Industry Volume K Tons Forecast, by Grade 2019 & 2032
- Table 5: Global Calcium Peroxide Industry Revenue Billion Forecast, by Application 2019 & 2032
- Table 6: Global Calcium Peroxide Industry Volume K Tons Forecast, by Application 2019 & 2032
- Table 7: Global Calcium Peroxide Industry Revenue Billion Forecast, by End-user Industry 2019 & 2032
- Table 8: Global Calcium Peroxide Industry Volume K Tons Forecast, by End-user Industry 2019 & 2032
- Table 9: Global Calcium Peroxide Industry Revenue Billion Forecast, by Region 2019 & 2032
- Table 10: Global Calcium Peroxide Industry Volume K Tons Forecast, by Region 2019 & 2032
- Table 11: Global Calcium Peroxide Industry Revenue Billion Forecast, by Country 2019 & 2032
- Table 12: Global Calcium Peroxide Industry Volume K Tons Forecast, by Country 2019 & 2032
- Table 13: United States Calcium Peroxide Industry Revenue (Billion) Forecast, by Application 2019 & 2032
- Table 14: United States Calcium Peroxide Industry Volume (K Tons) Forecast, by Application 2019 & 2032
- Table 15: Canada Calcium Peroxide Industry Revenue (Billion) Forecast, by Application 2019 & 2032
- Table 16: Canada Calcium Peroxide Industry Volume (K Tons) Forecast, by Application 2019 & 2032
- Table 17: Mexico Calcium Peroxide Industry Revenue (Billion) Forecast, by Application 2019 & 2032
- Table 18: Mexico Calcium Peroxide Industry Volume (K Tons) Forecast, by Application 2019 & 2032
- Table 19: Global Calcium Peroxide Industry Revenue Billion Forecast, by Country 2019 & 2032
- Table 20: Global Calcium Peroxide Industry Volume K Tons Forecast, by Country 2019 & 2032
- Table 21: Germany Calcium Peroxide Industry Revenue (Billion) Forecast, by Application 2019 & 2032
- Table 22: Germany Calcium Peroxide Industry Volume (K Tons) Forecast, by Application 2019 & 2032
- Table 23: France Calcium Peroxide Industry Revenue (Billion) Forecast, by Application 2019 & 2032
- Table 24: France Calcium Peroxide Industry Volume (K Tons) Forecast, by Application 2019 & 2032
- Table 25: Italy Calcium Peroxide Industry Revenue (Billion) Forecast, by Application 2019 & 2032
- Table 26: Italy Calcium Peroxide Industry Volume (K Tons) Forecast, by Application 2019 & 2032
- Table 27: United Kingdom Calcium Peroxide Industry Revenue (Billion) Forecast, by Application 2019 & 2032
- Table 28: United Kingdom Calcium Peroxide Industry Volume (K Tons) Forecast, by Application 2019 & 2032
- Table 29: Netherlands Calcium Peroxide Industry Revenue (Billion) Forecast, by Application 2019 & 2032
- Table 30: Netherlands Calcium Peroxide Industry Volume (K Tons) Forecast, by Application 2019 & 2032
- Table 31: Rest of Europe Calcium Peroxide Industry Revenue (Billion) Forecast, by Application 2019 & 2032
- Table 32: Rest of Europe Calcium Peroxide Industry Volume (K Tons) Forecast, by Application 2019 & 2032
- Table 33: Global Calcium Peroxide Industry Revenue Billion Forecast, by Country 2019 & 2032
- Table 34: Global Calcium Peroxide Industry Volume K Tons Forecast, by Country 2019 & 2032
- Table 35: China Calcium Peroxide Industry Revenue (Billion) Forecast, by Application 2019 & 2032
- Table 36: China Calcium Peroxide Industry Volume (K Tons) Forecast, by Application 2019 & 2032
- Table 37: Japan Calcium Peroxide Industry Revenue (Billion) Forecast, by Application 2019 & 2032
- Table 38: Japan Calcium Peroxide Industry Volume (K Tons) Forecast, by Application 2019 & 2032
- Table 39: India Calcium Peroxide Industry Revenue (Billion) Forecast, by Application 2019 & 2032
- Table 40: India Calcium Peroxide Industry Volume (K Tons) Forecast, by Application 2019 & 2032
- Table 41: South Korea Calcium Peroxide Industry Revenue (Billion) Forecast, by Application 2019 & 2032
- Table 42: South Korea Calcium Peroxide Industry Volume (K Tons) Forecast, by Application 2019 & 2032
- Table 43: Taiwan Calcium Peroxide Industry Revenue (Billion) Forecast, by Application 2019 & 2032
- Table 44: Taiwan Calcium Peroxide Industry Volume (K Tons) Forecast, by Application 2019 & 2032
- Table 45: Australia Calcium Peroxide Industry Revenue (Billion) Forecast, by Application 2019 & 2032
- Table 46: Australia Calcium Peroxide Industry Volume (K Tons) Forecast, by Application 2019 & 2032
- Table 47: Rest of Asia-Pacific Calcium Peroxide Industry Revenue (Billion) Forecast, by Application 2019 & 2032
- Table 48: Rest of Asia-Pacific Calcium Peroxide Industry Volume (K Tons) Forecast, by Application 2019 & 2032
- Table 49: Global Calcium Peroxide Industry Revenue Billion Forecast, by Country 2019 & 2032
- Table 50: Global Calcium Peroxide Industry Volume K Tons Forecast, by Country 2019 & 2032
- Table 51: Brazil Calcium Peroxide Industry Revenue (Billion) Forecast, by Application 2019 & 2032
- Table 52: Brazil Calcium Peroxide Industry Volume (K Tons) Forecast, by Application 2019 & 2032
- Table 53: Argentina Calcium Peroxide Industry Revenue (Billion) Forecast, by Application 2019 & 2032
- Table 54: Argentina Calcium Peroxide Industry Volume (K Tons) Forecast, by Application 2019 & 2032
- Table 55: Rest of South America Calcium Peroxide Industry Revenue (Billion) Forecast, by Application 2019 & 2032
- Table 56: Rest of South America Calcium Peroxide Industry Volume (K Tons) Forecast, by Application 2019 & 2032
- Table 57: Global Calcium Peroxide Industry Revenue Billion Forecast, by Country 2019 & 2032
- Table 58: Global Calcium Peroxide Industry Volume K Tons Forecast, by Country 2019 & 2032
- Table 59: Middle East Calcium Peroxide Industry Revenue (Billion) Forecast, by Application 2019 & 2032
- Table 60: Middle East Calcium Peroxide Industry Volume (K Tons) Forecast, by Application 2019 & 2032
- Table 61: Africa Calcium Peroxide Industry Revenue (Billion) Forecast, by Application 2019 & 2032
- Table 62: Africa Calcium Peroxide Industry Volume (K Tons) Forecast, by Application 2019 & 2032
- Table 63: Global Calcium Peroxide Industry Revenue Billion Forecast, by Grade 2019 & 2032
- Table 64: Global Calcium Peroxide Industry Volume K Tons Forecast, by Grade 2019 & 2032
- Table 65: Global Calcium Peroxide Industry Revenue Billion Forecast, by Application 2019 & 2032
- Table 66: Global Calcium Peroxide Industry Volume K Tons Forecast, by Application 2019 & 2032
- Table 67: Global Calcium Peroxide Industry Revenue Billion Forecast, by End-user Industry 2019 & 2032
- Table 68: Global Calcium Peroxide Industry Volume K Tons Forecast, by End-user Industry 2019 & 2032
- Table 69: Global Calcium Peroxide Industry Revenue Billion Forecast, by Country 2019 & 2032
- Table 70: Global Calcium Peroxide Industry Volume K Tons Forecast, by Country 2019 & 2032
- Table 71: China Calcium Peroxide Industry Revenue (Billion) Forecast, by Application 2019 & 2032
- Table 72: China Calcium Peroxide Industry Volume (K Tons) Forecast, by Application 2019 & 2032
- Table 73: India Calcium Peroxide Industry Revenue (Billion) Forecast, by Application 2019 & 2032
- Table 74: India Calcium Peroxide Industry Volume (K Tons) Forecast, by Application 2019 & 2032
- Table 75: Japan Calcium Peroxide Industry Revenue (Billion) Forecast, by Application 2019 & 2032
- Table 76: Japan Calcium Peroxide Industry Volume (K Tons) Forecast, by Application 2019 & 2032
- Table 77: South Korea Calcium Peroxide Industry Revenue (Billion) Forecast, by Application 2019 & 2032
- Table 78: South Korea Calcium Peroxide Industry Volume (K Tons) Forecast, by Application 2019 & 2032
- Table 79: Rest of Asia Pacific Calcium Peroxide Industry Revenue (Billion) Forecast, by Application 2019 & 2032
- Table 80: Rest of Asia Pacific Calcium Peroxide Industry Volume (K Tons) Forecast, by Application 2019 & 2032
- Table 81: Global Calcium Peroxide Industry Revenue Billion Forecast, by Grade 2019 & 2032
- Table 82: Global Calcium Peroxide Industry Volume K Tons Forecast, by Grade 2019 & 2032
- Table 83: Global Calcium Peroxide Industry Revenue Billion Forecast, by Application 2019 & 2032
- Table 84: Global Calcium Peroxide Industry Volume K Tons Forecast, by Application 2019 & 2032
- Table 85: Global Calcium Peroxide Industry Revenue Billion Forecast, by End-user Industry 2019 & 2032
- Table 86: Global Calcium Peroxide Industry Volume K Tons Forecast, by End-user Industry 2019 & 2032
- Table 87: Global Calcium Peroxide Industry Revenue Billion Forecast, by Country 2019 & 2032
- Table 88: Global Calcium Peroxide Industry Volume K Tons Forecast, by Country 2019 & 2032
- Table 89: United States Calcium Peroxide Industry Revenue (Billion) Forecast, by Application 2019 & 2032
- Table 90: United States Calcium Peroxide Industry Volume (K Tons) Forecast, by Application 2019 & 2032
- Table 91: Canada Calcium Peroxide Industry Revenue (Billion) Forecast, by Application 2019 & 2032
- Table 92: Canada Calcium Peroxide Industry Volume (K Tons) Forecast, by Application 2019 & 2032
- Table 93: Mexico Calcium Peroxide Industry Revenue (Billion) Forecast, by Application 2019 & 2032
- Table 94: Mexico Calcium Peroxide Industry Volume (K Tons) Forecast, by Application 2019 & 2032
- Table 95: Global Calcium Peroxide Industry Revenue Billion Forecast, by Grade 2019 & 2032
- Table 96: Global Calcium Peroxide Industry Volume K Tons Forecast, by Grade 2019 & 2032
- Table 97: Global Calcium Peroxide Industry Revenue Billion Forecast, by Application 2019 & 2032
- Table 98: Global Calcium Peroxide Industry Volume K Tons Forecast, by Application 2019 & 2032
- Table 99: Global Calcium Peroxide Industry Revenue Billion Forecast, by End-user Industry 2019 & 2032
- Table 100: Global Calcium Peroxide Industry Volume K Tons Forecast, by End-user Industry 2019 & 2032
- Table 101: Global Calcium Peroxide Industry Revenue Billion Forecast, by Country 2019 & 2032
- Table 102: Global Calcium Peroxide Industry Volume K Tons Forecast, by Country 2019 & 2032
- Table 103: Germany Calcium Peroxide Industry Revenue (Billion) Forecast, by Application 2019 & 2032
- Table 104: Germany Calcium Peroxide Industry Volume (K Tons) Forecast, by Application 2019 & 2032
- Table 105: United Kingdom Calcium Peroxide Industry Revenue (Billion) Forecast, by Application 2019 & 2032
- Table 106: United Kingdom Calcium Peroxide Industry Volume (K Tons) Forecast, by Application 2019 & 2032
- Table 107: Italy Calcium Peroxide Industry Revenue (Billion) Forecast, by Application 2019 & 2032
- Table 108: Italy Calcium Peroxide Industry Volume (K Tons) Forecast, by Application 2019 & 2032
- Table 109: France Calcium Peroxide Industry Revenue (Billion) Forecast, by Application 2019 & 2032
- Table 110: France Calcium Peroxide Industry Volume (K Tons) Forecast, by Application 2019 & 2032
- Table 111: Rest of Europe Calcium Peroxide Industry Revenue (Billion) Forecast, by Application 2019 & 2032
- Table 112: Rest of Europe Calcium Peroxide Industry Volume (K Tons) Forecast, by Application 2019 & 2032
- Table 113: Global Calcium Peroxide Industry Revenue Billion Forecast, by Grade 2019 & 2032
- Table 114: Global Calcium Peroxide Industry Volume K Tons Forecast, by Grade 2019 & 2032
- Table 115: Global Calcium Peroxide Industry Revenue Billion Forecast, by Application 2019 & 2032
- Table 116: Global Calcium Peroxide Industry Volume K Tons Forecast, by Application 2019 & 2032
- Table 117: Global Calcium Peroxide Industry Revenue Billion Forecast, by End-user Industry 2019 & 2032
- Table 118: Global Calcium Peroxide Industry Volume K Tons Forecast, by End-user Industry 2019 & 2032
- Table 119: Global Calcium Peroxide Industry Revenue Billion Forecast, by Country 2019 & 2032
- Table 120: Global Calcium Peroxide Industry Volume K Tons Forecast, by Country 2019 & 2032
- Table 121: Brazil Calcium Peroxide Industry Revenue (Billion) Forecast, by Application 2019 & 2032
- Table 122: Brazil Calcium Peroxide Industry Volume (K Tons) Forecast, by Application 2019 & 2032
- Table 123: Argentina Calcium Peroxide Industry Revenue (Billion) Forecast, by Application 2019 & 2032
- Table 124: Argentina Calcium Peroxide Industry Volume (K Tons) Forecast, by Application 2019 & 2032
- Table 125: Rest of South America Calcium Peroxide Industry Revenue (Billion) Forecast, by Application 2019 & 2032
- Table 126: Rest of South America Calcium Peroxide Industry Volume (K Tons) Forecast, by Application 2019 & 2032
- Table 127: Global Calcium Peroxide Industry Revenue Billion Forecast, by Grade 2019 & 2032
- Table 128: Global Calcium Peroxide Industry Volume K Tons Forecast, by Grade 2019 & 2032
- Table 129: Global Calcium Peroxide Industry Revenue Billion Forecast, by Application 2019 & 2032
- Table 130: Global Calcium Peroxide Industry Volume K Tons Forecast, by Application 2019 & 2032
- Table 131: Global Calcium Peroxide Industry Revenue Billion Forecast, by End-user Industry 2019 & 2032
- Table 132: Global Calcium Peroxide Industry Volume K Tons Forecast, by End-user Industry 2019 & 2032
- Table 133: Global Calcium Peroxide Industry Revenue Billion Forecast, by Country 2019 & 2032
- Table 134: Global Calcium Peroxide Industry Volume K Tons Forecast, by Country 2019 & 2032
- Table 135: Saudi Arabia Calcium Peroxide Industry Revenue (Billion) Forecast, by Application 2019 & 2032
- Table 136: Saudi Arabia Calcium Peroxide Industry Volume (K Tons) Forecast, by Application 2019 & 2032
- Table 137: South Africa Calcium Peroxide Industry Revenue (Billion) Forecast, by Application 2019 & 2032
- Table 138: South Africa Calcium Peroxide Industry Volume (K Tons) Forecast, by Application 2019 & 2032
- Table 139: Rest of Middle East and Africa Calcium Peroxide Industry Revenue (Billion) Forecast, by Application 2019 & 2032
- Table 140: Rest of Middle East and Africa Calcium Peroxide Industry Volume (K Tons) Forecast, by Application 2019 & 2032
Frequently Asked Questions
1. What is the projected Compound Annual Growth Rate (CAGR) of the Calcium Peroxide Industry?
The projected CAGR is approximately 3.64%.
2. Which companies are prominent players in the Calcium Peroxide Industry?
Key companies in the market include Nikunj Chemicals, Pioneer Enterprise, American Elements, Carus Group Inc, PeroxyChem, Sunway Lab, Zhengzhou Huize Biochemical Technology Co Ltd, Solvay SA, Mahalaxmi Enterprise, Shangyu Jie Hua Chemical Co, STP Chem Solutions Co Ltd, Noshly Pty Ltd.
3. What are the main segments of the Calcium Peroxide Industry?
The market segments include Grade, Application, End-user Industry.
4. Can you provide details about the market size?
The market size is estimated to be USD 2.36 Billion as of 2022.
5. What are some drivers contributing to market growth?
; Increase in Utilization as Dough Conditioner in the Food Industry; Increase in Usage in the Oral Care Industry.
6. What are the notable trends driving market growth?
Increasing Demand from Food and Beverage Industry.
7. Are there any restraints impacting market growth?
; Potential Hazardous Effects of Calcium Peroxide.
8. Can you provide examples of recent developments in the market?
N/A
9. What pricing options are available for accessing the report?
Pricing options include single-user, multi-user, and enterprise licenses priced at USD 4750, USD 5250, and USD 8750 respectively.
10. Is the market size provided in terms of value or volume?
The market size is provided in terms of value, measured in Billion and volume, measured in K Tons.
11. Are there any specific market keywords associated with the report?
Yes, the market keyword associated with the report is "Calcium Peroxide Industry," which aids in identifying and referencing the specific market segment covered.
12. How do I determine which pricing option suits my needs best?
The pricing options vary based on user requirements and access needs. Individual users may opt for single-user licenses, while businesses requiring broader access may choose multi-user or enterprise licenses for cost-effective access to the report.
13. Are there any additional resources or data provided in the Calcium Peroxide Industry report?
While the report offers comprehensive insights, it's advisable to review the specific contents or supplementary materials provided to ascertain if additional resources or data are available.
14. How can I stay updated on further developments or reports in the Calcium Peroxide Industry?
To stay informed about further developments, trends, and reports in the Calcium Peroxide Industry, consider subscribing to industry newsletters, following relevant companies and organizations, or regularly checking reputable industry news sources and publications.
Methodology
Step 1 - Identification of Relevant Samples Size from Population Database


Step 2 - Approaches for Defining Global Market Size (Value, Volume* & Price*)

Note*: In applicable scenarios
Step 3 - Data Sources
Primary Research
- Web Analytics
- Survey Reports
- Research Institute
- Latest Research Reports
- Opinion Leaders
Secondary Research
- Annual Reports
- White Paper
- Latest Press Release
- Industry Association
- Paid Database
- Investor Presentations

Step 4 - Data Triangulation
Involves using different sources of information in order to increase the validity of a study
These sources are likely to be stakeholders in a program - participants, other researchers, program staff, other community members, and so on.
Then we put all data in single framework & apply various statistical tools to find out the dynamic on the market.
During the analysis stage, feedback from the stakeholder groups would be compared to determine areas of agreement as well as areas of divergence


