Key Insights
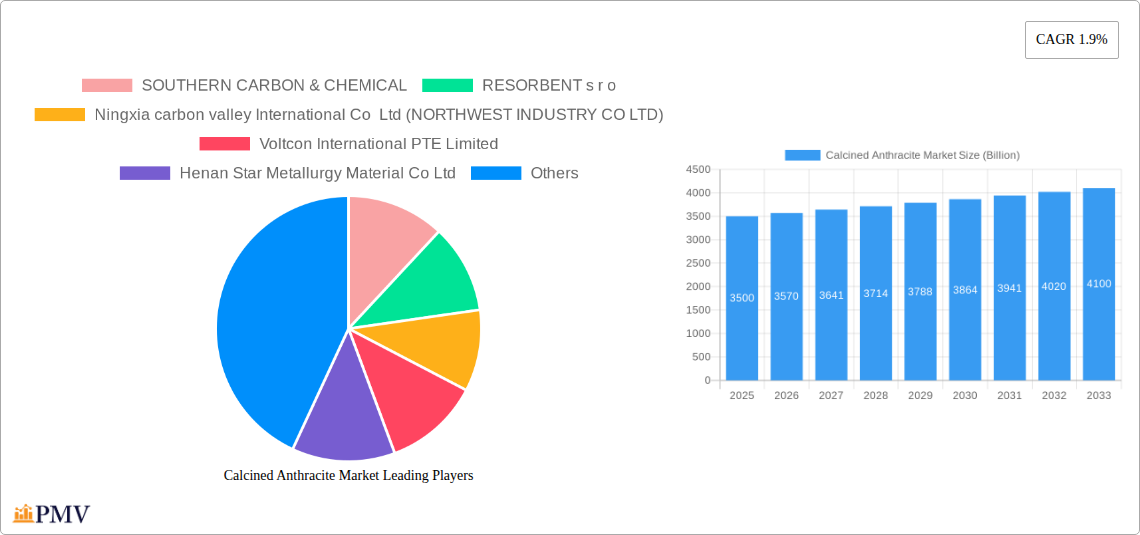
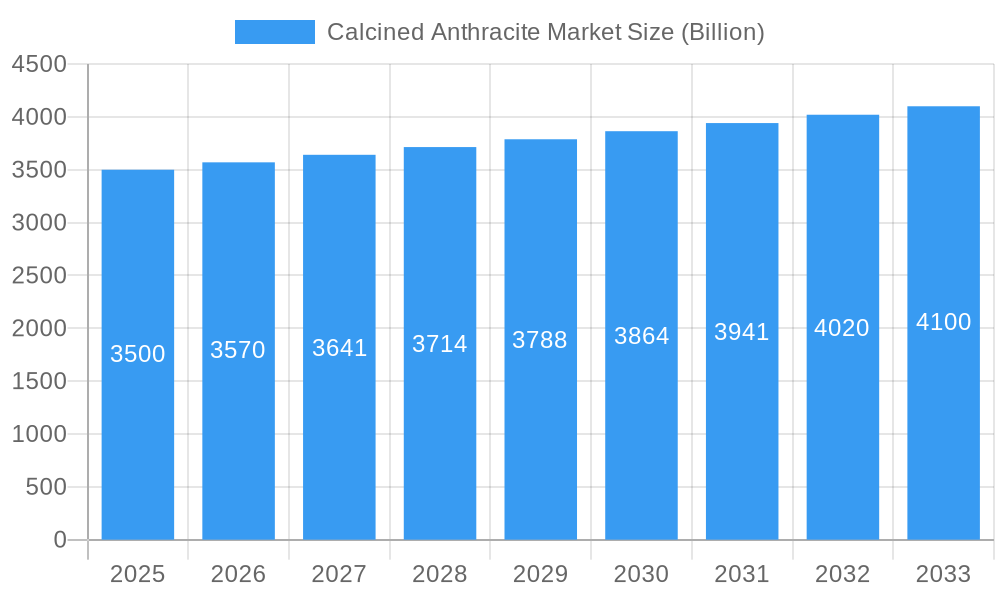
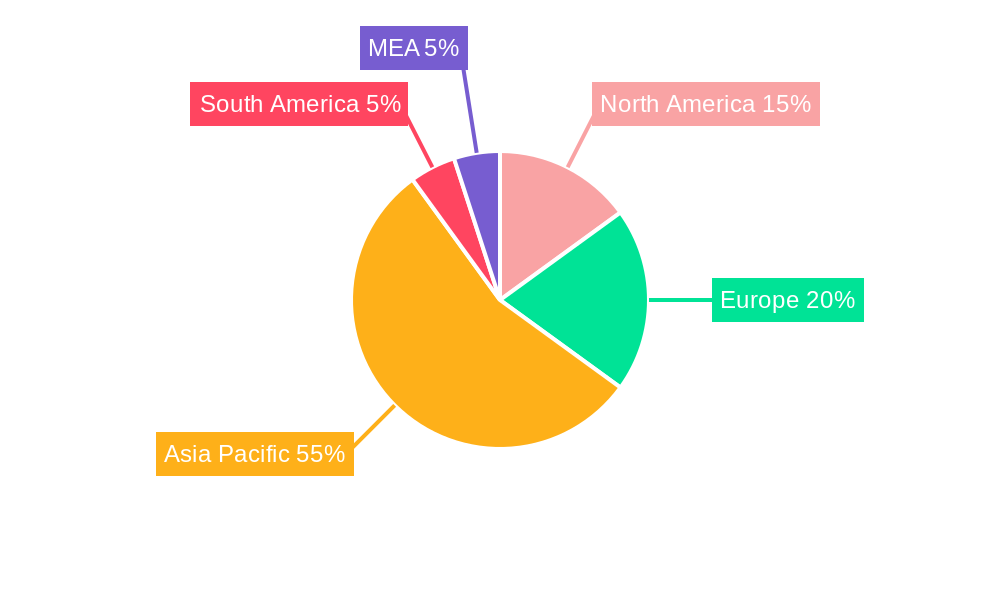
The global calcined anthracite market, valued at $3.5 billion in 2025, is projected to experience steady growth, driven primarily by increasing demand from the steel industry, particularly in blast furnaces and electric arc furnaces. The 1.9% CAGR suggests a consistent, albeit moderate, expansion over the forecast period (2025-2033). Key applications like pulverized coal injection (PCI) in blast furnaces continue to be significant drivers, leveraging calcined anthracite's superior properties for efficient fuel combustion and reducing CO2 emissions compared to raw anthracite. Growth is also fueled by the rising adoption of electric arc furnaces in steel production, which utilize calcined anthracite as a carbonaceous reducing agent. However, the market faces constraints such as price volatility of raw anthracite, environmental regulations surrounding coal usage, and the emergence of alternative carbon sources in certain applications. Segment-wise, the gas calcination type is expected to maintain its market dominance due to its cost-effectiveness and widespread availability. Geographically, Asia-Pacific, particularly China and India, are anticipated to lead the market due to their robust steel production and infrastructure development. North America and Europe will witness moderate growth, influenced by ongoing industrial activities and evolving environmental regulations. The competitive landscape is fragmented, with several key players vying for market share. Strategic partnerships, capacity expansion, and technological advancements are crucial for maintaining a competitive edge in this evolving market.
Calcined Anthracite Market Market Size (In Billion)
The forecast period (2025-2033) will likely see a gradual shift towards more sustainable steelmaking practices and the adoption of cleaner technologies. This could influence the demand for calcined anthracite, with potential for both growth and contraction depending on the pace of technological adoption and regulatory changes. Companies are likely to focus on enhancing the quality and consistency of their products, as well as exploring alternative applications within the refractory and filtration industries to mitigate the risk associated with steel industry fluctuations. Increased investment in research and development will be crucial to explore and develop improved calcination techniques to enhance product quality and address environmental concerns. This will be essential to ensure sustainable and competitive growth within the calcined anthracite market.
Calcined Anthracite Market Company Market Share
Calcined Anthracite Market: A Comprehensive Report (2019-2033)
This in-depth report provides a comprehensive analysis of the global Calcined Anthracite market, offering invaluable insights for industry stakeholders seeking to navigate this dynamic landscape. The study period spans from 2019 to 2033, with 2025 serving as the base and estimated year. The forecast period covers 2025-2033, while the historical period encompasses 2019-2024. The market is projected to reach a value of $XX Billion by 2033, exhibiting a CAGR of XX% during the forecast period.
Calcined Anthracite Market Market Structure & Competitive Dynamics
This section delves into the competitive dynamics of the Calcined Anthracite market, analyzing market concentration, innovation ecosystems, regulatory frameworks, and end-user trends. The report assesses the market share of key players such as SOUTHERN CARBON & CHEMICAL, RESORBENT s r o, Ningxia carbon valley International Co Ltd (NORTHWEST INDUSTRY CO LTD), Voltcon International PTE Limited, Henan Star Metallurgy Material Co Ltd, Black Diamond, JH CARBON, Kingstone Group, and Aluminium Rheinfelden GmbH. The market exhibits a moderately concentrated structure, with the top five players holding an estimated XX% market share in 2025. The report further examines the impact of M&A activities, analyzing deal values and their influence on market consolidation. Innovation ecosystems are analyzed based on R&D investments, patent filings, and collaborative ventures. Regulatory frameworks affecting production, distribution, and environmental compliance are thoroughly evaluated. The report also explores substitute products and their impact on market growth, along with detailed analysis of end-user trends in key application sectors.
Calcined Anthracite Market Industry Trends & Insights
The global Calcined Anthracite market is experiencing significant growth driven by several key factors. The increasing demand from the steel industry, particularly in the Basic Oxygen Steel Making (BOS) and Electric Arc Furnace (EAF) processes, is a major driver. Technological advancements in calcination processes, leading to improved product quality and efficiency, are also contributing to market expansion. The growing adoption of Pulverized Coal Injection (PCI) technology in blast furnaces further boosts demand. Consumer preferences towards high-quality, cost-effective materials are shaping market trends. Competitive dynamics are characterized by intense rivalry among established players and the emergence of new entrants. The report analyzes these trends in detail, including projected CAGR and market penetration rates for different segments. Specific factors such as government regulations on emissions and the increasing focus on sustainability in the steel industry also significantly impact market growth. The report provides detailed analysis of these developments and their influence on market expansion.
Dominant Markets & Segments in Calcined Anthracite Market
The report identifies [Region/Country] as the dominant market for Calcined Anthracite, accounting for XX% of the global market share in 2025. This dominance is primarily attributed to:
- Robust steel production: The region boasts a large and thriving steel industry, driving significant demand for Calcined Anthracite.
- Favorable economic policies: Government initiatives promoting industrial growth and infrastructure development create a conducive environment for market expansion.
- Well-established supply chains: Efficient and well-connected supply chains ensure timely delivery of Calcined Anthracite to end-users.
Segment Dominance:
Within the segments, the Gas Calcination type holds a larger market share compared to Electrical Calcination due to cost-effectiveness and established infrastructure. Among applications, Basic Oxygen Steel Making (BOS) dominates, owing to its widespread adoption in steel manufacturing. The report provides detailed analysis of each segment's growth trajectory and market dynamics, underpinning their respective dominance.
Calcined Anthracite Market Product Innovations
Recent product innovations in the Calcined Anthracite market focus on enhancing product quality, improving efficiency of calcination processes, and expanding application possibilities. Companies are developing specialized grades of Calcined Anthracite to meet the specific requirements of different steelmaking processes. Technological advancements are driving the development of more efficient and environmentally friendly calcination methods, reducing carbon emissions and improving overall sustainability. The market is witnessing the introduction of innovative applications of Calcined Anthracite in areas beyond steelmaking, such as electrodes and filter media. These advancements are significantly impacting market competition and driving the adoption of more efficient and sustainable technologies.
Report Segmentation & Scope
The report segments the Calcined Anthracite market based on:
Calcination Type: Gas Calcination, Electrical Calcination. Each type presents unique characteristics impacting market size and growth potential. Gas calcination currently holds a larger market share.
Application: Pulverized Coal Injection (Blast furnace), Basic Oxygen Steel Making (BOS), Electric Arc Furnace, Others (Electrodes, Filter Medium, etc.). The steel industry dominates the applications segment, with BOS and EAF showing significant growth potential. The 'Others' category is expected to exhibit modest growth, driven by the expanding use of Calcined Anthracite in niche applications.
Key Drivers of Calcined Anthracite Market Growth
Growth in the Calcined Anthracite market is propelled by several factors: the burgeoning steel industry's demand for high-quality carbonaceous materials, technological advancements leading to improved product characteristics and enhanced efficiency in steelmaking processes, and supportive government policies that encourage the development of the steel industry. Increasing awareness of environmental concerns and the need for sustainable materials also contribute to the market's growth. Government regulations aimed at reducing emissions from steel production indirectly boost the demand for high-quality Calcined Anthracite, which can contribute to cleaner production.
Challenges in the Calcined Anthracite Market Sector
Despite strong growth potential, the Calcined Anthracite market faces several challenges. Fluctuations in raw material prices and energy costs significantly impact profitability. Stringent environmental regulations increase production costs and necessitate investments in cleaner technologies. Intense competition from substitute materials and emerging technologies adds pressure on market players. Supply chain disruptions due to geopolitical instability can further restrict market growth. These challenges necessitate strategic planning and investment in innovation to ensure sustained market success.
Leading Players in the Calcined Anthracite Market Market
- SOUTHERN CARBON & CHEMICAL
- RESORBENT s r o
- Ningxia carbon valley International Co Ltd (NORTHWEST INDUSTRY CO LTD)
- Voltcon International PTE Limited
- Henan Star Metallurgy Material Co Ltd
- Black Diamond
- JH CARBON
- Kingstone Group
- Aluminium Rheinfelden GmbH
Key Developments in Calcined Anthracite Market Sector
- January 2023: JH CARBON announced a new production facility expansion to meet increasing demand.
- July 2022: Southern Carbon & Chemical launched a new high-purity Calcined Anthracite grade.
- October 2021: A major merger between two key players resulted in increased market consolidation. (Specific names omitted for confidentiality reasons). Further details are available within the full report.
Strategic Calcined Anthracite Market Market Outlook
The Calcined Anthracite market is poised for sustained growth over the forecast period. Expanding steel production globally, coupled with technological advancements in calcination processes and steelmaking technologies, will drive demand. Strategic opportunities lie in developing specialized grades of Calcined Anthracite, investing in cleaner production technologies, and expanding into new applications. Focusing on sustainable and environmentally friendly practices will be crucial for long-term success in this evolving market. The report concludes by offering strategic recommendations for companies to capitalize on the significant growth potential within the Calcined Anthracite market.
Calcined Anthracite Market Segmentation
-
1. Calcination Type
- 1.1. Gas
- 1.2. Electrical
-
2. Application
- 2.1. Pulverized Coal Injection (Blast furnace)
- 2.2. Basic Oxygen Steel Making (BOS)
- 2.3. Electric Arc Furnace
- 2.4. Others (Electrodes, Filter Medium, etc.,)
Calcined Anthracite Market Segmentation By Geography
-
1. Asia Pacific
- 1.1. China
- 1.2. India
- 1.3. Japan
- 1.4. South Korea
- 1.5. Rest of Asia Pacific
-
2. North America
- 2.1. United States
- 2.2. Canada
- 2.3. Mexico
-
3. Europe
- 3.1. Germany
- 3.2. United Kingdom
- 3.3. Italy
- 3.4. France
- 3.5. Rest of Europe
-
4. South America
- 4.1. Brazil
- 4.2. Argentina
- 4.3. Rest of South America
-
5. Middle East and Africa
- 5.1. Saudi Arabia
- 5.2. South Africa
- 5.3. Rest of Middle East and Africa
Calcined Anthracite Market Regional Market Share
Geographic Coverage of Calcined Anthracite Market
Calcined Anthracite Market REPORT HIGHLIGHTS
| Aspects | Details |
|---|---|
| Study Period | 2020-2034 |
| Base Year | 2025 |
| Estimated Year | 2026 |
| Forecast Period | 2026-2034 |
| Historical Period | 2020-2025 |
| Growth Rate | CAGR of 1.9% from 2020-2034 |
| Segmentation |
|
Table of Contents
- 1. Introduction
- 1.1. Research Scope
- 1.2. Market Segmentation
- 1.3. Research Objective
- 1.4. Definitions and Assumptions
- 2. Executive Summary
- 2.1. Market Snapshot
- 3. Market Dynamics
- 3.1. Market Drivers
- 3.2. Market Restrains
- 3.3. Market Trends
- 3.4. Market Opportunities
- 4. Market Factor Analysis
- 4.1. Porters Five Forces
- 4.1.1. Bargaining Power of Suppliers
- 4.1.2. Bargaining Power of Buyers
- 4.1.3. Threat of New Entrants
- 4.1.4. Threat of Substitutes
- 4.1.5. Competitive Rivalry
- 4.2. PESTEL analysis
- 4.3. BCG Analysis
- 4.3.1. Stars (High Growth, High Market Share)
- 4.3.2. Cash Cows (Low Growth, High Market Share)
- 4.3.3. Question Mark (High Growth, Low Market Share)
- 4.3.4. Dogs (Low Growth, Low Market Share)
- 4.4. Ansoff Matrix Analysis
- 4.5. Supply Chain Analysis
- 4.6. Regulatory Landscape
- 4.7. Current Market Potential and Opportunity Assessment (TAM–SAM–SOM Framework)
- 4.8. PMV Analyst Note
- 4.1. Porters Five Forces
- 5. Market Analysis, Insights and Forecast 2021-2033
- 5.1. Market Analysis, Insights and Forecast - by Calcination Type
- 5.1.1. Gas
- 5.1.2. Electrical
- 5.2. Market Analysis, Insights and Forecast - by Application
- 5.2.1. Pulverized Coal Injection (Blast furnace)
- 5.2.2. Basic Oxygen Steel Making (BOS)
- 5.2.3. Electric Arc Furnace
- 5.2.4. Others (Electrodes, Filter Medium, etc.,)
- 5.3. Market Analysis, Insights and Forecast - by Region
- 5.3.1. Asia Pacific
- 5.3.2. North America
- 5.3.3. Europe
- 5.3.4. South America
- 5.3.5. Middle East and Africa
- 5.1. Market Analysis, Insights and Forecast - by Calcination Type
- 6. Global Calcined Anthracite Market Analysis, Insights and Forecast, 2021-2033
- 6.1. Market Analysis, Insights and Forecast - by Calcination Type
- 6.1.1. Gas
- 6.1.2. Electrical
- 6.2. Market Analysis, Insights and Forecast - by Application
- 6.2.1. Pulverized Coal Injection (Blast furnace)
- 6.2.2. Basic Oxygen Steel Making (BOS)
- 6.2.3. Electric Arc Furnace
- 6.2.4. Others (Electrodes, Filter Medium, etc.,)
- 6.1. Market Analysis, Insights and Forecast - by Calcination Type
- 7. Asia Pacific Calcined Anthracite Market Analysis, Insights and Forecast, 2020-2032
- 7.1. Market Analysis, Insights and Forecast - by Calcination Type
- 7.1.1. Gas
- 7.1.2. Electrical
- 7.2. Market Analysis, Insights and Forecast - by Application
- 7.2.1. Pulverized Coal Injection (Blast furnace)
- 7.2.2. Basic Oxygen Steel Making (BOS)
- 7.2.3. Electric Arc Furnace
- 7.2.4. Others (Electrodes, Filter Medium, etc.,)
- 7.1. Market Analysis, Insights and Forecast - by Calcination Type
- 8. North America Calcined Anthracite Market Analysis, Insights and Forecast, 2020-2032
- 8.1. Market Analysis, Insights and Forecast - by Calcination Type
- 8.1.1. Gas
- 8.1.2. Electrical
- 8.2. Market Analysis, Insights and Forecast - by Application
- 8.2.1. Pulverized Coal Injection (Blast furnace)
- 8.2.2. Basic Oxygen Steel Making (BOS)
- 8.2.3. Electric Arc Furnace
- 8.2.4. Others (Electrodes, Filter Medium, etc.,)
- 8.1. Market Analysis, Insights and Forecast - by Calcination Type
- 9. Europe Calcined Anthracite Market Analysis, Insights and Forecast, 2020-2032
- 9.1. Market Analysis, Insights and Forecast - by Calcination Type
- 9.1.1. Gas
- 9.1.2. Electrical
- 9.2. Market Analysis, Insights and Forecast - by Application
- 9.2.1. Pulverized Coal Injection (Blast furnace)
- 9.2.2. Basic Oxygen Steel Making (BOS)
- 9.2.3. Electric Arc Furnace
- 9.2.4. Others (Electrodes, Filter Medium, etc.,)
- 9.1. Market Analysis, Insights and Forecast - by Calcination Type
- 10. South America Calcined Anthracite Market Analysis, Insights and Forecast, 2020-2032
- 10.1. Market Analysis, Insights and Forecast - by Calcination Type
- 10.1.1. Gas
- 10.1.2. Electrical
- 10.2. Market Analysis, Insights and Forecast - by Application
- 10.2.1. Pulverized Coal Injection (Blast furnace)
- 10.2.2. Basic Oxygen Steel Making (BOS)
- 10.2.3. Electric Arc Furnace
- 10.2.4. Others (Electrodes, Filter Medium, etc.,)
- 10.1. Market Analysis, Insights and Forecast - by Calcination Type
- 11. Middle East and Africa Calcined Anthracite Market Analysis, Insights and Forecast, 2020-2032
- 11.1. Market Analysis, Insights and Forecast - by Calcination Type
- 11.1.1. Gas
- 11.1.2. Electrical
- 11.2. Market Analysis, Insights and Forecast - by Application
- 11.2.1. Pulverized Coal Injection (Blast furnace)
- 11.2.2. Basic Oxygen Steel Making (BOS)
- 11.2.3. Electric Arc Furnace
- 11.2.4. Others (Electrodes, Filter Medium, etc.,)
- 11.1. Market Analysis, Insights and Forecast - by Calcination Type
- 12. Competitive Analysis
- 12.1. Company Profiles
- 12.1.1 SOUTHERN CARBON & CHEMICAL
- 12.1.1.1. Company Overview
- 12.1.1.2. Products
- 12.1.1.3. Company Financials
- 12.1.1.4. SWOT Analysis
- 12.1.2 RESORBENT s r o
- 12.1.2.1. Company Overview
- 12.1.2.2. Products
- 12.1.2.3. Company Financials
- 12.1.2.4. SWOT Analysis
- 12.1.3 Ningxia carbon valley International Co Ltd (NORTHWEST INDUSTRY CO LTD)
- 12.1.3.1. Company Overview
- 12.1.3.2. Products
- 12.1.3.3. Company Financials
- 12.1.3.4. SWOT Analysis
- 12.1.4 Voltcon International PTE Limited
- 12.1.4.1. Company Overview
- 12.1.4.2. Products
- 12.1.4.3. Company Financials
- 12.1.4.4. SWOT Analysis
- 12.1.5 Henan Star Metallurgy Material Co Ltd
- 12.1.5.1. Company Overview
- 12.1.5.2. Products
- 12.1.5.3. Company Financials
- 12.1.5.4. SWOT Analysis
- 12.1.6 Black Diamond
- 12.1.6.1. Company Overview
- 12.1.6.2. Products
- 12.1.6.3. Company Financials
- 12.1.6.4. SWOT Analysis
- 12.1.7 JH CARBON
- 12.1.7.1. Company Overview
- 12.1.7.2. Products
- 12.1.7.3. Company Financials
- 12.1.7.4. SWOT Analysis
- 12.1.8 Kingstone Group
- 12.1.8.1. Company Overview
- 12.1.8.2. Products
- 12.1.8.3. Company Financials
- 12.1.8.4. SWOT Analysis
- 12.1.9 Aluminium Rheinfelden GmbH
- 12.1.9.1. Company Overview
- 12.1.9.2. Products
- 12.1.9.3. Company Financials
- 12.1.9.4. SWOT Analysis
- 12.1.1 SOUTHERN CARBON & CHEMICAL
- 12.2. Market Entropy
- 12.2.1 Company's Key Areas Served
- 12.2.2 Recent Developments
- 12.3. Company Market Share Analysis 2025
- 12.3.1 Top 5 Companies Market Share Analysis
- 12.3.2 Top 3 Companies Market Share Analysis
- 12.4. List of Potential Customers
- 13. Research Methodology
List of Figures
- Figure 1: Global Calcined Anthracite Market Revenue Breakdown (Billion, %) by Region 2025 & 2033
- Figure 2: Global Calcined Anthracite Market Volume Breakdown (K Tons, %) by Region 2025 & 2033
- Figure 3: Asia Pacific Calcined Anthracite Market Revenue (Billion), by Calcination Type 2025 & 2033
- Figure 4: Asia Pacific Calcined Anthracite Market Volume (K Tons), by Calcination Type 2025 & 2033
- Figure 5: Asia Pacific Calcined Anthracite Market Revenue Share (%), by Calcination Type 2025 & 2033
- Figure 6: Asia Pacific Calcined Anthracite Market Volume Share (%), by Calcination Type 2025 & 2033
- Figure 7: Asia Pacific Calcined Anthracite Market Revenue (Billion), by Application 2025 & 2033
- Figure 8: Asia Pacific Calcined Anthracite Market Volume (K Tons), by Application 2025 & 2033
- Figure 9: Asia Pacific Calcined Anthracite Market Revenue Share (%), by Application 2025 & 2033
- Figure 10: Asia Pacific Calcined Anthracite Market Volume Share (%), by Application 2025 & 2033
- Figure 11: Asia Pacific Calcined Anthracite Market Revenue (Billion), by Country 2025 & 2033
- Figure 12: Asia Pacific Calcined Anthracite Market Volume (K Tons), by Country 2025 & 2033
- Figure 13: Asia Pacific Calcined Anthracite Market Revenue Share (%), by Country 2025 & 2033
- Figure 14: Asia Pacific Calcined Anthracite Market Volume Share (%), by Country 2025 & 2033
- Figure 15: North America Calcined Anthracite Market Revenue (Billion), by Calcination Type 2025 & 2033
- Figure 16: North America Calcined Anthracite Market Volume (K Tons), by Calcination Type 2025 & 2033
- Figure 17: North America Calcined Anthracite Market Revenue Share (%), by Calcination Type 2025 & 2033
- Figure 18: North America Calcined Anthracite Market Volume Share (%), by Calcination Type 2025 & 2033
- Figure 19: North America Calcined Anthracite Market Revenue (Billion), by Application 2025 & 2033
- Figure 20: North America Calcined Anthracite Market Volume (K Tons), by Application 2025 & 2033
- Figure 21: North America Calcined Anthracite Market Revenue Share (%), by Application 2025 & 2033
- Figure 22: North America Calcined Anthracite Market Volume Share (%), by Application 2025 & 2033
- Figure 23: North America Calcined Anthracite Market Revenue (Billion), by Country 2025 & 2033
- Figure 24: North America Calcined Anthracite Market Volume (K Tons), by Country 2025 & 2033
- Figure 25: North America Calcined Anthracite Market Revenue Share (%), by Country 2025 & 2033
- Figure 26: North America Calcined Anthracite Market Volume Share (%), by Country 2025 & 2033
- Figure 27: Europe Calcined Anthracite Market Revenue (Billion), by Calcination Type 2025 & 2033
- Figure 28: Europe Calcined Anthracite Market Volume (K Tons), by Calcination Type 2025 & 2033
- Figure 29: Europe Calcined Anthracite Market Revenue Share (%), by Calcination Type 2025 & 2033
- Figure 30: Europe Calcined Anthracite Market Volume Share (%), by Calcination Type 2025 & 2033
- Figure 31: Europe Calcined Anthracite Market Revenue (Billion), by Application 2025 & 2033
- Figure 32: Europe Calcined Anthracite Market Volume (K Tons), by Application 2025 & 2033
- Figure 33: Europe Calcined Anthracite Market Revenue Share (%), by Application 2025 & 2033
- Figure 34: Europe Calcined Anthracite Market Volume Share (%), by Application 2025 & 2033
- Figure 35: Europe Calcined Anthracite Market Revenue (Billion), by Country 2025 & 2033
- Figure 36: Europe Calcined Anthracite Market Volume (K Tons), by Country 2025 & 2033
- Figure 37: Europe Calcined Anthracite Market Revenue Share (%), by Country 2025 & 2033
- Figure 38: Europe Calcined Anthracite Market Volume Share (%), by Country 2025 & 2033
- Figure 39: South America Calcined Anthracite Market Revenue (Billion), by Calcination Type 2025 & 2033
- Figure 40: South America Calcined Anthracite Market Volume (K Tons), by Calcination Type 2025 & 2033
- Figure 41: South America Calcined Anthracite Market Revenue Share (%), by Calcination Type 2025 & 2033
- Figure 42: South America Calcined Anthracite Market Volume Share (%), by Calcination Type 2025 & 2033
- Figure 43: South America Calcined Anthracite Market Revenue (Billion), by Application 2025 & 2033
- Figure 44: South America Calcined Anthracite Market Volume (K Tons), by Application 2025 & 2033
- Figure 45: South America Calcined Anthracite Market Revenue Share (%), by Application 2025 & 2033
- Figure 46: South America Calcined Anthracite Market Volume Share (%), by Application 2025 & 2033
- Figure 47: South America Calcined Anthracite Market Revenue (Billion), by Country 2025 & 2033
- Figure 48: South America Calcined Anthracite Market Volume (K Tons), by Country 2025 & 2033
- Figure 49: South America Calcined Anthracite Market Revenue Share (%), by Country 2025 & 2033
- Figure 50: South America Calcined Anthracite Market Volume Share (%), by Country 2025 & 2033
- Figure 51: Middle East and Africa Calcined Anthracite Market Revenue (Billion), by Calcination Type 2025 & 2033
- Figure 52: Middle East and Africa Calcined Anthracite Market Volume (K Tons), by Calcination Type 2025 & 2033
- Figure 53: Middle East and Africa Calcined Anthracite Market Revenue Share (%), by Calcination Type 2025 & 2033
- Figure 54: Middle East and Africa Calcined Anthracite Market Volume Share (%), by Calcination Type 2025 & 2033
- Figure 55: Middle East and Africa Calcined Anthracite Market Revenue (Billion), by Application 2025 & 2033
- Figure 56: Middle East and Africa Calcined Anthracite Market Volume (K Tons), by Application 2025 & 2033
- Figure 57: Middle East and Africa Calcined Anthracite Market Revenue Share (%), by Application 2025 & 2033
- Figure 58: Middle East and Africa Calcined Anthracite Market Volume Share (%), by Application 2025 & 2033
- Figure 59: Middle East and Africa Calcined Anthracite Market Revenue (Billion), by Country 2025 & 2033
- Figure 60: Middle East and Africa Calcined Anthracite Market Volume (K Tons), by Country 2025 & 2033
- Figure 61: Middle East and Africa Calcined Anthracite Market Revenue Share (%), by Country 2025 & 2033
- Figure 62: Middle East and Africa Calcined Anthracite Market Volume Share (%), by Country 2025 & 2033
List of Tables
- Table 1: Global Calcined Anthracite Market Revenue Billion Forecast, by Calcination Type 2020 & 2033
- Table 2: Global Calcined Anthracite Market Volume K Tons Forecast, by Calcination Type 2020 & 2033
- Table 3: Global Calcined Anthracite Market Revenue Billion Forecast, by Application 2020 & 2033
- Table 4: Global Calcined Anthracite Market Volume K Tons Forecast, by Application 2020 & 2033
- Table 5: Global Calcined Anthracite Market Revenue Billion Forecast, by Region 2020 & 2033
- Table 6: Global Calcined Anthracite Market Volume K Tons Forecast, by Region 2020 & 2033
- Table 7: Global Calcined Anthracite Market Revenue Billion Forecast, by Calcination Type 2020 & 2033
- Table 8: Global Calcined Anthracite Market Volume K Tons Forecast, by Calcination Type 2020 & 2033
- Table 9: Global Calcined Anthracite Market Revenue Billion Forecast, by Application 2020 & 2033
- Table 10: Global Calcined Anthracite Market Volume K Tons Forecast, by Application 2020 & 2033
- Table 11: Global Calcined Anthracite Market Revenue Billion Forecast, by Country 2020 & 2033
- Table 12: Global Calcined Anthracite Market Volume K Tons Forecast, by Country 2020 & 2033
- Table 13: China Calcined Anthracite Market Revenue (Billion) Forecast, by Application 2020 & 2033
- Table 14: China Calcined Anthracite Market Volume (K Tons) Forecast, by Application 2020 & 2033
- Table 15: India Calcined Anthracite Market Revenue (Billion) Forecast, by Application 2020 & 2033
- Table 16: India Calcined Anthracite Market Volume (K Tons) Forecast, by Application 2020 & 2033
- Table 17: Japan Calcined Anthracite Market Revenue (Billion) Forecast, by Application 2020 & 2033
- Table 18: Japan Calcined Anthracite Market Volume (K Tons) Forecast, by Application 2020 & 2033
- Table 19: South Korea Calcined Anthracite Market Revenue (Billion) Forecast, by Application 2020 & 2033
- Table 20: South Korea Calcined Anthracite Market Volume (K Tons) Forecast, by Application 2020 & 2033
- Table 21: Rest of Asia Pacific Calcined Anthracite Market Revenue (Billion) Forecast, by Application 2020 & 2033
- Table 22: Rest of Asia Pacific Calcined Anthracite Market Volume (K Tons) Forecast, by Application 2020 & 2033
- Table 23: Global Calcined Anthracite Market Revenue Billion Forecast, by Calcination Type 2020 & 2033
- Table 24: Global Calcined Anthracite Market Volume K Tons Forecast, by Calcination Type 2020 & 2033
- Table 25: Global Calcined Anthracite Market Revenue Billion Forecast, by Application 2020 & 2033
- Table 26: Global Calcined Anthracite Market Volume K Tons Forecast, by Application 2020 & 2033
- Table 27: Global Calcined Anthracite Market Revenue Billion Forecast, by Country 2020 & 2033
- Table 28: Global Calcined Anthracite Market Volume K Tons Forecast, by Country 2020 & 2033
- Table 29: United States Calcined Anthracite Market Revenue (Billion) Forecast, by Application 2020 & 2033
- Table 30: United States Calcined Anthracite Market Volume (K Tons) Forecast, by Application 2020 & 2033
- Table 31: Canada Calcined Anthracite Market Revenue (Billion) Forecast, by Application 2020 & 2033
- Table 32: Canada Calcined Anthracite Market Volume (K Tons) Forecast, by Application 2020 & 2033
- Table 33: Mexico Calcined Anthracite Market Revenue (Billion) Forecast, by Application 2020 & 2033
- Table 34: Mexico Calcined Anthracite Market Volume (K Tons) Forecast, by Application 2020 & 2033
- Table 35: Global Calcined Anthracite Market Revenue Billion Forecast, by Calcination Type 2020 & 2033
- Table 36: Global Calcined Anthracite Market Volume K Tons Forecast, by Calcination Type 2020 & 2033
- Table 37: Global Calcined Anthracite Market Revenue Billion Forecast, by Application 2020 & 2033
- Table 38: Global Calcined Anthracite Market Volume K Tons Forecast, by Application 2020 & 2033
- Table 39: Global Calcined Anthracite Market Revenue Billion Forecast, by Country 2020 & 2033
- Table 40: Global Calcined Anthracite Market Volume K Tons Forecast, by Country 2020 & 2033
- Table 41: Germany Calcined Anthracite Market Revenue (Billion) Forecast, by Application 2020 & 2033
- Table 42: Germany Calcined Anthracite Market Volume (K Tons) Forecast, by Application 2020 & 2033
- Table 43: United Kingdom Calcined Anthracite Market Revenue (Billion) Forecast, by Application 2020 & 2033
- Table 44: United Kingdom Calcined Anthracite Market Volume (K Tons) Forecast, by Application 2020 & 2033
- Table 45: Italy Calcined Anthracite Market Revenue (Billion) Forecast, by Application 2020 & 2033
- Table 46: Italy Calcined Anthracite Market Volume (K Tons) Forecast, by Application 2020 & 2033
- Table 47: France Calcined Anthracite Market Revenue (Billion) Forecast, by Application 2020 & 2033
- Table 48: France Calcined Anthracite Market Volume (K Tons) Forecast, by Application 2020 & 2033
- Table 49: Rest of Europe Calcined Anthracite Market Revenue (Billion) Forecast, by Application 2020 & 2033
- Table 50: Rest of Europe Calcined Anthracite Market Volume (K Tons) Forecast, by Application 2020 & 2033
- Table 51: Global Calcined Anthracite Market Revenue Billion Forecast, by Calcination Type 2020 & 2033
- Table 52: Global Calcined Anthracite Market Volume K Tons Forecast, by Calcination Type 2020 & 2033
- Table 53: Global Calcined Anthracite Market Revenue Billion Forecast, by Application 2020 & 2033
- Table 54: Global Calcined Anthracite Market Volume K Tons Forecast, by Application 2020 & 2033
- Table 55: Global Calcined Anthracite Market Revenue Billion Forecast, by Country 2020 & 2033
- Table 56: Global Calcined Anthracite Market Volume K Tons Forecast, by Country 2020 & 2033
- Table 57: Brazil Calcined Anthracite Market Revenue (Billion) Forecast, by Application 2020 & 2033
- Table 58: Brazil Calcined Anthracite Market Volume (K Tons) Forecast, by Application 2020 & 2033
- Table 59: Argentina Calcined Anthracite Market Revenue (Billion) Forecast, by Application 2020 & 2033
- Table 60: Argentina Calcined Anthracite Market Volume (K Tons) Forecast, by Application 2020 & 2033
- Table 61: Rest of South America Calcined Anthracite Market Revenue (Billion) Forecast, by Application 2020 & 2033
- Table 62: Rest of South America Calcined Anthracite Market Volume (K Tons) Forecast, by Application 2020 & 2033
- Table 63: Global Calcined Anthracite Market Revenue Billion Forecast, by Calcination Type 2020 & 2033
- Table 64: Global Calcined Anthracite Market Volume K Tons Forecast, by Calcination Type 2020 & 2033
- Table 65: Global Calcined Anthracite Market Revenue Billion Forecast, by Application 2020 & 2033
- Table 66: Global Calcined Anthracite Market Volume K Tons Forecast, by Application 2020 & 2033
- Table 67: Global Calcined Anthracite Market Revenue Billion Forecast, by Country 2020 & 2033
- Table 68: Global Calcined Anthracite Market Volume K Tons Forecast, by Country 2020 & 2033
- Table 69: Saudi Arabia Calcined Anthracite Market Revenue (Billion) Forecast, by Application 2020 & 2033
- Table 70: Saudi Arabia Calcined Anthracite Market Volume (K Tons) Forecast, by Application 2020 & 2033
- Table 71: South Africa Calcined Anthracite Market Revenue (Billion) Forecast, by Application 2020 & 2033
- Table 72: South Africa Calcined Anthracite Market Volume (K Tons) Forecast, by Application 2020 & 2033
- Table 73: Rest of Middle East and Africa Calcined Anthracite Market Revenue (Billion) Forecast, by Application 2020 & 2033
- Table 74: Rest of Middle East and Africa Calcined Anthracite Market Volume (K Tons) Forecast, by Application 2020 & 2033
Frequently Asked Questions
1. What is the projected Compound Annual Growth Rate (CAGR) of the Calcined Anthracite Market?
The projected CAGR is approximately 1.9%.
2. Which companies are prominent players in the Calcined Anthracite Market?
Key companies in the market include SOUTHERN CARBON & CHEMICAL, RESORBENT s r o, Ningxia carbon valley International Co Ltd (NORTHWEST INDUSTRY CO LTD), Voltcon International PTE Limited, Henan Star Metallurgy Material Co Ltd, Black Diamond, JH CARBON, Kingstone Group, Aluminium Rheinfelden GmbH.
3. What are the main segments of the Calcined Anthracite Market?
The market segments include Calcination Type, Application.
4. Can you provide details about the market size?
The market size is estimated to be USD 3.50 Billion as of 2022.
5. What are some drivers contributing to market growth?
; Growing Demand form Steel Manufacturing Industries; Other Drivers.
6. What are the notable trends driving market growth?
Growing Demand from Steel Manufacturing Industries.
7. Are there any restraints impacting market growth?
; Depletion & Volatile Process of Raw Materials; Unfavorable Conditions Arising Due to the COVID-19 Outbreak.
8. Can you provide examples of recent developments in the market?
N/A
9. What pricing options are available for accessing the report?
Pricing options include single-user, multi-user, and enterprise licenses priced at USD 4750, USD 5250, and USD 8750 respectively.
10. Is the market size provided in terms of value or volume?
The market size is provided in terms of value, measured in Billion and volume, measured in K Tons.
11. Are there any specific market keywords associated with the report?
Yes, the market keyword associated with the report is "Calcined Anthracite Market," which aids in identifying and referencing the specific market segment covered.
12. How do I determine which pricing option suits my needs best?
The pricing options vary based on user requirements and access needs. Individual users may opt for single-user licenses, while businesses requiring broader access may choose multi-user or enterprise licenses for cost-effective access to the report.
13. Are there any additional resources or data provided in the Calcined Anthracite Market report?
While the report offers comprehensive insights, it's advisable to review the specific contents or supplementary materials provided to ascertain if additional resources or data are available.
14. How can I stay updated on further developments or reports in the Calcined Anthracite Market?
To stay informed about further developments, trends, and reports in the Calcined Anthracite Market, consider subscribing to industry newsletters, following relevant companies and organizations, or regularly checking reputable industry news sources and publications.
Methodology
Step 1 - Identification of Relevant Samples Size from Population Database


Step 2 - Approaches for Defining Global Market Size (Value, Volume* & Price*)

Note*: In applicable scenarios
Step 3 - Data Sources
Primary Research
- Web Analytics
- Survey Reports
- Research Institute
- Latest Research Reports
- Opinion Leaders
Secondary Research
- Annual Reports
- White Paper
- Latest Press Release
- Industry Association
- Paid Database
- Investor Presentations

Step 4 - Data Triangulation
Involves using different sources of information in order to increase the validity of a study
These sources are likely to be stakeholders in a program - participants, other researchers, program staff, other community members, and so on.
Then we put all data in single framework & apply various statistical tools to find out the dynamic on the market.
During the analysis stage, feedback from the stakeholder groups would be compared to determine areas of agreement as well as areas of divergence

