

Key Insights
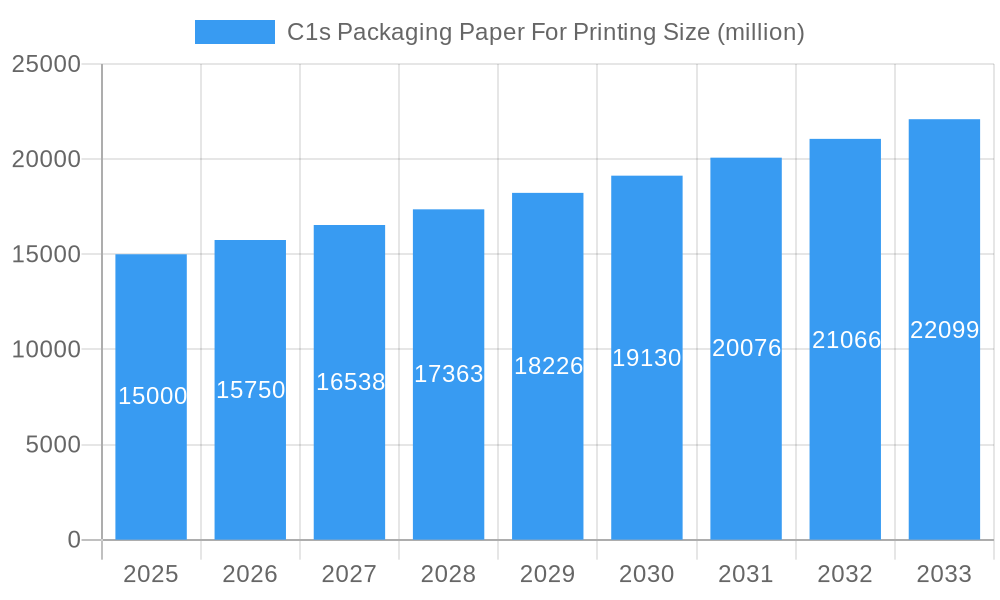
The C1S packaging paper for printing market is experiencing robust growth, driven by the expanding e-commerce sector and the increasing demand for high-quality printed packaging. The market's value, estimated at $15 billion in 2025, is projected to witness a Compound Annual Growth Rate (CAGR) of 5% from 2025 to 2033, reaching approximately $23 billion by 2033. This growth is fueled by several key factors: the rising preference for aesthetically pleasing and durable packaging to enhance brand appeal; the increasing adoption of sustainable and eco-friendly packaging materials; and technological advancements in printing techniques, leading to improved print quality and efficiency. Key players like WestRock, Sappi North America, and Nippon Paper Group are significantly shaping the market through innovation and expansion, while regional variations in growth rates are expected, with North America and Europe maintaining substantial market shares due to established infrastructure and consumer demand.
C1s Packaging Paper For Printing Market Size (In Billion)
However, the market also faces challenges, including fluctuations in raw material prices (primarily pulp), stringent environmental regulations impacting manufacturing processes, and increasing competition from alternative packaging materials like corrugated cardboard and plastic. Despite these restraints, the market's long-term outlook remains positive, driven by ongoing innovations in paper production, increasing focus on sustainable packaging solutions, and the persistent growth of the global e-commerce industry which necessitates large volumes of high-quality printed packaging materials. The segmentation of the market by paper grade, printing technique, and end-use application will further define opportunities for targeted market penetration and product diversification.
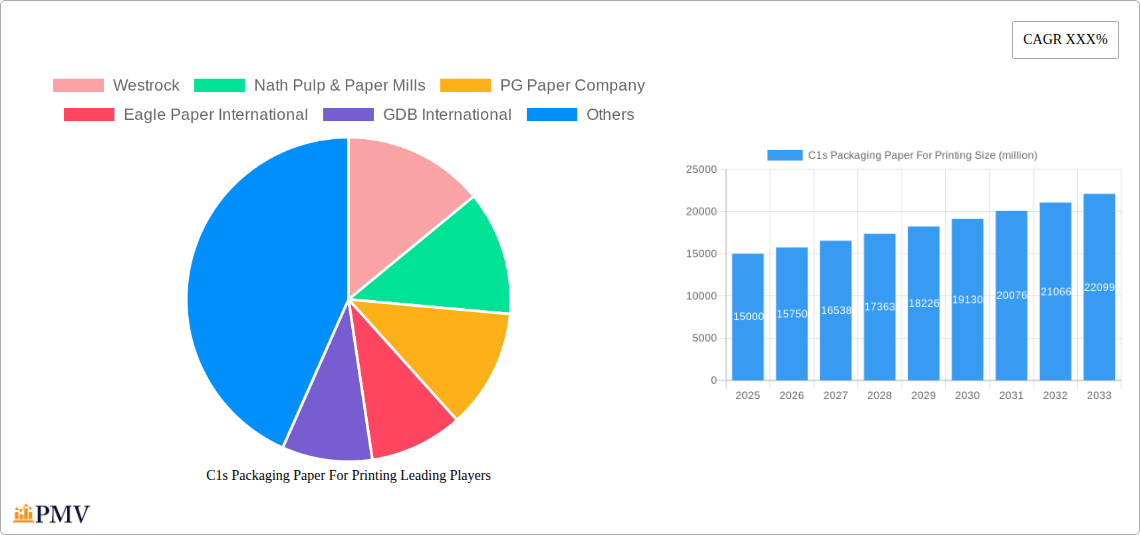
C1s Packaging Paper For Printing Company Market Share
C1s Packaging Paper For Printing Market Report: 2019-2033
This comprehensive report provides a detailed analysis of the global C1s Packaging Paper for Printing market, offering invaluable insights for businesses seeking to navigate this dynamic industry. The report covers the period 2019-2033, with a focus on the forecast period 2025-2033 and a base year of 2025. Millions of dollars are used for all market value estimations. The report features detailed analysis of market structure, competitive dynamics, industry trends, leading players, and future growth projections.
C1s Packaging Paper For Printing Market Structure & Competitive Dynamics
The global C1s Packaging Paper for Printing market exhibits a moderately consolidated structure, with several key players holding significant market share. The market is characterized by intense competition, driven by factors such as product innovation, pricing strategies, and geographic expansion. The top ten players, including Westrock, Nath Pulp & Paper Mills, PG Paper Company, Eagle Paper International, GDB International, MKD International, Feldmuehle, Appleton Coated, Verso, and Sappi North America, collectively hold an estimated xx million market share. Innovation ecosystems are crucial, with companies investing heavily in R&D to develop sustainable and high-performance papers. Regulatory frameworks concerning environmental sustainability and packaging waste management significantly impact market dynamics. The increasing demand for eco-friendly packaging solutions presents both opportunities and challenges. Product substitutes, such as plastic films and digital printing solutions, pose competitive threats. End-user trends toward sustainable and customized packaging influence market demand. M&A activities have been relatively frequent, with estimated deal values totaling xx million in the past five years, primarily driven by consolidation and expansion strategies.
- Market Concentration: Moderately consolidated, with top 10 players holding xx million market share.
- Innovation Ecosystems: Strong R&D investments driving sustainable and high-performance paper development.
- Regulatory Frameworks: Environmental regulations significantly influence market dynamics.
- Product Substitutes: Plastic films and digital printing pose competitive threats.
- End-User Trends: Growing demand for sustainable and customized packaging.
- M&A Activities: Significant deal activity with estimated values totaling xx million over the past five years.
C1s Packaging Paper For Printing Industry Trends & Insights
The C1s Packaging Paper for Printing market is experiencing robust growth, driven by the expanding packaging industry and increasing demand for high-quality printed materials. The market's Compound Annual Growth Rate (CAGR) during the forecast period (2025-2033) is projected to be xx%. Technological advancements, such as improved printing technologies and the development of sustainable paper production processes, are significant growth drivers. Consumer preferences for aesthetically pleasing and environmentally friendly packaging significantly influence market demand. Market penetration of C1s packaging paper in various end-use segments, including food and beverage, cosmetics, and pharmaceuticals, is increasing steadily. Competitive dynamics, marked by product differentiation, pricing strategies, and geographic expansion, shape market trends.
Dominant Markets & Segments in C1s Packaging Paper For Printing
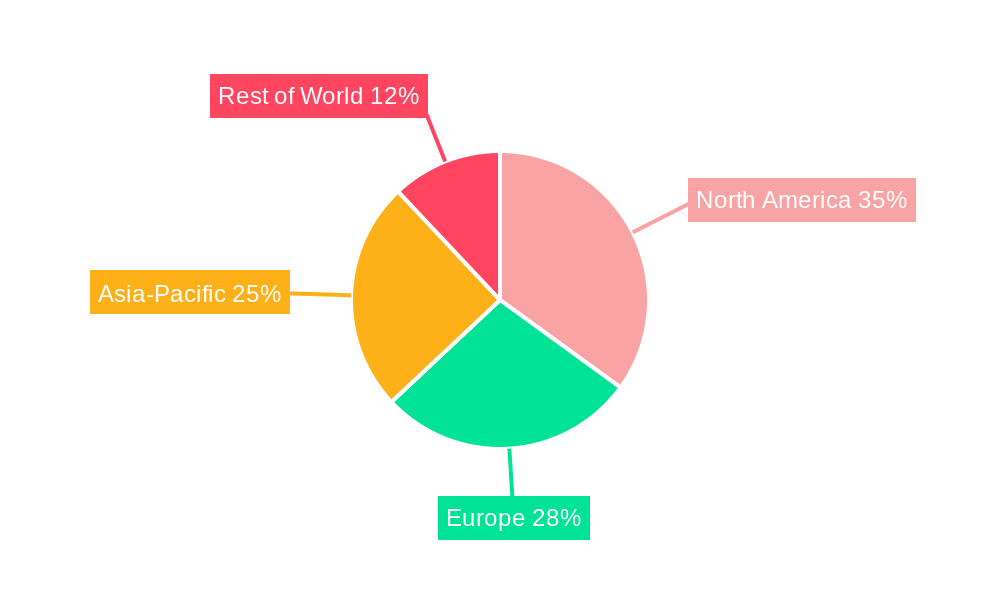
The North American region currently dominates the C1s Packaging Paper for Printing market, accounting for approximately xx million in market value in 2025. This dominance stems from factors including:
- Strong Packaging Industry: A large and well-established packaging industry drives high demand.
- Developed Infrastructure: Efficient logistics and distribution networks support market growth.
- Favorable Economic Conditions: A strong economy fosters high consumption levels.
- Technological Advancements: High levels of R&D and adoption of innovative printing technologies.
The European and Asian markets are also significant, exhibiting strong growth potential due to increasing consumer spending and industrial development. Further segmentation within the market includes different paper grades, coating types, and end-use applications, each exhibiting unique growth trajectories based on specific market drivers.
C1s Packaging Paper For Printing Product Innovations
Recent innovations in C1s packaging paper for printing focus on enhancing printability, improving sustainability, and providing superior performance. This includes the development of papers with improved surface smoothness, enhanced opacity, and greater resistance to moisture and grease. Technological trends highlight the increasing adoption of bio-based coatings and recycled fiber content to meet growing environmental concerns. These innovations enhance the market fit by addressing the needs of brand owners seeking high-quality, sustainable packaging solutions.
Report Segmentation & Scope
The report segments the C1s Packaging Paper for Printing market based on several factors, including:
- Paper Grade: Different paper grades cater to specific printing and packaging needs, each with its unique growth projection and competitive dynamics.
- Coating Type: Variations in coating impact printability and performance, influencing market segmentation.
- End-use Application: The market is segmented across various industries including food & beverage, cosmetics, pharmaceuticals, etc., with varying growth rates and competitive landscapes.
- Region: The report provides detailed regional analysis across North America, Europe, Asia, and other regions, detailing market size, growth projections, and competitive landscapes for each.
Each segment's market size, growth projections, and competitive dynamics are detailed within the full report.
Key Drivers of C1s Packaging Paper For Printing Growth
Several factors drive the growth of the C1s Packaging Paper for Printing market. The expanding global packaging industry, fueled by rising consumer spending and e-commerce growth, is a primary driver. Technological advancements in printing techniques and paper production processes enhance efficiency and quality, contributing to market expansion. Favorable economic conditions in key regions stimulate demand for printed packaging. Growing consumer awareness of sustainable packaging options fuels the demand for eco-friendly C1s papers. Government regulations promoting sustainable packaging materials further stimulate market growth.
Challenges in the C1s Packaging Paper For Printing Sector
The C1s Packaging Paper for Printing sector faces various challenges. Fluctuations in raw material prices, particularly pulp, significantly impact production costs and profitability. Environmental regulations and sustainability concerns necessitate continuous investments in environmentally friendly production processes. Intense competition among manufacturers requires continuous innovation and cost optimization to maintain market share. Supply chain disruptions and logistical challenges can affect timely delivery and overall market stability. These factors collectively influence the market's growth trajectory.
Leading Players in the C1s Packaging Paper For Printing Market
- Westrock
- Nath Pulp & Paper Mills
- PG Paper Company
- Eagle Paper International
- GDB International
- MKD International
- Feldmuehle
- Appleton Coated
- Verso
- Sappi North America
- Nippon Paper Group
- Clearwater Paper
- Twin Rivers Paper
Key Developments in C1s Packaging Paper For Printing Sector
- 2022 Q4: Westrock announces investment in a new sustainable paper production line.
- 2023 Q1: Sappi North America launches a new range of eco-friendly C1s packaging papers.
- 2023 Q2: Increased mergers and acquisitions activity reported within the sector.
- 2024 Q1: Significant price increases reported for pulp and other raw materials.
These developments illustrate the dynamic nature of the C1s Packaging Paper for Printing market and highlight the importance of adapting to evolving consumer preferences and technological advancements.
Strategic C1s Packaging Paper For Printing Market Outlook
The C1s Packaging Paper for Printing market presents significant growth potential in the coming years, driven by increasing demand for sustainable packaging solutions and continuous technological innovations. Strategic opportunities exist for companies focused on sustainable production processes, innovative product development, and effective supply chain management. The market is poised for further consolidation, with mergers and acquisitions expected to reshape the competitive landscape. Companies with a strong commitment to sustainability and responsiveness to evolving consumer preferences will be best positioned to capitalize on future market growth.
C1s Packaging Paper For Printing Segmentation
-
1. Application
- 1.1. Food & Beverage
- 1.2. Pharmaceutical
- 1.3. Personal Care & Cosmetics
- 1.4. Consumer Goods
-
2. Type
- 2.1. 70-100GSM
- 2.2. Above 100GSM
C1s Packaging Paper For Printing Segmentation By Geography
-
1. North America
- 1.1. United States
- 1.2. Canada
- 1.3. Mexico
-
2. South America
- 2.1. Brazil
- 2.2. Argentina
- 2.3. Rest of South America
-
3. Europe
- 3.1. United Kingdom
- 3.2. Germany
- 3.3. France
- 3.4. Italy
- 3.5. Spain
- 3.6. Russia
- 3.7. Benelux
- 3.8. Nordics
- 3.9. Rest of Europe
-
4. Middle East & Africa
- 4.1. Turkey
- 4.2. Israel
- 4.3. GCC
- 4.4. North Africa
- 4.5. South Africa
- 4.6. Rest of Middle East & Africa
-
5. Asia Pacific
- 5.1. China
- 5.2. India
- 5.3. Japan
- 5.4. South Korea
- 5.5. ASEAN
- 5.6. Oceania
- 5.7. Rest of Asia Pacific
C1s Packaging Paper For Printing Regional Market Share
Geographic Coverage of C1s Packaging Paper For Printing
C1s Packaging Paper For Printing REPORT HIGHLIGHTS
| Aspects | Details |
|---|---|
| Study Period | 2020-2034 |
| Base Year | 2025 |
| Estimated Year | 2026 |
| Forecast Period | 2026-2034 |
| Historical Period | 2020-2025 |
| Growth Rate | CAGR of 5.2% from 2020-2034 |
| Segmentation |
|
Table of Contents
- 1. Introduction
- 1.1. Research Scope
- 1.2. Market Segmentation
- 1.3. Research Objective
- 1.4. Definitions and Assumptions
- 2. Executive Summary
- 2.1. Market Snapshot
- 3. Market Dynamics
- 3.1. Market Drivers
- 3.2. Market Restrains
- 3.3. Market Trends
- 3.4. Market Opportunities
- 4. Market Factor Analysis
- 4.1. Porters Five Forces
- 4.1.1. Bargaining Power of Suppliers
- 4.1.2. Bargaining Power of Buyers
- 4.1.3. Threat of New Entrants
- 4.1.4. Threat of Substitutes
- 4.1.5. Competitive Rivalry
- 4.2. PESTEL analysis
- 4.3. BCG Analysis
- 4.3.1. Stars (High Growth, High Market Share)
- 4.3.2. Cash Cows (Low Growth, High Market Share)
- 4.3.3. Question Mark (High Growth, Low Market Share)
- 4.3.4. Dogs (Low Growth, Low Market Share)
- 4.4. Ansoff Matrix Analysis
- 4.5. Supply Chain Analysis
- 4.6. Regulatory Landscape
- 4.7. Current Market Potential and Opportunity Assessment (TAM–SAM–SOM Framework)
- 4.8. PMV Analyst Note
- 4.1. Porters Five Forces
- 5. Market Analysis, Insights and Forecast 2021-2033
- 5.1. Market Analysis, Insights and Forecast - by Application
- 5.1.1. Food & Beverage
- 5.1.2. Pharmaceutical
- 5.1.3. Personal Care & Cosmetics
- 5.1.4. Consumer Goods
- 5.2. Market Analysis, Insights and Forecast - by Type
- 5.2.1. 70-100GSM
- 5.2.2. Above 100GSM
- 5.3. Market Analysis, Insights and Forecast - by Region
- 5.3.1. North America
- 5.3.2. South America
- 5.3.3. Europe
- 5.3.4. Middle East & Africa
- 5.3.5. Asia Pacific
- 5.1. Market Analysis, Insights and Forecast - by Application
- 6. Global C1s Packaging Paper For Printing Analysis, Insights and Forecast, 2021-2033
- 6.1. Market Analysis, Insights and Forecast - by Application
- 6.1.1. Food & Beverage
- 6.1.2. Pharmaceutical
- 6.1.3. Personal Care & Cosmetics
- 6.1.4. Consumer Goods
- 6.2. Market Analysis, Insights and Forecast - by Type
- 6.2.1. 70-100GSM
- 6.2.2. Above 100GSM
- 6.1. Market Analysis, Insights and Forecast - by Application
- 7. North America C1s Packaging Paper For Printing Analysis, Insights and Forecast, 2020-2032
- 7.1. Market Analysis, Insights and Forecast - by Application
- 7.1.1. Food & Beverage
- 7.1.2. Pharmaceutical
- 7.1.3. Personal Care & Cosmetics
- 7.1.4. Consumer Goods
- 7.2. Market Analysis, Insights and Forecast - by Type
- 7.2.1. 70-100GSM
- 7.2.2. Above 100GSM
- 7.1. Market Analysis, Insights and Forecast - by Application
- 8. South America C1s Packaging Paper For Printing Analysis, Insights and Forecast, 2020-2032
- 8.1. Market Analysis, Insights and Forecast - by Application
- 8.1.1. Food & Beverage
- 8.1.2. Pharmaceutical
- 8.1.3. Personal Care & Cosmetics
- 8.1.4. Consumer Goods
- 8.2. Market Analysis, Insights and Forecast - by Type
- 8.2.1. 70-100GSM
- 8.2.2. Above 100GSM
- 8.1. Market Analysis, Insights and Forecast - by Application
- 9. Europe C1s Packaging Paper For Printing Analysis, Insights and Forecast, 2020-2032
- 9.1. Market Analysis, Insights and Forecast - by Application
- 9.1.1. Food & Beverage
- 9.1.2. Pharmaceutical
- 9.1.3. Personal Care & Cosmetics
- 9.1.4. Consumer Goods
- 9.2. Market Analysis, Insights and Forecast - by Type
- 9.2.1. 70-100GSM
- 9.2.2. Above 100GSM
- 9.1. Market Analysis, Insights and Forecast - by Application
- 10. Middle East & Africa C1s Packaging Paper For Printing Analysis, Insights and Forecast, 2020-2032
- 10.1. Market Analysis, Insights and Forecast - by Application
- 10.1.1. Food & Beverage
- 10.1.2. Pharmaceutical
- 10.1.3. Personal Care & Cosmetics
- 10.1.4. Consumer Goods
- 10.2. Market Analysis, Insights and Forecast - by Type
- 10.2.1. 70-100GSM
- 10.2.2. Above 100GSM
- 10.1. Market Analysis, Insights and Forecast - by Application
- 11. Asia Pacific C1s Packaging Paper For Printing Analysis, Insights and Forecast, 2020-2032
- 11.1. Market Analysis, Insights and Forecast - by Application
- 11.1.1. Food & Beverage
- 11.1.2. Pharmaceutical
- 11.1.3. Personal Care & Cosmetics
- 11.1.4. Consumer Goods
- 11.2. Market Analysis, Insights and Forecast - by Type
- 11.2.1. 70-100GSM
- 11.2.2. Above 100GSM
- 11.1. Market Analysis, Insights and Forecast - by Application
- 12. Competitive Analysis
- 12.1. Company Profiles
- 12.1.1 Westrock
- 12.1.1.1. Company Overview
- 12.1.1.2. Products
- 12.1.1.3. Company Financials
- 12.1.1.4. SWOT Analysis
- 12.1.2 Nath Pulp & Paper Mills
- 12.1.2.1. Company Overview
- 12.1.2.2. Products
- 12.1.2.3. Company Financials
- 12.1.2.4. SWOT Analysis
- 12.1.3 PG Paper Company
- 12.1.3.1. Company Overview
- 12.1.3.2. Products
- 12.1.3.3. Company Financials
- 12.1.3.4. SWOT Analysis
- 12.1.4 Eagle Paper International
- 12.1.4.1. Company Overview
- 12.1.4.2. Products
- 12.1.4.3. Company Financials
- 12.1.4.4. SWOT Analysis
- 12.1.5 GDB International
- 12.1.5.1. Company Overview
- 12.1.5.2. Products
- 12.1.5.3. Company Financials
- 12.1.5.4. SWOT Analysis
- 12.1.6 MKD International
- 12.1.6.1. Company Overview
- 12.1.6.2. Products
- 12.1.6.3. Company Financials
- 12.1.6.4. SWOT Analysis
- 12.1.7 Feldmuehle
- 12.1.7.1. Company Overview
- 12.1.7.2. Products
- 12.1.7.3. Company Financials
- 12.1.7.4. SWOT Analysis
- 12.1.8 Appleton Coated
- 12.1.8.1. Company Overview
- 12.1.8.2. Products
- 12.1.8.3. Company Financials
- 12.1.8.4. SWOT Analysis
- 12.1.9 Verso
- 12.1.9.1. Company Overview
- 12.1.9.2. Products
- 12.1.9.3. Company Financials
- 12.1.9.4. SWOT Analysis
- 12.1.10 Sappi North America
- 12.1.10.1. Company Overview
- 12.1.10.2. Products
- 12.1.10.3. Company Financials
- 12.1.10.4. SWOT Analysis
- 12.1.11 Nippon Paper Group
- 12.1.11.1. Company Overview
- 12.1.11.2. Products
- 12.1.11.3. Company Financials
- 12.1.11.4. SWOT Analysis
- 12.1.12 Clearwater Paper
- 12.1.12.1. Company Overview
- 12.1.12.2. Products
- 12.1.12.3. Company Financials
- 12.1.12.4. SWOT Analysis
- 12.1.13 Twin Rivers Paper
- 12.1.13.1. Company Overview
- 12.1.13.2. Products
- 12.1.13.3. Company Financials
- 12.1.13.4. SWOT Analysis
- 12.1.1 Westrock
- 12.2. Market Entropy
- 12.2.1 Company's Key Areas Served
- 12.2.2 Recent Developments
- 12.3. Company Market Share Analysis 2025
- 12.3.1 Top 5 Companies Market Share Analysis
- 12.3.2 Top 3 Companies Market Share Analysis
- 12.4. List of Potential Customers
- 13. Research Methodology
List of Figures
- Figure 1: Global C1s Packaging Paper For Printing Revenue Breakdown (undefined, %) by Region 2025 & 2033
- Figure 2: Global C1s Packaging Paper For Printing Volume Breakdown (K, %) by Region 2025 & 2033
- Figure 3: North America C1s Packaging Paper For Printing Revenue (undefined), by Application 2025 & 2033
- Figure 4: North America C1s Packaging Paper For Printing Volume (K), by Application 2025 & 2033
- Figure 5: North America C1s Packaging Paper For Printing Revenue Share (%), by Application 2025 & 2033
- Figure 6: North America C1s Packaging Paper For Printing Volume Share (%), by Application 2025 & 2033
- Figure 7: North America C1s Packaging Paper For Printing Revenue (undefined), by Type 2025 & 2033
- Figure 8: North America C1s Packaging Paper For Printing Volume (K), by Type 2025 & 2033
- Figure 9: North America C1s Packaging Paper For Printing Revenue Share (%), by Type 2025 & 2033
- Figure 10: North America C1s Packaging Paper For Printing Volume Share (%), by Type 2025 & 2033
- Figure 11: North America C1s Packaging Paper For Printing Revenue (undefined), by Country 2025 & 2033
- Figure 12: North America C1s Packaging Paper For Printing Volume (K), by Country 2025 & 2033
- Figure 13: North America C1s Packaging Paper For Printing Revenue Share (%), by Country 2025 & 2033
- Figure 14: North America C1s Packaging Paper For Printing Volume Share (%), by Country 2025 & 2033
- Figure 15: South America C1s Packaging Paper For Printing Revenue (undefined), by Application 2025 & 2033
- Figure 16: South America C1s Packaging Paper For Printing Volume (K), by Application 2025 & 2033
- Figure 17: South America C1s Packaging Paper For Printing Revenue Share (%), by Application 2025 & 2033
- Figure 18: South America C1s Packaging Paper For Printing Volume Share (%), by Application 2025 & 2033
- Figure 19: South America C1s Packaging Paper For Printing Revenue (undefined), by Type 2025 & 2033
- Figure 20: South America C1s Packaging Paper For Printing Volume (K), by Type 2025 & 2033
- Figure 21: South America C1s Packaging Paper For Printing Revenue Share (%), by Type 2025 & 2033
- Figure 22: South America C1s Packaging Paper For Printing Volume Share (%), by Type 2025 & 2033
- Figure 23: South America C1s Packaging Paper For Printing Revenue (undefined), by Country 2025 & 2033
- Figure 24: South America C1s Packaging Paper For Printing Volume (K), by Country 2025 & 2033
- Figure 25: South America C1s Packaging Paper For Printing Revenue Share (%), by Country 2025 & 2033
- Figure 26: South America C1s Packaging Paper For Printing Volume Share (%), by Country 2025 & 2033
- Figure 27: Europe C1s Packaging Paper For Printing Revenue (undefined), by Application 2025 & 2033
- Figure 28: Europe C1s Packaging Paper For Printing Volume (K), by Application 2025 & 2033
- Figure 29: Europe C1s Packaging Paper For Printing Revenue Share (%), by Application 2025 & 2033
- Figure 30: Europe C1s Packaging Paper For Printing Volume Share (%), by Application 2025 & 2033
- Figure 31: Europe C1s Packaging Paper For Printing Revenue (undefined), by Type 2025 & 2033
- Figure 32: Europe C1s Packaging Paper For Printing Volume (K), by Type 2025 & 2033
- Figure 33: Europe C1s Packaging Paper For Printing Revenue Share (%), by Type 2025 & 2033
- Figure 34: Europe C1s Packaging Paper For Printing Volume Share (%), by Type 2025 & 2033
- Figure 35: Europe C1s Packaging Paper For Printing Revenue (undefined), by Country 2025 & 2033
- Figure 36: Europe C1s Packaging Paper For Printing Volume (K), by Country 2025 & 2033
- Figure 37: Europe C1s Packaging Paper For Printing Revenue Share (%), by Country 2025 & 2033
- Figure 38: Europe C1s Packaging Paper For Printing Volume Share (%), by Country 2025 & 2033
- Figure 39: Middle East & Africa C1s Packaging Paper For Printing Revenue (undefined), by Application 2025 & 2033
- Figure 40: Middle East & Africa C1s Packaging Paper For Printing Volume (K), by Application 2025 & 2033
- Figure 41: Middle East & Africa C1s Packaging Paper For Printing Revenue Share (%), by Application 2025 & 2033
- Figure 42: Middle East & Africa C1s Packaging Paper For Printing Volume Share (%), by Application 2025 & 2033
- Figure 43: Middle East & Africa C1s Packaging Paper For Printing Revenue (undefined), by Type 2025 & 2033
- Figure 44: Middle East & Africa C1s Packaging Paper For Printing Volume (K), by Type 2025 & 2033
- Figure 45: Middle East & Africa C1s Packaging Paper For Printing Revenue Share (%), by Type 2025 & 2033
- Figure 46: Middle East & Africa C1s Packaging Paper For Printing Volume Share (%), by Type 2025 & 2033
- Figure 47: Middle East & Africa C1s Packaging Paper For Printing Revenue (undefined), by Country 2025 & 2033
- Figure 48: Middle East & Africa C1s Packaging Paper For Printing Volume (K), by Country 2025 & 2033
- Figure 49: Middle East & Africa C1s Packaging Paper For Printing Revenue Share (%), by Country 2025 & 2033
- Figure 50: Middle East & Africa C1s Packaging Paper For Printing Volume Share (%), by Country 2025 & 2033
- Figure 51: Asia Pacific C1s Packaging Paper For Printing Revenue (undefined), by Application 2025 & 2033
- Figure 52: Asia Pacific C1s Packaging Paper For Printing Volume (K), by Application 2025 & 2033
- Figure 53: Asia Pacific C1s Packaging Paper For Printing Revenue Share (%), by Application 2025 & 2033
- Figure 54: Asia Pacific C1s Packaging Paper For Printing Volume Share (%), by Application 2025 & 2033
- Figure 55: Asia Pacific C1s Packaging Paper For Printing Revenue (undefined), by Type 2025 & 2033
- Figure 56: Asia Pacific C1s Packaging Paper For Printing Volume (K), by Type 2025 & 2033
- Figure 57: Asia Pacific C1s Packaging Paper For Printing Revenue Share (%), by Type 2025 & 2033
- Figure 58: Asia Pacific C1s Packaging Paper For Printing Volume Share (%), by Type 2025 & 2033
- Figure 59: Asia Pacific C1s Packaging Paper For Printing Revenue (undefined), by Country 2025 & 2033
- Figure 60: Asia Pacific C1s Packaging Paper For Printing Volume (K), by Country 2025 & 2033
- Figure 61: Asia Pacific C1s Packaging Paper For Printing Revenue Share (%), by Country 2025 & 2033
- Figure 62: Asia Pacific C1s Packaging Paper For Printing Volume Share (%), by Country 2025 & 2033
List of Tables
- Table 1: Global C1s Packaging Paper For Printing Revenue undefined Forecast, by Application 2020 & 2033
- Table 2: Global C1s Packaging Paper For Printing Volume K Forecast, by Application 2020 & 2033
- Table 3: Global C1s Packaging Paper For Printing Revenue undefined Forecast, by Type 2020 & 2033
- Table 4: Global C1s Packaging Paper For Printing Volume K Forecast, by Type 2020 & 2033
- Table 5: Global C1s Packaging Paper For Printing Revenue undefined Forecast, by Region 2020 & 2033
- Table 6: Global C1s Packaging Paper For Printing Volume K Forecast, by Region 2020 & 2033
- Table 7: Global C1s Packaging Paper For Printing Revenue undefined Forecast, by Application 2020 & 2033
- Table 8: Global C1s Packaging Paper For Printing Volume K Forecast, by Application 2020 & 2033
- Table 9: Global C1s Packaging Paper For Printing Revenue undefined Forecast, by Type 2020 & 2033
- Table 10: Global C1s Packaging Paper For Printing Volume K Forecast, by Type 2020 & 2033
- Table 11: Global C1s Packaging Paper For Printing Revenue undefined Forecast, by Country 2020 & 2033
- Table 12: Global C1s Packaging Paper For Printing Volume K Forecast, by Country 2020 & 2033
- Table 13: United States C1s Packaging Paper For Printing Revenue (undefined) Forecast, by Application 2020 & 2033
- Table 14: United States C1s Packaging Paper For Printing Volume (K) Forecast, by Application 2020 & 2033
- Table 15: Canada C1s Packaging Paper For Printing Revenue (undefined) Forecast, by Application 2020 & 2033
- Table 16: Canada C1s Packaging Paper For Printing Volume (K) Forecast, by Application 2020 & 2033
- Table 17: Mexico C1s Packaging Paper For Printing Revenue (undefined) Forecast, by Application 2020 & 2033
- Table 18: Mexico C1s Packaging Paper For Printing Volume (K) Forecast, by Application 2020 & 2033
- Table 19: Global C1s Packaging Paper For Printing Revenue undefined Forecast, by Application 2020 & 2033
- Table 20: Global C1s Packaging Paper For Printing Volume K Forecast, by Application 2020 & 2033
- Table 21: Global C1s Packaging Paper For Printing Revenue undefined Forecast, by Type 2020 & 2033
- Table 22: Global C1s Packaging Paper For Printing Volume K Forecast, by Type 2020 & 2033
- Table 23: Global C1s Packaging Paper For Printing Revenue undefined Forecast, by Country 2020 & 2033
- Table 24: Global C1s Packaging Paper For Printing Volume K Forecast, by Country 2020 & 2033
- Table 25: Brazil C1s Packaging Paper For Printing Revenue (undefined) Forecast, by Application 2020 & 2033
- Table 26: Brazil C1s Packaging Paper For Printing Volume (K) Forecast, by Application 2020 & 2033
- Table 27: Argentina C1s Packaging Paper For Printing Revenue (undefined) Forecast, by Application 2020 & 2033
- Table 28: Argentina C1s Packaging Paper For Printing Volume (K) Forecast, by Application 2020 & 2033
- Table 29: Rest of South America C1s Packaging Paper For Printing Revenue (undefined) Forecast, by Application 2020 & 2033
- Table 30: Rest of South America C1s Packaging Paper For Printing Volume (K) Forecast, by Application 2020 & 2033
- Table 31: Global C1s Packaging Paper For Printing Revenue undefined Forecast, by Application 2020 & 2033
- Table 32: Global C1s Packaging Paper For Printing Volume K Forecast, by Application 2020 & 2033
- Table 33: Global C1s Packaging Paper For Printing Revenue undefined Forecast, by Type 2020 & 2033
- Table 34: Global C1s Packaging Paper For Printing Volume K Forecast, by Type 2020 & 2033
- Table 35: Global C1s Packaging Paper For Printing Revenue undefined Forecast, by Country 2020 & 2033
- Table 36: Global C1s Packaging Paper For Printing Volume K Forecast, by Country 2020 & 2033
- Table 37: United Kingdom C1s Packaging Paper For Printing Revenue (undefined) Forecast, by Application 2020 & 2033
- Table 38: United Kingdom C1s Packaging Paper For Printing Volume (K) Forecast, by Application 2020 & 2033
- Table 39: Germany C1s Packaging Paper For Printing Revenue (undefined) Forecast, by Application 2020 & 2033
- Table 40: Germany C1s Packaging Paper For Printing Volume (K) Forecast, by Application 2020 & 2033
- Table 41: France C1s Packaging Paper For Printing Revenue (undefined) Forecast, by Application 2020 & 2033
- Table 42: France C1s Packaging Paper For Printing Volume (K) Forecast, by Application 2020 & 2033
- Table 43: Italy C1s Packaging Paper For Printing Revenue (undefined) Forecast, by Application 2020 & 2033
- Table 44: Italy C1s Packaging Paper For Printing Volume (K) Forecast, by Application 2020 & 2033
- Table 45: Spain C1s Packaging Paper For Printing Revenue (undefined) Forecast, by Application 2020 & 2033
- Table 46: Spain C1s Packaging Paper For Printing Volume (K) Forecast, by Application 2020 & 2033
- Table 47: Russia C1s Packaging Paper For Printing Revenue (undefined) Forecast, by Application 2020 & 2033
- Table 48: Russia C1s Packaging Paper For Printing Volume (K) Forecast, by Application 2020 & 2033
- Table 49: Benelux C1s Packaging Paper For Printing Revenue (undefined) Forecast, by Application 2020 & 2033
- Table 50: Benelux C1s Packaging Paper For Printing Volume (K) Forecast, by Application 2020 & 2033
- Table 51: Nordics C1s Packaging Paper For Printing Revenue (undefined) Forecast, by Application 2020 & 2033
- Table 52: Nordics C1s Packaging Paper For Printing Volume (K) Forecast, by Application 2020 & 2033
- Table 53: Rest of Europe C1s Packaging Paper For Printing Revenue (undefined) Forecast, by Application 2020 & 2033
- Table 54: Rest of Europe C1s Packaging Paper For Printing Volume (K) Forecast, by Application 2020 & 2033
- Table 55: Global C1s Packaging Paper For Printing Revenue undefined Forecast, by Application 2020 & 2033
- Table 56: Global C1s Packaging Paper For Printing Volume K Forecast, by Application 2020 & 2033
- Table 57: Global C1s Packaging Paper For Printing Revenue undefined Forecast, by Type 2020 & 2033
- Table 58: Global C1s Packaging Paper For Printing Volume K Forecast, by Type 2020 & 2033
- Table 59: Global C1s Packaging Paper For Printing Revenue undefined Forecast, by Country 2020 & 2033
- Table 60: Global C1s Packaging Paper For Printing Volume K Forecast, by Country 2020 & 2033
- Table 61: Turkey C1s Packaging Paper For Printing Revenue (undefined) Forecast, by Application 2020 & 2033
- Table 62: Turkey C1s Packaging Paper For Printing Volume (K) Forecast, by Application 2020 & 2033
- Table 63: Israel C1s Packaging Paper For Printing Revenue (undefined) Forecast, by Application 2020 & 2033
- Table 64: Israel C1s Packaging Paper For Printing Volume (K) Forecast, by Application 2020 & 2033
- Table 65: GCC C1s Packaging Paper For Printing Revenue (undefined) Forecast, by Application 2020 & 2033
- Table 66: GCC C1s Packaging Paper For Printing Volume (K) Forecast, by Application 2020 & 2033
- Table 67: North Africa C1s Packaging Paper For Printing Revenue (undefined) Forecast, by Application 2020 & 2033
- Table 68: North Africa C1s Packaging Paper For Printing Volume (K) Forecast, by Application 2020 & 2033
- Table 69: South Africa C1s Packaging Paper For Printing Revenue (undefined) Forecast, by Application 2020 & 2033
- Table 70: South Africa C1s Packaging Paper For Printing Volume (K) Forecast, by Application 2020 & 2033
- Table 71: Rest of Middle East & Africa C1s Packaging Paper For Printing Revenue (undefined) Forecast, by Application 2020 & 2033
- Table 72: Rest of Middle East & Africa C1s Packaging Paper For Printing Volume (K) Forecast, by Application 2020 & 2033
- Table 73: Global C1s Packaging Paper For Printing Revenue undefined Forecast, by Application 2020 & 2033
- Table 74: Global C1s Packaging Paper For Printing Volume K Forecast, by Application 2020 & 2033
- Table 75: Global C1s Packaging Paper For Printing Revenue undefined Forecast, by Type 2020 & 2033
- Table 76: Global C1s Packaging Paper For Printing Volume K Forecast, by Type 2020 & 2033
- Table 77: Global C1s Packaging Paper For Printing Revenue undefined Forecast, by Country 2020 & 2033
- Table 78: Global C1s Packaging Paper For Printing Volume K Forecast, by Country 2020 & 2033
- Table 79: China C1s Packaging Paper For Printing Revenue (undefined) Forecast, by Application 2020 & 2033
- Table 80: China C1s Packaging Paper For Printing Volume (K) Forecast, by Application 2020 & 2033
- Table 81: India C1s Packaging Paper For Printing Revenue (undefined) Forecast, by Application 2020 & 2033
- Table 82: India C1s Packaging Paper For Printing Volume (K) Forecast, by Application 2020 & 2033
- Table 83: Japan C1s Packaging Paper For Printing Revenue (undefined) Forecast, by Application 2020 & 2033
- Table 84: Japan C1s Packaging Paper For Printing Volume (K) Forecast, by Application 2020 & 2033
- Table 85: South Korea C1s Packaging Paper For Printing Revenue (undefined) Forecast, by Application 2020 & 2033
- Table 86: South Korea C1s Packaging Paper For Printing Volume (K) Forecast, by Application 2020 & 2033
- Table 87: ASEAN C1s Packaging Paper For Printing Revenue (undefined) Forecast, by Application 2020 & 2033
- Table 88: ASEAN C1s Packaging Paper For Printing Volume (K) Forecast, by Application 2020 & 2033
- Table 89: Oceania C1s Packaging Paper For Printing Revenue (undefined) Forecast, by Application 2020 & 2033
- Table 90: Oceania C1s Packaging Paper For Printing Volume (K) Forecast, by Application 2020 & 2033
- Table 91: Rest of Asia Pacific C1s Packaging Paper For Printing Revenue (undefined) Forecast, by Application 2020 & 2033
- Table 92: Rest of Asia Pacific C1s Packaging Paper For Printing Volume (K) Forecast, by Application 2020 & 2033
Frequently Asked Questions
1. What is the projected Compound Annual Growth Rate (CAGR) of the C1s Packaging Paper For Printing?
The projected CAGR is approximately 5.2%.
2. Which companies are prominent players in the C1s Packaging Paper For Printing?
Key companies in the market include Westrock, Nath Pulp & Paper Mills, PG Paper Company, Eagle Paper International, GDB International, MKD International, Feldmuehle, Appleton Coated, Verso, Sappi North America, Nippon Paper Group, Clearwater Paper, Twin Rivers Paper.
3. What are the main segments of the C1s Packaging Paper For Printing?
The market segments include Application, Type.
4. Can you provide details about the market size?
The market size is estimated to be USD XXX N/A as of 2022.
5. What are some drivers contributing to market growth?
N/A
6. What are the notable trends driving market growth?
N/A
7. Are there any restraints impacting market growth?
N/A
8. Can you provide examples of recent developments in the market?
N/A
9. What pricing options are available for accessing the report?
Pricing options include single-user, multi-user, and enterprise licenses priced at USD 3950.00, USD 5925.00, and USD 7900.00 respectively.
10. Is the market size provided in terms of value or volume?
The market size is provided in terms of value, measured in N/A and volume, measured in K.
11. Are there any specific market keywords associated with the report?
Yes, the market keyword associated with the report is "C1s Packaging Paper For Printing," which aids in identifying and referencing the specific market segment covered.
12. How do I determine which pricing option suits my needs best?
The pricing options vary based on user requirements and access needs. Individual users may opt for single-user licenses, while businesses requiring broader access may choose multi-user or enterprise licenses for cost-effective access to the report.
13. Are there any additional resources or data provided in the C1s Packaging Paper For Printing report?
While the report offers comprehensive insights, it's advisable to review the specific contents or supplementary materials provided to ascertain if additional resources or data are available.
14. How can I stay updated on further developments or reports in the C1s Packaging Paper For Printing?
To stay informed about further developments, trends, and reports in the C1s Packaging Paper For Printing, consider subscribing to industry newsletters, following relevant companies and organizations, or regularly checking reputable industry news sources and publications.
Methodology
Step 1 - Identification of Relevant Samples Size from Population Database


Step 2 - Approaches for Defining Global Market Size (Value, Volume* & Price*)

Note*: In applicable scenarios
Step 3 - Data Sources
Primary Research
- Web Analytics
- Survey Reports
- Research Institute
- Latest Research Reports
- Opinion Leaders
Secondary Research
- Annual Reports
- White Paper
- Latest Press Release
- Industry Association
- Paid Database
- Investor Presentations

Step 4 - Data Triangulation
Involves using different sources of information in order to increase the validity of a study
These sources are likely to be stakeholders in a program - participants, other researchers, program staff, other community members, and so on.
Then we put all data in single framework & apply various statistical tools to find out the dynamic on the market.
During the analysis stage, feedback from the stakeholder groups would be compared to determine areas of agreement as well as areas of divergence