

Key Insights
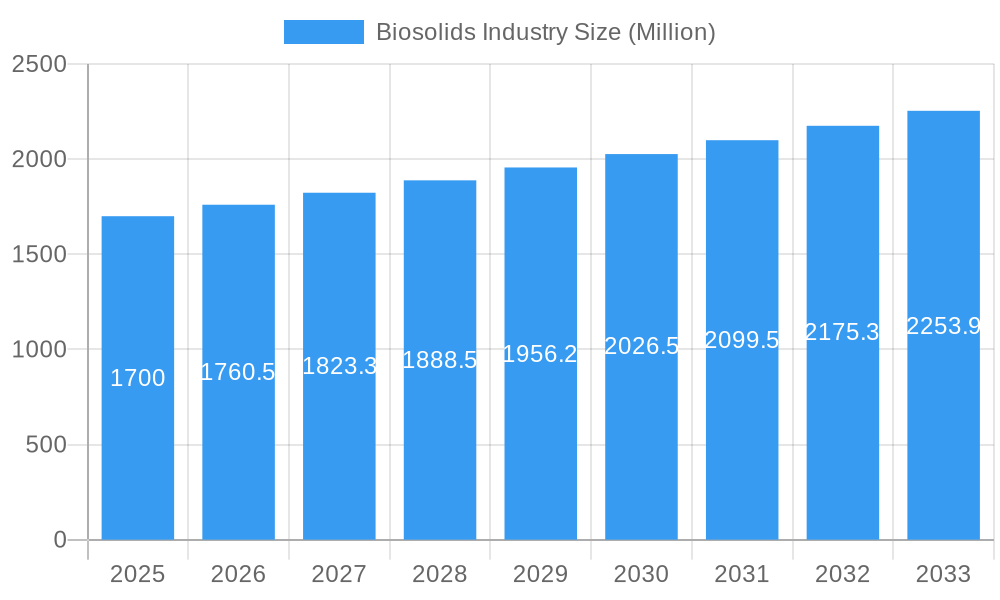
The biosolids market, valued at $1.7 billion in 2025, is projected to experience robust growth, exceeding a 3.5% CAGR through 2033. This expansion is driven by increasing awareness of sustainable waste management practices and the growing demand for nutrient-rich biosolids as fertilizers in agriculture. The market is segmented by form (cakes, liquid, pellets), application (agricultural land, non-agricultural land including landscaping and recreational fields, and domestic use), and quality (Class A, Class A EQ, Class B). The diverse applications highlight the versatility of biosolids, minimizing waste and offering cost-effective solutions for nutrient replenishment. While regulatory hurdles and public perception concerning the safe use of biosolids remain potential restraints, technological advancements in processing and application techniques are mitigating these challenges. The shift towards sustainable agriculture and stricter environmental regulations are expected to propel market growth, particularly in regions with high population density and agricultural activity like North America, Europe, and Asia-Pacific. The presence of established players like Walker Industries, Cambi ASA, and Lystek International indicates a consolidated yet competitive landscape, ripe for innovation and expansion.
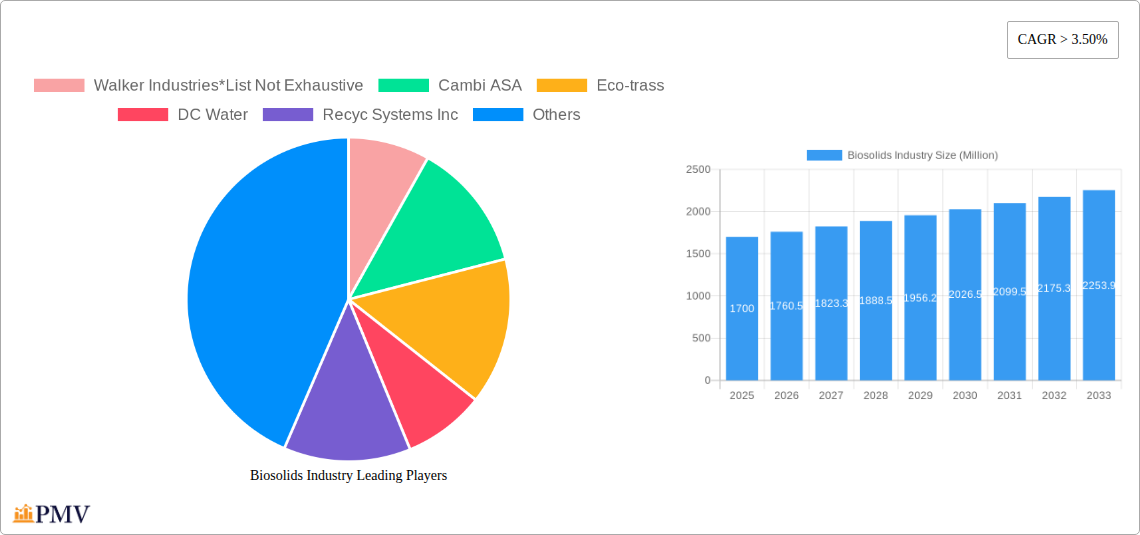
Biosolids Industry Market Size (In Billion)
The geographical distribution of the market mirrors global trends in urbanization and agricultural intensification. North America and Europe currently hold significant market shares due to established infrastructure and stringent environmental regulations. However, the Asia-Pacific region is poised for rapid growth fueled by burgeoning agricultural sectors and increasing government support for sustainable waste management initiatives. Companies are focusing on developing innovative products and services catering to specific regional needs, such as customized biosolids processing solutions and targeted marketing efforts to agricultural stakeholders. Future growth will depend on successfully addressing concerns regarding public perception, developing efficient transportation and distribution networks, and fostering collaborations between waste management companies and agricultural users. This will ensure responsible and widespread adoption of biosolids as a sustainable resource.
Biosolids Industry Company Market Share
Biosolids Industry Market Report: 2019-2033
This comprehensive report provides a detailed analysis of the global biosolids industry, offering invaluable insights for stakeholders, investors, and industry professionals. With a study period spanning 2019-2033, a base year of 2025, and a forecast period of 2025-2033, this report covers key market segments, competitive dynamics, and future growth opportunities. The report meticulously examines market trends, innovations, and challenges, providing actionable data and forecasts to inform strategic decision-making. The global biosolids market size is estimated at xx Million in 2025 and is projected to reach xx Million by 2033, exhibiting a CAGR of xx% during the forecast period.
Biosolids Industry Market Structure & Competitive Dynamics
The biosolids industry exhibits a moderately concentrated market structure, with several major players and a large number of smaller regional operators. Market share is largely dictated by geographical reach, technological capabilities, and established client relationships. Key players like Synagro Technologies, Cambi ASA, and REMONDIS SE & Co KG hold significant market share, though precise figures vary by region and segment. Innovation ecosystems are relatively robust, with ongoing advancements in treatment technologies and application methods driving competition. Stringent environmental regulations significantly influence market dynamics, promoting the development of sustainable and efficient biosolids management practices. Product substitutes, such as chemical fertilizers, pose a competitive challenge; however, the increasing awareness of environmental sustainability and the cost-effectiveness of biosolids are driving adoption. End-user trends show a growing preference for high-quality biosolids (Class A and Class A EQ) for agricultural applications, while demand for energy recovery is also increasing. Mergers and acquisitions (M&A) activity is relatively frequent, with deal values ranging from a few Million to several hundred Million USD, indicating industry consolidation and expansion strategies. Recent notable M&A activities include Synagro Technologies' acquisition of Burch Hydro in 2023, highlighting the focus on expanding market share and service offerings.
Biosolids Industry Industry Trends & Insights
The global biosolids industry is experiencing robust and accelerating growth, propelled by a confluence of critical factors. Heightened environmental awareness and increasingly stringent regulations governing waste management are compelling municipalities and industries alike to embrace and implement sustainable biosolids management solutions. Concurrently, a surging demand for organic fertilizers in both agriculture and horticulture is actively driving the adoption of biosolids as a highly cost-effective and environmentally superior alternative to conventional synthetic fertilizers. Significant technological advancements, including the widespread implementation of thermal hydrolysis and advanced anaerobic digestion processes, are not only elevating the quality and processing efficiency of biosolids but also significantly expanding their range of potential applications. Consumer preferences are demonstrably shifting towards sustainable and ecologically responsible practices, which in turn is boosting the market demand for biosolids that are produced and utilized with utmost environmental stewardship. The competitive landscape is notably dynamic, characterized by a continuous stream of innovations, strategic collaborations and partnerships, and calculated acquisitions, all of which contribute to the industry's overall expansion and sophisticated development. The market penetration of Class A and Class A EQ biosolids is on a steady upward trajectory, underscoring the industry's unwavering commitment to delivering higher quality, safer, and more versatile end products. Technological disruptions, such as the development and deployment of next-generation digester technologies, are proving to be instrumental in driving operational efficiencies and unlocking entirely new application possibilities.
Dominant Markets & Segments in Biosolids Industry
The agricultural land application segment continues to be the undisputed leader in the biosolids market, projected to reach a substantial value of approximately [Insert Specific Value Here, e.g., $X Billion] USD by 2025. This dominance is primarily attributed to the escalating demand for fertilizers that are both sustainable and economically viable. Within the 'type' segment, Class A and Class A EQ biosolids command the largest market share, a clear indication of the prevailing preference for higher-quality products suitable for a broad spectrum of applications. Geographically, North America and Europe emerge as the dominant regions, a status largely attributable to their robust environmental regulatory frameworks, well-established infrastructure for wastewater treatment and biosolids management, and significant levels of investment in these areas. Within these dominant regions, countries like the United States and Germany are particularly noteworthy for their substantial contributions to the overall market share.
-
Key Drivers:
- Stringent and evolving environmental regulations mandating responsible waste management.
- The rapidly growing global demand for sustainable agricultural practices and organic food production.
- The compelling cost-effectiveness of biosolids as a fertilizer compared to traditional synthetic options.
- Increasing consumer awareness and preference for environmentally sustainable products and practices.
- Supportive government initiatives, including incentives and subsidies, promoting biosolids utilization.
- Continuous innovation and development in advanced biosolids processing and treatment technologies.
- The expanding understanding of the soil health benefits derived from nutrient-rich biosolids.
Our dominance analysis clearly indicates that the agricultural sector's strong preference for Class A and Class A EQ biosolids is a primary engine driving market growth. The superior quality and stringent safety standards associated with these classes facilitate a wider array of versatile applications, thereby amplifying demand. North America and Europe continue to lead due to their mature regulatory environments, comprehensive infrastructure, and substantial investments in advanced wastewater treatment and biosolids management systems.
Biosolids Industry Product Innovations
Recent innovations in biosolids processing include advancements in thermal hydrolysis, improving pathogen reduction and nutrient recovery. New application methods are also emerging, focusing on precision application techniques and optimized nutrient release for improved agricultural outcomes. Companies are developing value-added biosolids products, such as enhanced fertilizers and soil amendments, providing competitive advantages and expanding market reach. These technological trends directly translate into improved market fit by providing higher-quality products, more efficient processing, and diversified applications to meet evolving market demands.
Report Segmentation & Scope
This comprehensive report meticulously segments the biosolids market, offering detailed insights into various facets. The segmentation is based on key parameters including form (cakes, liquid, pellets), diverse applications (agricultural land application, fertilizer for animal crop production – including pastures, non-agricultural land application, landscaping, recreational fields, domestic use, energy recovery, and energy production), and type (Class A, Class A EQ, and Class B). Each segment is subjected to rigorous analysis, encompassing detailed growth projections, precise market size estimations, and an in-depth examination of competitive dynamics. Growth projections exhibit considerable variation across segments, with agricultural applications and Class A/A EQ biosolids consistently demonstrating the most robust growth rates. Competitive dynamics are significantly influenced by a combination of factors, including the pace of technological advancements, strategic pricing strategies employed by market players, and the imperative of regulatory compliance.
Form: Cakes, liquid, and pellets each exhibit distinct market characteristics and follow unique growth trajectories, influenced by their respective handling, processing, and application requirements.
Application: Agricultural land application stands out as the largest segment by market share, closely followed by non-agricultural land application and energy recovery, reflecting the diverse utility of biosolids.
Type: Class A and Class A EQ biosolids continue to command a significant market premium and are the primary drivers of high growth rates, owing to their demonstrably superior quality and enhanced safety profiles.
Key Drivers of Biosolids Industry Growth
Technological advancements in biosolids processing are significantly contributing to industry growth, allowing for more efficient and sustainable waste management. Stringent environmental regulations are driving adoption of biosolids as a sustainable alternative to traditional waste disposal methods. Favorable economic conditions and increasing agricultural output are stimulating demand for biosolids as an affordable and effective fertilizer. For example, government subsidies and incentives in certain regions further boost biosolids utilization.
Challenges in the Biosolids Industry Sector
The biosolids industry faces several significant hurdles that necessitate strategic navigation. Regulatory complexities, including the stringent and often time-consuming permitting processes and evolving disposal requirements, continue to pose considerable challenges. Supply chain disruptions, particularly concerning the efficient transportation and logistics of biosolids, can impact overall market accessibility and cost-effectiveness. Furthermore, the inherent competition from traditional chemical fertilizers, coupled with the variability in biosolids quality stemming from diverse sources, presents ongoing challenges. These factors collectively influence profitability and the pace of market penetration for biosolids as a preferred solution.
Leading Players in the Biosolids Industry Market
- Walker Industries
- Cambi ASA
- Eco-trass
- DC Water
- Recyc Systems Inc
- BCR Environmental
- Aguas Andinas SA
- Cleanaway
- SYLVIS
- Casella Waste Systems Inc
- Englobe
- Agrivert Ltd
- Saur
- Alan Srl
- Lystek International
- REMONDIS SE & Co KG
- FCC Group
- Synagro Technologies
- C R E - Centro di Ricerche Ecologiche
- Parker Ag Services LLC
- Terrapure BR Ltd
- Merrell Bros Inc
- Allevi Srl
Key Developments in Biosolids Industry Sector
- January 2023: Synagro Technologies Inc. acquired Burch Hydro Inc., expanding its biosolids management capabilities and market reach.
- November 2022: The San Francisco Public Utilities Commission (SFPUC) and Cambi partnered to install thermal hydrolysis systems, representing significant investment in advanced biosolids treatment technologies. This project, with its USD 3 Billion investment, highlights the commitment to upgrading wastewater infrastructure and adopting sustainable biosolids management practices.
Strategic Biosolids Industry Market Outlook
The biosolids industry is strategically positioned for sustained and significant growth in the coming years. This upward trajectory is underpinned by the relentless pace of technological innovation, the increasing stringency of environmental regulations globally, and a burgeoning demand for sustainable resource management solutions. Key strategic opportunities lie in the proactive development and deployment of advanced biosolids processing technologies, the aggressive expansion into novel and diverse application areas, and the cultivation of strong, synergistic partnerships across the entire value chain. Companies that prioritize the production of high-quality, safe, and environmentally sound biosolids, coupled with a focus on efficient processing and a steadfast commitment to sustainable practices, will be exceptionally well-positioned to capture significant market share and capitalize on the substantial long-term growth potential inherent in this vital industry.
Biosolids Industry Segmentation
-
1. Type
- 1.1. Class A
- 1.2. Class A EQ (Exceptional Quality)
- 1.3. Class B
-
2. Form
- 2.1. Cakes
- 2.2. Liquid
- 2.3. Pellet
-
3. Application
-
3.1. Agriculture land Application
- 3.1.1. Fertiliz
- 3.1.2. Fertilizer for Animal Crop Production - Pastures
-
3.2. Non-agricultural Land Application
- 3.2.1. Forest Crops (Land Restoration and Forestry)
- 3.2.2. Land Reclamation (Roads and Urban Wetlands)
- 3.2.3. Reclaiming Mining Sites
- 3.2.4. Landscaping, Recreational Fields, and Domestic Use
-
3.3. Energy Recovery Energy Production
- 3.3.1. Heat Generation, Incineration, and Gasification
- 3.3.2. Oil and Cement Production
- 3.3.3. Commercial Uses
-
3.1. Agriculture land Application
Biosolids Industry Segmentation By Geography
-
1. Asia Pacific
- 1.1. China
- 1.2. India
- 1.3. Japan
- 1.4. South Korea
- 1.5. Malaysia
- 1.6. Thailand
- 1.7. Indonesia
- 1.8. Vietnam
- 1.9. Rest of Asia Pacific
-
2. North America
- 2.1. United States
- 2.2. Canada
- 2.3. Mexico
-
3. Europe
- 3.1. Germany
- 3.2. United Kingdom
- 3.3. Italy
- 3.4. France
- 3.5. Spain
- 3.6. NORDIC
- 3.7. Turkey
- 3.8. Russia
- 3.9. Rest of Europe
-
4. South America
- 4.1. Brazil
- 4.2. Argentina
- 4.3. Colombia
- 4.4. Rest of South America
-
5. Middle East and Africa
- 5.1. Saudi Arabia
- 5.2. South Africa
- 5.3. Nigeria
- 5.4. Qatar
- 5.5. Egypt
- 5.6. United Arab Emirates
- 5.7. Rest of Middle East and Africa
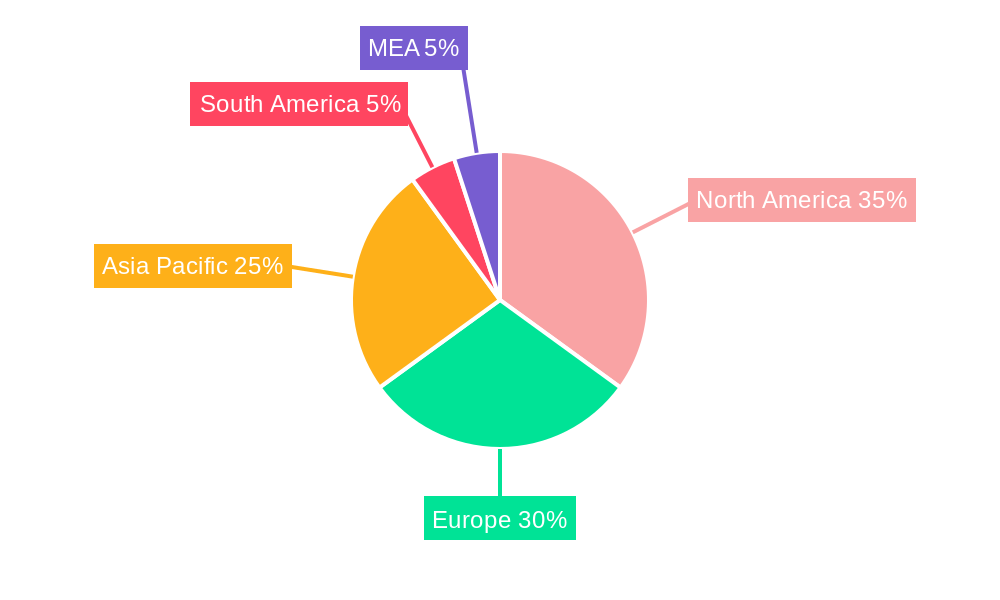
Biosolids Industry Regional Market Share
Geographic Coverage of Biosolids Industry
Biosolids Industry REPORT HIGHLIGHTS
| Aspects | Details |
|---|---|
| Study Period | 2020-2034 |
| Base Year | 2025 |
| Estimated Year | 2026 |
| Forecast Period | 2026-2034 |
| Historical Period | 2020-2025 |
| Growth Rate | CAGR of > 3.50% from 2020-2034 |
| Segmentation |
|
Table of Contents
- 1. Introduction
- 1.1. Research Scope
- 1.2. Market Segmentation
- 1.3. Research Objective
- 1.4. Definitions and Assumptions
- 2. Executive Summary
- 2.1. Market Snapshot
- 3. Market Dynamics
- 3.1. Market Drivers
- 3.2. Market Restrains
- 3.3. Market Trends
- 3.4. Market Opportunities
- 4. Market Factor Analysis
- 4.1. Porters Five Forces
- 4.1.1. Bargaining Power of Suppliers
- 4.1.2. Bargaining Power of Buyers
- 4.1.3. Threat of New Entrants
- 4.1.4. Threat of Substitutes
- 4.1.5. Competitive Rivalry
- 4.2. PESTEL analysis
- 4.3. BCG Analysis
- 4.3.1. Stars (High Growth, High Market Share)
- 4.3.2. Cash Cows (Low Growth, High Market Share)
- 4.3.3. Question Mark (High Growth, Low Market Share)
- 4.3.4. Dogs (Low Growth, Low Market Share)
- 4.4. Ansoff Matrix Analysis
- 4.5. Supply Chain Analysis
- 4.6. Regulatory Landscape
- 4.7. Current Market Potential and Opportunity Assessment (TAM–SAM–SOM Framework)
- 4.8. PMV Analyst Note
- 4.1. Porters Five Forces
- 5. Market Analysis, Insights and Forecast 2021-2033
- 5.1. Market Analysis, Insights and Forecast - by Type
- 5.1.1. Class A
- 5.1.2. Class A EQ (Exceptional Quality)
- 5.1.3. Class B
- 5.2. Market Analysis, Insights and Forecast - by Form
- 5.2.1. Cakes
- 5.2.2. Liquid
- 5.2.3. Pellet
- 5.3. Market Analysis, Insights and Forecast - by Application
- 5.3.1. Agriculture land Application
- 5.3.1.1. Fertiliz
- 5.3.1.2. Fertilizer for Animal Crop Production - Pastures
- 5.3.2. Non-agricultural Land Application
- 5.3.2.1. Forest Crops (Land Restoration and Forestry)
- 5.3.2.2. Land Reclamation (Roads and Urban Wetlands)
- 5.3.2.3. Reclaiming Mining Sites
- 5.3.2.4. Landscaping, Recreational Fields, and Domestic Use
- 5.3.3. Energy Recovery Energy Production
- 5.3.3.1. Heat Generation, Incineration, and Gasification
- 5.3.3.2. Oil and Cement Production
- 5.3.3.3. Commercial Uses
- 5.3.1. Agriculture land Application
- 5.4. Market Analysis, Insights and Forecast - by Region
- 5.4.1. Asia Pacific
- 5.4.2. North America
- 5.4.3. Europe
- 5.4.4. South America
- 5.4.5. Middle East and Africa
- 5.1. Market Analysis, Insights and Forecast - by Type
- 6. Global Biosolids Industry Analysis, Insights and Forecast, 2021-2033
- 6.1. Market Analysis, Insights and Forecast - by Type
- 6.1.1. Class A
- 6.1.2. Class A EQ (Exceptional Quality)
- 6.1.3. Class B
- 6.2. Market Analysis, Insights and Forecast - by Form
- 6.2.1. Cakes
- 6.2.2. Liquid
- 6.2.3. Pellet
- 6.3. Market Analysis, Insights and Forecast - by Application
- 6.3.1. Agriculture land Application
- 6.3.1.1. Fertiliz
- 6.3.1.2. Fertilizer for Animal Crop Production - Pastures
- 6.3.2. Non-agricultural Land Application
- 6.3.2.1. Forest Crops (Land Restoration and Forestry)
- 6.3.2.2. Land Reclamation (Roads and Urban Wetlands)
- 6.3.2.3. Reclaiming Mining Sites
- 6.3.2.4. Landscaping, Recreational Fields, and Domestic Use
- 6.3.3. Energy Recovery Energy Production
- 6.3.3.1. Heat Generation, Incineration, and Gasification
- 6.3.3.2. Oil and Cement Production
- 6.3.3.3. Commercial Uses
- 6.3.1. Agriculture land Application
- 6.1. Market Analysis, Insights and Forecast - by Type
- 7. Asia Pacific Biosolids Industry Analysis, Insights and Forecast, 2020-2032
- 7.1. Market Analysis, Insights and Forecast - by Type
- 7.1.1. Class A
- 7.1.2. Class A EQ (Exceptional Quality)
- 7.1.3. Class B
- 7.2. Market Analysis, Insights and Forecast - by Form
- 7.2.1. Cakes
- 7.2.2. Liquid
- 7.2.3. Pellet
- 7.3. Market Analysis, Insights and Forecast - by Application
- 7.3.1. Agriculture land Application
- 7.3.1.1. Fertiliz
- 7.3.1.2. Fertilizer for Animal Crop Production - Pastures
- 7.3.2. Non-agricultural Land Application
- 7.3.2.1. Forest Crops (Land Restoration and Forestry)
- 7.3.2.2. Land Reclamation (Roads and Urban Wetlands)
- 7.3.2.3. Reclaiming Mining Sites
- 7.3.2.4. Landscaping, Recreational Fields, and Domestic Use
- 7.3.3. Energy Recovery Energy Production
- 7.3.3.1. Heat Generation, Incineration, and Gasification
- 7.3.3.2. Oil and Cement Production
- 7.3.3.3. Commercial Uses
- 7.3.1. Agriculture land Application
- 7.1. Market Analysis, Insights and Forecast - by Type
- 8. North America Biosolids Industry Analysis, Insights and Forecast, 2020-2032
- 8.1. Market Analysis, Insights and Forecast - by Type
- 8.1.1. Class A
- 8.1.2. Class A EQ (Exceptional Quality)
- 8.1.3. Class B
- 8.2. Market Analysis, Insights and Forecast - by Form
- 8.2.1. Cakes
- 8.2.2. Liquid
- 8.2.3. Pellet
- 8.3. Market Analysis, Insights and Forecast - by Application
- 8.3.1. Agriculture land Application
- 8.3.1.1. Fertiliz
- 8.3.1.2. Fertilizer for Animal Crop Production - Pastures
- 8.3.2. Non-agricultural Land Application
- 8.3.2.1. Forest Crops (Land Restoration and Forestry)
- 8.3.2.2. Land Reclamation (Roads and Urban Wetlands)
- 8.3.2.3. Reclaiming Mining Sites
- 8.3.2.4. Landscaping, Recreational Fields, and Domestic Use
- 8.3.3. Energy Recovery Energy Production
- 8.3.3.1. Heat Generation, Incineration, and Gasification
- 8.3.3.2. Oil and Cement Production
- 8.3.3.3. Commercial Uses
- 8.3.1. Agriculture land Application
- 8.1. Market Analysis, Insights and Forecast - by Type
- 9. Europe Biosolids Industry Analysis, Insights and Forecast, 2020-2032
- 9.1. Market Analysis, Insights and Forecast - by Type
- 9.1.1. Class A
- 9.1.2. Class A EQ (Exceptional Quality)
- 9.1.3. Class B
- 9.2. Market Analysis, Insights and Forecast - by Form
- 9.2.1. Cakes
- 9.2.2. Liquid
- 9.2.3. Pellet
- 9.3. Market Analysis, Insights and Forecast - by Application
- 9.3.1. Agriculture land Application
- 9.3.1.1. Fertiliz
- 9.3.1.2. Fertilizer for Animal Crop Production - Pastures
- 9.3.2. Non-agricultural Land Application
- 9.3.2.1. Forest Crops (Land Restoration and Forestry)
- 9.3.2.2. Land Reclamation (Roads and Urban Wetlands)
- 9.3.2.3. Reclaiming Mining Sites
- 9.3.2.4. Landscaping, Recreational Fields, and Domestic Use
- 9.3.3. Energy Recovery Energy Production
- 9.3.3.1. Heat Generation, Incineration, and Gasification
- 9.3.3.2. Oil and Cement Production
- 9.3.3.3. Commercial Uses
- 9.3.1. Agriculture land Application
- 9.1. Market Analysis, Insights and Forecast - by Type
- 10. South America Biosolids Industry Analysis, Insights and Forecast, 2020-2032
- 10.1. Market Analysis, Insights and Forecast - by Type
- 10.1.1. Class A
- 10.1.2. Class A EQ (Exceptional Quality)
- 10.1.3. Class B
- 10.2. Market Analysis, Insights and Forecast - by Form
- 10.2.1. Cakes
- 10.2.2. Liquid
- 10.2.3. Pellet
- 10.3. Market Analysis, Insights and Forecast - by Application
- 10.3.1. Agriculture land Application
- 10.3.1.1. Fertiliz
- 10.3.1.2. Fertilizer for Animal Crop Production - Pastures
- 10.3.2. Non-agricultural Land Application
- 10.3.2.1. Forest Crops (Land Restoration and Forestry)
- 10.3.2.2. Land Reclamation (Roads and Urban Wetlands)
- 10.3.2.3. Reclaiming Mining Sites
- 10.3.2.4. Landscaping, Recreational Fields, and Domestic Use
- 10.3.3. Energy Recovery Energy Production
- 10.3.3.1. Heat Generation, Incineration, and Gasification
- 10.3.3.2. Oil and Cement Production
- 10.3.3.3. Commercial Uses
- 10.3.1. Agriculture land Application
- 10.1. Market Analysis, Insights and Forecast - by Type
- 11. Middle East and Africa Biosolids Industry Analysis, Insights and Forecast, 2020-2032
- 11.1. Market Analysis, Insights and Forecast - by Type
- 11.1.1. Class A
- 11.1.2. Class A EQ (Exceptional Quality)
- 11.1.3. Class B
- 11.2. Market Analysis, Insights and Forecast - by Form
- 11.2.1. Cakes
- 11.2.2. Liquid
- 11.2.3. Pellet
- 11.3. Market Analysis, Insights and Forecast - by Application
- 11.3.1. Agriculture land Application
- 11.3.1.1. Fertiliz
- 11.3.1.2. Fertilizer for Animal Crop Production - Pastures
- 11.3.2. Non-agricultural Land Application
- 11.3.2.1. Forest Crops (Land Restoration and Forestry)
- 11.3.2.2. Land Reclamation (Roads and Urban Wetlands)
- 11.3.2.3. Reclaiming Mining Sites
- 11.3.2.4. Landscaping, Recreational Fields, and Domestic Use
- 11.3.3. Energy Recovery Energy Production
- 11.3.3.1. Heat Generation, Incineration, and Gasification
- 11.3.3.2. Oil and Cement Production
- 11.3.3.3. Commercial Uses
- 11.3.1. Agriculture land Application
- 11.1. Market Analysis, Insights and Forecast - by Type
- 12. Competitive Analysis
- 12.1. Company Profiles
- 12.1.1 Walker Industries*List Not Exhaustive
- 12.1.1.1. Company Overview
- 12.1.1.2. Products
- 12.1.1.3. Company Financials
- 12.1.1.4. SWOT Analysis
- 12.1.2 Cambi ASA
- 12.1.2.1. Company Overview
- 12.1.2.2. Products
- 12.1.2.3. Company Financials
- 12.1.2.4. SWOT Analysis
- 12.1.3 Eco-trass
- 12.1.3.1. Company Overview
- 12.1.3.2. Products
- 12.1.3.3. Company Financials
- 12.1.3.4. SWOT Analysis
- 12.1.4 DC Water
- 12.1.4.1. Company Overview
- 12.1.4.2. Products
- 12.1.4.3. Company Financials
- 12.1.4.4. SWOT Analysis
- 12.1.5 Recyc Systems Inc
- 12.1.5.1. Company Overview
- 12.1.5.2. Products
- 12.1.5.3. Company Financials
- 12.1.5.4. SWOT Analysis
- 12.1.6 BCR Environmental
- 12.1.6.1. Company Overview
- 12.1.6.2. Products
- 12.1.6.3. Company Financials
- 12.1.6.4. SWOT Analysis
- 12.1.7 Aguas Andinas SA
- 12.1.7.1. Company Overview
- 12.1.7.2. Products
- 12.1.7.3. Company Financials
- 12.1.7.4. SWOT Analysis
- 12.1.8 Cleanaway
- 12.1.8.1. Company Overview
- 12.1.8.2. Products
- 12.1.8.3. Company Financials
- 12.1.8.4. SWOT Analysis
- 12.1.9 SYLVIS
- 12.1.9.1. Company Overview
- 12.1.9.2. Products
- 12.1.9.3. Company Financials
- 12.1.9.4. SWOT Analysis
- 12.1.10 Casella Waste Systems Inc
- 12.1.10.1. Company Overview
- 12.1.10.2. Products
- 12.1.10.3. Company Financials
- 12.1.10.4. SWOT Analysis
- 12.1.11 Englobe
- 12.1.11.1. Company Overview
- 12.1.11.2. Products
- 12.1.11.3. Company Financials
- 12.1.11.4. SWOT Analysis
- 12.1.12 Agrivert Ltd
- 12.1.12.1. Company Overview
- 12.1.12.2. Products
- 12.1.12.3. Company Financials
- 12.1.12.4. SWOT Analysis
- 12.1.13 Saur
- 12.1.13.1. Company Overview
- 12.1.13.2. Products
- 12.1.13.3. Company Financials
- 12.1.13.4. SWOT Analysis
- 12.1.14 Alan Srl
- 12.1.14.1. Company Overview
- 12.1.14.2. Products
- 12.1.14.3. Company Financials
- 12.1.14.4. SWOT Analysis
- 12.1.15 Lystek International
- 12.1.15.1. Company Overview
- 12.1.15.2. Products
- 12.1.15.3. Company Financials
- 12.1.15.4. SWOT Analysis
- 12.1.16 REMONDIS SE & Co KG
- 12.1.16.1. Company Overview
- 12.1.16.2. Products
- 12.1.16.3. Company Financials
- 12.1.16.4. SWOT Analysis
- 12.1.17 FCC Group
- 12.1.17.1. Company Overview
- 12.1.17.2. Products
- 12.1.17.3. Company Financials
- 12.1.17.4. SWOT Analysis
- 12.1.18 Synagro Technologies
- 12.1.18.1. Company Overview
- 12.1.18.2. Products
- 12.1.18.3. Company Financials
- 12.1.18.4. SWOT Analysis
- 12.1.19 C R E - Centro di Ricerche Ecologiche
- 12.1.19.1. Company Overview
- 12.1.19.2. Products
- 12.1.19.3. Company Financials
- 12.1.19.4. SWOT Analysis
- 12.1.20 Parker Ag Services LLC
- 12.1.20.1. Company Overview
- 12.1.20.2. Products
- 12.1.20.3. Company Financials
- 12.1.20.4. SWOT Analysis
- 12.1.21 Terrapure BR Ltd
- 12.1.21.1. Company Overview
- 12.1.21.2. Products
- 12.1.21.3. Company Financials
- 12.1.21.4. SWOT Analysis
- 12.1.22 Merrell Bros Inc
- 12.1.22.1. Company Overview
- 12.1.22.2. Products
- 12.1.22.3. Company Financials
- 12.1.22.4. SWOT Analysis
- 12.1.23 Allevi Srl
- 12.1.23.1. Company Overview
- 12.1.23.2. Products
- 12.1.23.3. Company Financials
- 12.1.23.4. SWOT Analysis
- 12.1.1 Walker Industries*List Not Exhaustive
- 12.2. Market Entropy
- 12.2.1 Company's Key Areas Served
- 12.2.2 Recent Developments
- 12.3. Company Market Share Analysis 2025
- 12.3.1 Top 5 Companies Market Share Analysis
- 12.3.2 Top 3 Companies Market Share Analysis
- 12.4. List of Potential Customers
- 13. Research Methodology
List of Figures
- Figure 1: Global Biosolids Industry Revenue Breakdown (Million, %) by Region 2025 & 2033
- Figure 2: Global Biosolids Industry Volume Breakdown (liter , %) by Region 2025 & 2033
- Figure 3: Asia Pacific Biosolids Industry Revenue (Million), by Type 2025 & 2033
- Figure 4: Asia Pacific Biosolids Industry Volume (liter ), by Type 2025 & 2033
- Figure 5: Asia Pacific Biosolids Industry Revenue Share (%), by Type 2025 & 2033
- Figure 6: Asia Pacific Biosolids Industry Volume Share (%), by Type 2025 & 2033
- Figure 7: Asia Pacific Biosolids Industry Revenue (Million), by Form 2025 & 2033
- Figure 8: Asia Pacific Biosolids Industry Volume (liter ), by Form 2025 & 2033
- Figure 9: Asia Pacific Biosolids Industry Revenue Share (%), by Form 2025 & 2033
- Figure 10: Asia Pacific Biosolids Industry Volume Share (%), by Form 2025 & 2033
- Figure 11: Asia Pacific Biosolids Industry Revenue (Million), by Application 2025 & 2033
- Figure 12: Asia Pacific Biosolids Industry Volume (liter ), by Application 2025 & 2033
- Figure 13: Asia Pacific Biosolids Industry Revenue Share (%), by Application 2025 & 2033
- Figure 14: Asia Pacific Biosolids Industry Volume Share (%), by Application 2025 & 2033
- Figure 15: Asia Pacific Biosolids Industry Revenue (Million), by Country 2025 & 2033
- Figure 16: Asia Pacific Biosolids Industry Volume (liter ), by Country 2025 & 2033
- Figure 17: Asia Pacific Biosolids Industry Revenue Share (%), by Country 2025 & 2033
- Figure 18: Asia Pacific Biosolids Industry Volume Share (%), by Country 2025 & 2033
- Figure 19: North America Biosolids Industry Revenue (Million), by Type 2025 & 2033
- Figure 20: North America Biosolids Industry Volume (liter ), by Type 2025 & 2033
- Figure 21: North America Biosolids Industry Revenue Share (%), by Type 2025 & 2033
- Figure 22: North America Biosolids Industry Volume Share (%), by Type 2025 & 2033
- Figure 23: North America Biosolids Industry Revenue (Million), by Form 2025 & 2033
- Figure 24: North America Biosolids Industry Volume (liter ), by Form 2025 & 2033
- Figure 25: North America Biosolids Industry Revenue Share (%), by Form 2025 & 2033
- Figure 26: North America Biosolids Industry Volume Share (%), by Form 2025 & 2033
- Figure 27: North America Biosolids Industry Revenue (Million), by Application 2025 & 2033
- Figure 28: North America Biosolids Industry Volume (liter ), by Application 2025 & 2033
- Figure 29: North America Biosolids Industry Revenue Share (%), by Application 2025 & 2033
- Figure 30: North America Biosolids Industry Volume Share (%), by Application 2025 & 2033
- Figure 31: North America Biosolids Industry Revenue (Million), by Country 2025 & 2033
- Figure 32: North America Biosolids Industry Volume (liter ), by Country 2025 & 2033
- Figure 33: North America Biosolids Industry Revenue Share (%), by Country 2025 & 2033
- Figure 34: North America Biosolids Industry Volume Share (%), by Country 2025 & 2033
- Figure 35: Europe Biosolids Industry Revenue (Million), by Type 2025 & 2033
- Figure 36: Europe Biosolids Industry Volume (liter ), by Type 2025 & 2033
- Figure 37: Europe Biosolids Industry Revenue Share (%), by Type 2025 & 2033
- Figure 38: Europe Biosolids Industry Volume Share (%), by Type 2025 & 2033
- Figure 39: Europe Biosolids Industry Revenue (Million), by Form 2025 & 2033
- Figure 40: Europe Biosolids Industry Volume (liter ), by Form 2025 & 2033
- Figure 41: Europe Biosolids Industry Revenue Share (%), by Form 2025 & 2033
- Figure 42: Europe Biosolids Industry Volume Share (%), by Form 2025 & 2033
- Figure 43: Europe Biosolids Industry Revenue (Million), by Application 2025 & 2033
- Figure 44: Europe Biosolids Industry Volume (liter ), by Application 2025 & 2033
- Figure 45: Europe Biosolids Industry Revenue Share (%), by Application 2025 & 2033
- Figure 46: Europe Biosolids Industry Volume Share (%), by Application 2025 & 2033
- Figure 47: Europe Biosolids Industry Revenue (Million), by Country 2025 & 2033
- Figure 48: Europe Biosolids Industry Volume (liter ), by Country 2025 & 2033
- Figure 49: Europe Biosolids Industry Revenue Share (%), by Country 2025 & 2033
- Figure 50: Europe Biosolids Industry Volume Share (%), by Country 2025 & 2033
- Figure 51: South America Biosolids Industry Revenue (Million), by Type 2025 & 2033
- Figure 52: South America Biosolids Industry Volume (liter ), by Type 2025 & 2033
- Figure 53: South America Biosolids Industry Revenue Share (%), by Type 2025 & 2033
- Figure 54: South America Biosolids Industry Volume Share (%), by Type 2025 & 2033
- Figure 55: South America Biosolids Industry Revenue (Million), by Form 2025 & 2033
- Figure 56: South America Biosolids Industry Volume (liter ), by Form 2025 & 2033
- Figure 57: South America Biosolids Industry Revenue Share (%), by Form 2025 & 2033
- Figure 58: South America Biosolids Industry Volume Share (%), by Form 2025 & 2033
- Figure 59: South America Biosolids Industry Revenue (Million), by Application 2025 & 2033
- Figure 60: South America Biosolids Industry Volume (liter ), by Application 2025 & 2033
- Figure 61: South America Biosolids Industry Revenue Share (%), by Application 2025 & 2033
- Figure 62: South America Biosolids Industry Volume Share (%), by Application 2025 & 2033
- Figure 63: South America Biosolids Industry Revenue (Million), by Country 2025 & 2033
- Figure 64: South America Biosolids Industry Volume (liter ), by Country 2025 & 2033
- Figure 65: South America Biosolids Industry Revenue Share (%), by Country 2025 & 2033
- Figure 66: South America Biosolids Industry Volume Share (%), by Country 2025 & 2033
- Figure 67: Middle East and Africa Biosolids Industry Revenue (Million), by Type 2025 & 2033
- Figure 68: Middle East and Africa Biosolids Industry Volume (liter ), by Type 2025 & 2033
- Figure 69: Middle East and Africa Biosolids Industry Revenue Share (%), by Type 2025 & 2033
- Figure 70: Middle East and Africa Biosolids Industry Volume Share (%), by Type 2025 & 2033
- Figure 71: Middle East and Africa Biosolids Industry Revenue (Million), by Form 2025 & 2033
- Figure 72: Middle East and Africa Biosolids Industry Volume (liter ), by Form 2025 & 2033
- Figure 73: Middle East and Africa Biosolids Industry Revenue Share (%), by Form 2025 & 2033
- Figure 74: Middle East and Africa Biosolids Industry Volume Share (%), by Form 2025 & 2033
- Figure 75: Middle East and Africa Biosolids Industry Revenue (Million), by Application 2025 & 2033
- Figure 76: Middle East and Africa Biosolids Industry Volume (liter ), by Application 2025 & 2033
- Figure 77: Middle East and Africa Biosolids Industry Revenue Share (%), by Application 2025 & 2033
- Figure 78: Middle East and Africa Biosolids Industry Volume Share (%), by Application 2025 & 2033
- Figure 79: Middle East and Africa Biosolids Industry Revenue (Million), by Country 2025 & 2033
- Figure 80: Middle East and Africa Biosolids Industry Volume (liter ), by Country 2025 & 2033
- Figure 81: Middle East and Africa Biosolids Industry Revenue Share (%), by Country 2025 & 2033
- Figure 82: Middle East and Africa Biosolids Industry Volume Share (%), by Country 2025 & 2033
List of Tables
- Table 1: Global Biosolids Industry Revenue Million Forecast, by Type 2020 & 2033
- Table 2: Global Biosolids Industry Volume liter Forecast, by Type 2020 & 2033
- Table 3: Global Biosolids Industry Revenue Million Forecast, by Form 2020 & 2033
- Table 4: Global Biosolids Industry Volume liter Forecast, by Form 2020 & 2033
- Table 5: Global Biosolids Industry Revenue Million Forecast, by Application 2020 & 2033
- Table 6: Global Biosolids Industry Volume liter Forecast, by Application 2020 & 2033
- Table 7: Global Biosolids Industry Revenue Million Forecast, by Region 2020 & 2033
- Table 8: Global Biosolids Industry Volume liter Forecast, by Region 2020 & 2033
- Table 9: Global Biosolids Industry Revenue Million Forecast, by Type 2020 & 2033
- Table 10: Global Biosolids Industry Volume liter Forecast, by Type 2020 & 2033
- Table 11: Global Biosolids Industry Revenue Million Forecast, by Form 2020 & 2033
- Table 12: Global Biosolids Industry Volume liter Forecast, by Form 2020 & 2033
- Table 13: Global Biosolids Industry Revenue Million Forecast, by Application 2020 & 2033
- Table 14: Global Biosolids Industry Volume liter Forecast, by Application 2020 & 2033
- Table 15: Global Biosolids Industry Revenue Million Forecast, by Country 2020 & 2033
- Table 16: Global Biosolids Industry Volume liter Forecast, by Country 2020 & 2033
- Table 17: China Biosolids Industry Revenue (Million) Forecast, by Application 2020 & 2033
- Table 18: China Biosolids Industry Volume (liter ) Forecast, by Application 2020 & 2033
- Table 19: India Biosolids Industry Revenue (Million) Forecast, by Application 2020 & 2033
- Table 20: India Biosolids Industry Volume (liter ) Forecast, by Application 2020 & 2033
- Table 21: Japan Biosolids Industry Revenue (Million) Forecast, by Application 2020 & 2033
- Table 22: Japan Biosolids Industry Volume (liter ) Forecast, by Application 2020 & 2033
- Table 23: South Korea Biosolids Industry Revenue (Million) Forecast, by Application 2020 & 2033
- Table 24: South Korea Biosolids Industry Volume (liter ) Forecast, by Application 2020 & 2033
- Table 25: Malaysia Biosolids Industry Revenue (Million) Forecast, by Application 2020 & 2033
- Table 26: Malaysia Biosolids Industry Volume (liter ) Forecast, by Application 2020 & 2033
- Table 27: Thailand Biosolids Industry Revenue (Million) Forecast, by Application 2020 & 2033
- Table 28: Thailand Biosolids Industry Volume (liter ) Forecast, by Application 2020 & 2033
- Table 29: Indonesia Biosolids Industry Revenue (Million) Forecast, by Application 2020 & 2033
- Table 30: Indonesia Biosolids Industry Volume (liter ) Forecast, by Application 2020 & 2033
- Table 31: Vietnam Biosolids Industry Revenue (Million) Forecast, by Application 2020 & 2033
- Table 32: Vietnam Biosolids Industry Volume (liter ) Forecast, by Application 2020 & 2033
- Table 33: Rest of Asia Pacific Biosolids Industry Revenue (Million) Forecast, by Application 2020 & 2033
- Table 34: Rest of Asia Pacific Biosolids Industry Volume (liter ) Forecast, by Application 2020 & 2033
- Table 35: Global Biosolids Industry Revenue Million Forecast, by Type 2020 & 2033
- Table 36: Global Biosolids Industry Volume liter Forecast, by Type 2020 & 2033
- Table 37: Global Biosolids Industry Revenue Million Forecast, by Form 2020 & 2033
- Table 38: Global Biosolids Industry Volume liter Forecast, by Form 2020 & 2033
- Table 39: Global Biosolids Industry Revenue Million Forecast, by Application 2020 & 2033
- Table 40: Global Biosolids Industry Volume liter Forecast, by Application 2020 & 2033
- Table 41: Global Biosolids Industry Revenue Million Forecast, by Country 2020 & 2033
- Table 42: Global Biosolids Industry Volume liter Forecast, by Country 2020 & 2033
- Table 43: United States Biosolids Industry Revenue (Million) Forecast, by Application 2020 & 2033
- Table 44: United States Biosolids Industry Volume (liter ) Forecast, by Application 2020 & 2033
- Table 45: Canada Biosolids Industry Revenue (Million) Forecast, by Application 2020 & 2033
- Table 46: Canada Biosolids Industry Volume (liter ) Forecast, by Application 2020 & 2033
- Table 47: Mexico Biosolids Industry Revenue (Million) Forecast, by Application 2020 & 2033
- Table 48: Mexico Biosolids Industry Volume (liter ) Forecast, by Application 2020 & 2033
- Table 49: Global Biosolids Industry Revenue Million Forecast, by Type 2020 & 2033
- Table 50: Global Biosolids Industry Volume liter Forecast, by Type 2020 & 2033
- Table 51: Global Biosolids Industry Revenue Million Forecast, by Form 2020 & 2033
- Table 52: Global Biosolids Industry Volume liter Forecast, by Form 2020 & 2033
- Table 53: Global Biosolids Industry Revenue Million Forecast, by Application 2020 & 2033
- Table 54: Global Biosolids Industry Volume liter Forecast, by Application 2020 & 2033
- Table 55: Global Biosolids Industry Revenue Million Forecast, by Country 2020 & 2033
- Table 56: Global Biosolids Industry Volume liter Forecast, by Country 2020 & 2033
- Table 57: Germany Biosolids Industry Revenue (Million) Forecast, by Application 2020 & 2033
- Table 58: Germany Biosolids Industry Volume (liter ) Forecast, by Application 2020 & 2033
- Table 59: United Kingdom Biosolids Industry Revenue (Million) Forecast, by Application 2020 & 2033
- Table 60: United Kingdom Biosolids Industry Volume (liter ) Forecast, by Application 2020 & 2033
- Table 61: Italy Biosolids Industry Revenue (Million) Forecast, by Application 2020 & 2033
- Table 62: Italy Biosolids Industry Volume (liter ) Forecast, by Application 2020 & 2033
- Table 63: France Biosolids Industry Revenue (Million) Forecast, by Application 2020 & 2033
- Table 64: France Biosolids Industry Volume (liter ) Forecast, by Application 2020 & 2033
- Table 65: Spain Biosolids Industry Revenue (Million) Forecast, by Application 2020 & 2033
- Table 66: Spain Biosolids Industry Volume (liter ) Forecast, by Application 2020 & 2033
- Table 67: NORDIC Biosolids Industry Revenue (Million) Forecast, by Application 2020 & 2033
- Table 68: NORDIC Biosolids Industry Volume (liter ) Forecast, by Application 2020 & 2033
- Table 69: Turkey Biosolids Industry Revenue (Million) Forecast, by Application 2020 & 2033
- Table 70: Turkey Biosolids Industry Volume (liter ) Forecast, by Application 2020 & 2033
- Table 71: Russia Biosolids Industry Revenue (Million) Forecast, by Application 2020 & 2033
- Table 72: Russia Biosolids Industry Volume (liter ) Forecast, by Application 2020 & 2033
- Table 73: Rest of Europe Biosolids Industry Revenue (Million) Forecast, by Application 2020 & 2033
- Table 74: Rest of Europe Biosolids Industry Volume (liter ) Forecast, by Application 2020 & 2033
- Table 75: Global Biosolids Industry Revenue Million Forecast, by Type 2020 & 2033
- Table 76: Global Biosolids Industry Volume liter Forecast, by Type 2020 & 2033
- Table 77: Global Biosolids Industry Revenue Million Forecast, by Form 2020 & 2033
- Table 78: Global Biosolids Industry Volume liter Forecast, by Form 2020 & 2033
- Table 79: Global Biosolids Industry Revenue Million Forecast, by Application 2020 & 2033
- Table 80: Global Biosolids Industry Volume liter Forecast, by Application 2020 & 2033
- Table 81: Global Biosolids Industry Revenue Million Forecast, by Country 2020 & 2033
- Table 82: Global Biosolids Industry Volume liter Forecast, by Country 2020 & 2033
- Table 83: Brazil Biosolids Industry Revenue (Million) Forecast, by Application 2020 & 2033
- Table 84: Brazil Biosolids Industry Volume (liter ) Forecast, by Application 2020 & 2033
- Table 85: Argentina Biosolids Industry Revenue (Million) Forecast, by Application 2020 & 2033
- Table 86: Argentina Biosolids Industry Volume (liter ) Forecast, by Application 2020 & 2033
- Table 87: Colombia Biosolids Industry Revenue (Million) Forecast, by Application 2020 & 2033
- Table 88: Colombia Biosolids Industry Volume (liter ) Forecast, by Application 2020 & 2033
- Table 89: Rest of South America Biosolids Industry Revenue (Million) Forecast, by Application 2020 & 2033
- Table 90: Rest of South America Biosolids Industry Volume (liter ) Forecast, by Application 2020 & 2033
- Table 91: Global Biosolids Industry Revenue Million Forecast, by Type 2020 & 2033
- Table 92: Global Biosolids Industry Volume liter Forecast, by Type 2020 & 2033
- Table 93: Global Biosolids Industry Revenue Million Forecast, by Form 2020 & 2033
- Table 94: Global Biosolids Industry Volume liter Forecast, by Form 2020 & 2033
- Table 95: Global Biosolids Industry Revenue Million Forecast, by Application 2020 & 2033
- Table 96: Global Biosolids Industry Volume liter Forecast, by Application 2020 & 2033
- Table 97: Global Biosolids Industry Revenue Million Forecast, by Country 2020 & 2033
- Table 98: Global Biosolids Industry Volume liter Forecast, by Country 2020 & 2033
- Table 99: Saudi Arabia Biosolids Industry Revenue (Million) Forecast, by Application 2020 & 2033
- Table 100: Saudi Arabia Biosolids Industry Volume (liter ) Forecast, by Application 2020 & 2033
- Table 101: South Africa Biosolids Industry Revenue (Million) Forecast, by Application 2020 & 2033
- Table 102: South Africa Biosolids Industry Volume (liter ) Forecast, by Application 2020 & 2033
- Table 103: Nigeria Biosolids Industry Revenue (Million) Forecast, by Application 2020 & 2033
- Table 104: Nigeria Biosolids Industry Volume (liter ) Forecast, by Application 2020 & 2033
- Table 105: Qatar Biosolids Industry Revenue (Million) Forecast, by Application 2020 & 2033
- Table 106: Qatar Biosolids Industry Volume (liter ) Forecast, by Application 2020 & 2033
- Table 107: Egypt Biosolids Industry Revenue (Million) Forecast, by Application 2020 & 2033
- Table 108: Egypt Biosolids Industry Volume (liter ) Forecast, by Application 2020 & 2033
- Table 109: United Arab Emirates Biosolids Industry Revenue (Million) Forecast, by Application 2020 & 2033
- Table 110: United Arab Emirates Biosolids Industry Volume (liter ) Forecast, by Application 2020 & 2033
- Table 111: Rest of Middle East and Africa Biosolids Industry Revenue (Million) Forecast, by Application 2020 & 2033
- Table 112: Rest of Middle East and Africa Biosolids Industry Volume (liter ) Forecast, by Application 2020 & 2033
Frequently Asked Questions
1. What is the projected Compound Annual Growth Rate (CAGR) of the Biosolids Industry?
The projected CAGR is approximately > 3.50%.
2. Which companies are prominent players in the Biosolids Industry?
Key companies in the market include Walker Industries*List Not Exhaustive, Cambi ASA, Eco-trass, DC Water, Recyc Systems Inc, BCR Environmental, Aguas Andinas SA, Cleanaway, SYLVIS, Casella Waste Systems Inc, Englobe, Agrivert Ltd, Saur, Alan Srl, Lystek International, REMONDIS SE & Co KG, FCC Group, Synagro Technologies, C R E - Centro di Ricerche Ecologiche, Parker Ag Services LLC, Terrapure BR Ltd, Merrell Bros Inc, Allevi Srl.
3. What are the main segments of the Biosolids Industry?
The market segments include Type, Form, Application.
4. Can you provide details about the market size?
The market size is estimated to be USD 1700 Million as of 2022.
5. What are some drivers contributing to market growth?
Replacing Hazardous Chemical Fertilizers in North America; Stringent Government Emission Laws; Other Drivers.
6. What are the notable trends driving market growth?
Agricultural Land Application to Dominate the Market.
7. Are there any restraints impacting market growth?
Lack of Proper Knowledge and Awareness on Biosolids; Other Restraints.
8. Can you provide examples of recent developments in the market?
January 2023: Synagro Technologies Inc., a provider of biosolids and residual solutions, acquired Burch Hydro Inc., an Ohio-based premier provider of biosolids and lime-residuals management and land application.
9. What pricing options are available for accessing the report?
Pricing options include single-user, multi-user, and enterprise licenses priced at USD 4750, USD 5250, and USD 8750 respectively.
10. Is the market size provided in terms of value or volume?
The market size is provided in terms of value, measured in Million and volume, measured in liter .
11. Are there any specific market keywords associated with the report?
Yes, the market keyword associated with the report is "Biosolids Industry," which aids in identifying and referencing the specific market segment covered.
12. How do I determine which pricing option suits my needs best?
The pricing options vary based on user requirements and access needs. Individual users may opt for single-user licenses, while businesses requiring broader access may choose multi-user or enterprise licenses for cost-effective access to the report.
13. Are there any additional resources or data provided in the Biosolids Industry report?
While the report offers comprehensive insights, it's advisable to review the specific contents or supplementary materials provided to ascertain if additional resources or data are available.
14. How can I stay updated on further developments or reports in the Biosolids Industry?
To stay informed about further developments, trends, and reports in the Biosolids Industry, consider subscribing to industry newsletters, following relevant companies and organizations, or regularly checking reputable industry news sources and publications.
Methodology
Step 1 - Identification of Relevant Samples Size from Population Database


Step 2 - Approaches for Defining Global Market Size (Value, Volume* & Price*)

Note*: In applicable scenarios
Step 3 - Data Sources
Primary Research
- Web Analytics
- Survey Reports
- Research Institute
- Latest Research Reports
- Opinion Leaders
Secondary Research
- Annual Reports
- White Paper
- Latest Press Release
- Industry Association
- Paid Database
- Investor Presentations

Step 4 - Data Triangulation
Involves using different sources of information in order to increase the validity of a study
These sources are likely to be stakeholders in a program - participants, other researchers, program staff, other community members, and so on.
Then we put all data in single framework & apply various statistical tools to find out the dynamic on the market.
During the analysis stage, feedback from the stakeholder groups would be compared to determine areas of agreement as well as areas of divergence