
Key Insights
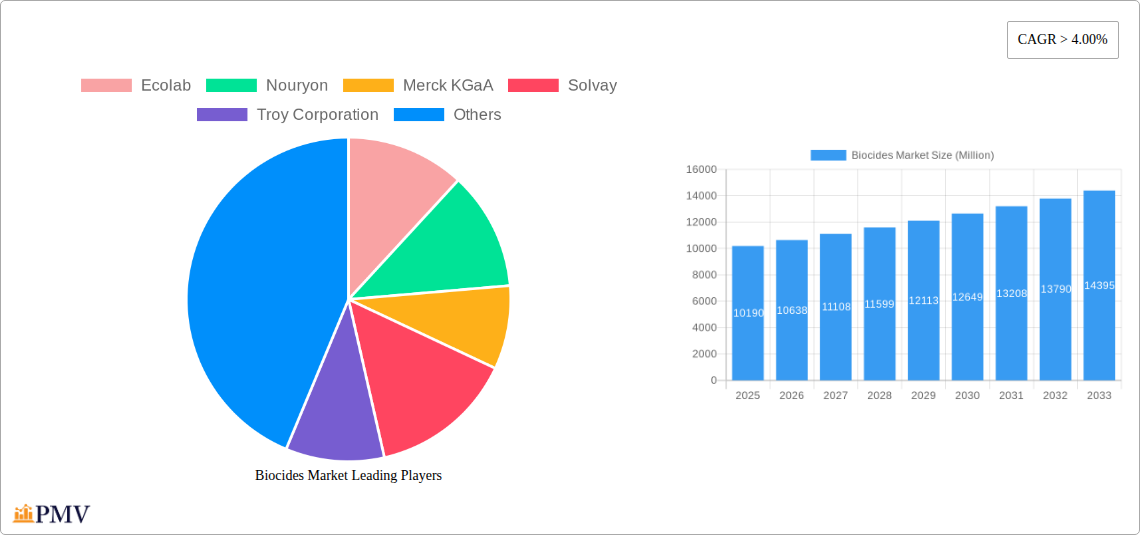
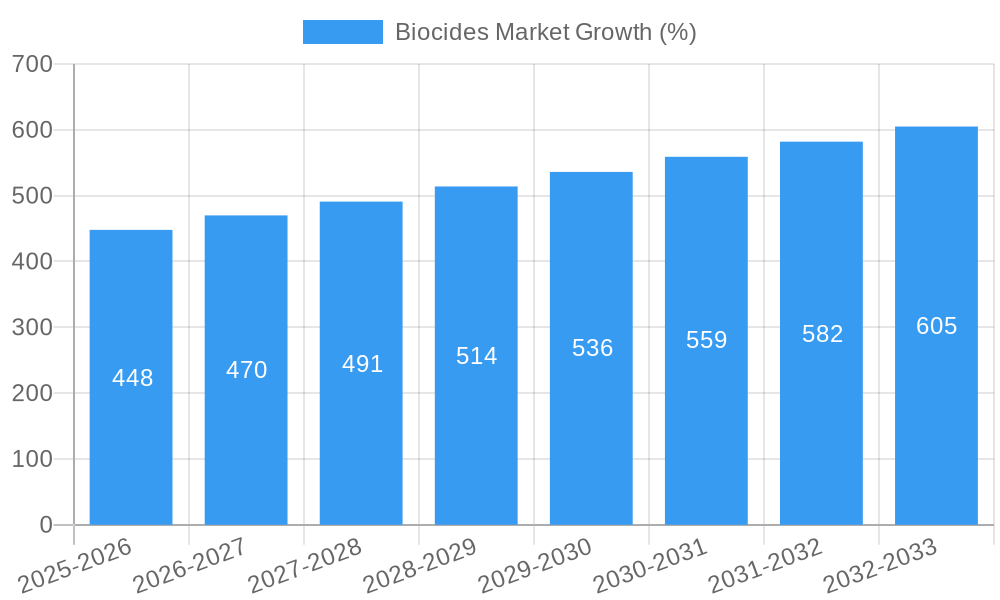
The global biocides market, valued at approximately $10.19 billion in 2025, is projected to experience robust growth, exhibiting a Compound Annual Growth Rate (CAGR) exceeding 4% from 2025 to 2033. This expansion is driven by several key factors. Firstly, the increasing prevalence of waterborne diseases and the rising demand for safe drinking water are significantly boosting the adoption of biocides in water treatment applications. Secondly, the pharmaceutical and personal care industries rely heavily on biocides for preserving product quality and extending shelf life, contributing to market growth. Thirdly, the growing awareness of hygiene and sanitation, particularly in healthcare settings and food processing facilities, is fueling demand for effective disinfectants and sanitizers. The stringent regulations regarding microbial contamination in various industries further solidify the market's growth trajectory. Growth is also supported by advancements in biocide technology, leading to the development of more effective and environmentally friendly formulations.
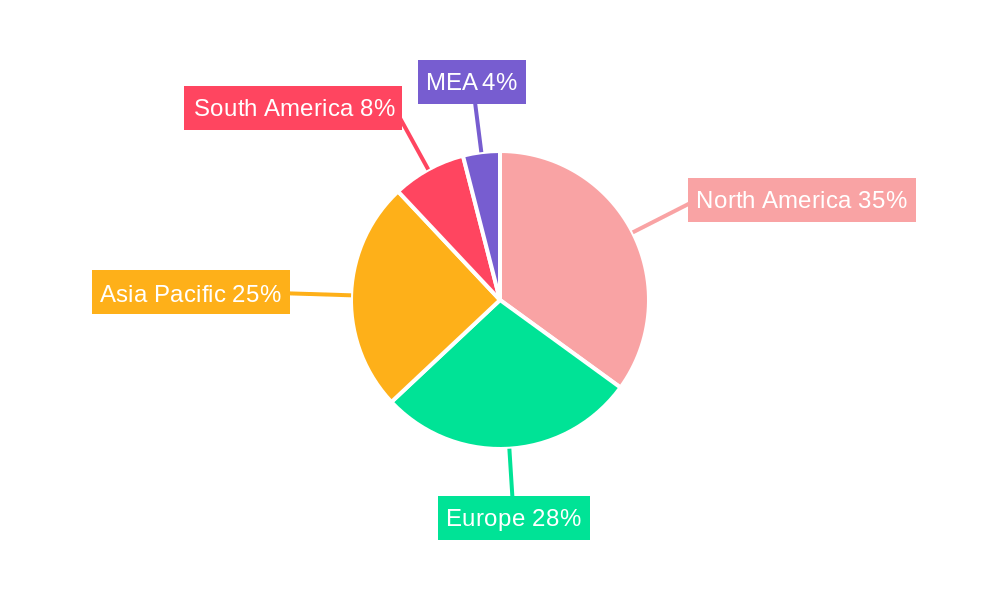
However, the market faces certain restraints. Environmental concerns related to the potential toxicity of some biocides are leading to stricter regulatory frameworks and a push for sustainable alternatives. Fluctuations in raw material prices and the economic climate can also influence market dynamics. Market segmentation reveals a diverse landscape, with halogen compounds, metallic compounds, and organosulfurs dominating the type segment. In terms of applications, water treatment holds a significant share, followed by pharmaceutical and personal care, wood preservation, food and beverage, and paints and coatings. Major players such as Ecolab, Nouryon, Merck KGaA, Solvay, and BASF SE are driving innovation and expanding their market presence through strategic partnerships and acquisitions. Regional analysis indicates strong growth potential in Asia-Pacific, driven by rapid industrialization and urbanization, while North America and Europe maintain significant market shares.
This detailed report provides a comprehensive analysis of the global Biocides Market, offering invaluable insights for stakeholders across the industry. From market sizing and segmentation to competitive dynamics and future growth projections, this report equips you with the knowledge to make informed strategic decisions. Covering the period from 2019 to 2033, with a focus on 2025, this report analyzes historical trends, current market conditions, and future projections. The study period is 2019-2033, with 2025 as the base and estimated year. The forecast period is 2025-2033 and the historical period is 2019-2024.
Biocides Market Market Structure & Competitive Dynamics
The global biocides market is characterized by a moderately concentrated structure, with several multinational corporations holding significant market share. Key players, including Ecolab, Nouryon, Merck KGaA, Solvay, and BASF SE, compete intensely through product innovation, strategic partnerships, and mergers and acquisitions (M&A). The market exhibits a dynamic innovation ecosystem, driven by the need for more effective, sustainable, and environmentally friendly biocidal solutions. Stringent regulatory frameworks, varying across regions, significantly influence market dynamics. The presence of product substitutes, such as natural antimicrobial agents, presents a competitive challenge. End-user trends, particularly toward increased hygiene standards in various sectors, fuel market growth.
M&A activity plays a crucial role in shaping market consolidation. Over the past few years, deal values have fluctuated, with some major acquisitions exceeding xx Million, reflecting the significant strategic value of established biocide portfolios.
- Market Concentration: Moderately concentrated, with top 5 players holding approximately xx% market share.
- Innovation Ecosystems: Active R&D efforts focused on developing novel biocides with enhanced efficacy and reduced environmental impact.
- Regulatory Frameworks: Stringent regulations regarding biocide registration and usage vary significantly across regions, impacting market access and product development.
- Product Substitutes: Growing market share for natural and alternative antimicrobial agents, creating competitive pressure.
- End-User Trends: Increasing demand from sectors such as healthcare, food and beverage, and water treatment driving market growth.
- M&A Activity: Significant M&A activity observed in recent years, with deal values ranging from xx Million to xx Million.
Biocides Market Industry Trends & Insights
The global biocides market is experiencing robust growth, driven by several key factors. The rising global population, coupled with urbanization, is leading to increased demand for effective antimicrobial solutions across various sectors. Stringent hygiene standards in healthcare and food processing industries are further bolstering market growth. Technological advancements, such as the development of novel biocides with improved efficacy and lower toxicity, are fueling market expansion. Consumer preferences are shifting towards environmentally friendly biocides, resulting in increased demand for sustainable solutions. The market is expected to exhibit a CAGR of xx% during the forecast period (2025-2033), with market penetration projected to reach xx% by 2033. However, competitive dynamics, including pricing pressures and the emergence of substitutes, pose ongoing challenges.
Dominant Markets & Segments in Biocides Market
The North American region currently dominates the biocides market, followed by Europe and Asia-Pacific. This dominance stems from factors including robust economic growth, advanced infrastructure, and stringent hygiene regulations. Within the different segments, the water treatment application is the largest, followed by the pharmaceutical and personal care sector. The halogen compounds segment holds a significant market share due to its broad applicability and established efficacy.
- Leading Region: North America
- Key Drivers for North American Dominance:
- Strong economic growth
- Well-developed infrastructure
- Stringent regulatory frameworks emphasizing hygiene and sanitation
- Largest Application Segment: Water Treatment
- Driven by increasing demand for clean and safe drinking water, as well as industrial water treatment applications.
- Largest Type Segment: Halogen Compounds
- Established efficacy and wide applicability in various applications.
Biocides Market Product Innovations
Recent product developments in the biocides market focus on improving efficacy, reducing toxicity, and enhancing sustainability. This includes the development of novel formulations with broader antimicrobial activity, targeted delivery systems to enhance efficacy, and environmentally friendly biocides derived from natural sources. Technological trends, such as nanotechnology and biotechnology, are playing a crucial role in driving product innovation, tailoring biocides for specific applications, and improving their market fit.
Report Segmentation & Scope
The report segments the biocides market by type (Halogen Compounds, Metallic Compounds, Organosulfurs, Organic Acids, Phenolics, Other Types (Quaternary Ammonium-based Compounds)) and application (Water Treatment, Pharmaceutical and Personal Care, Wood Preservation, Food and Beverage, Paints and Coatings, Other Applications (Disinfectant and Sanitization)). Each segment's growth projection, market size, and competitive landscape are analyzed in detail, providing a comprehensive overview of the market structure and dynamics. Market sizes for each segment are projected to grow significantly over the forecast period, driven by increasing demand and technological advancements. Competitive dynamics vary across segments, with some segments exhibiting a higher degree of concentration than others.
Key Drivers of Biocides Market Growth
Several factors are driving the growth of the biocides market, including:
- Stringent hygiene regulations: Increasing regulatory pressure on industries to maintain stringent hygiene standards is driving demand for effective biocides.
- Rising concerns about infectious diseases: The growing incidence of infectious diseases is fueling the need for more effective antimicrobial solutions.
- Technological advancements: Ongoing innovations in biocide formulation and delivery systems are enhancing efficacy and market penetration.
- Expanding applications: The use of biocides is expanding into new application areas, such as coatings and construction materials.
Challenges in the Biocides Market Sector
The biocides market faces several challenges:
- Stringent regulatory approvals: The lengthy and complex regulatory approval process for new biocides can hinder market entry.
- Concerns about environmental impact: Growing concerns about the environmental impact of certain biocides are driving demand for greener alternatives.
- Price fluctuations in raw materials: Fluctuations in the prices of raw materials can affect the profitability of biocide manufacturers.
- Intense competition: The market is characterized by intense competition among established players and new entrants.
Leading Players in the Biocides Market Market
- Ecolab
- Nouryon
- Merck KGaA
- Solvay
- Troy Corporation
- Kemipex
- BASF SE
- SUEZ
- Kemira
- Dow
- Valtris Specialty Chemicals
- BWA WATER ADDITIVES
- The Lubrizol Corporation
- Baker Hughes Company
- Lonza
- Thor
- Veolia
- Albemarle Corporation
Key Developments in Biocides Market Sector
- March 2024: UNIVAR SOLUTIONS LLC expands its biocide offerings in Brazil’s paints, coatings, and lubricants markets through a new distribution contract with Arxada.
- March 2023: KRAHN Chemie expands its biocide business cooperation with LANXESS, broadening its reach in Germany, Austria, Belgium, and the Netherlands.
- August 2022: Veolia Water Technologies partners with Bridgnorth Aluminium to provide water treatment and Legionella compliance services.
Strategic Biocides Market Market Outlook
The biocides market is poised for continued growth, driven by increasing demand from various sectors, technological advancements, and evolving regulatory landscapes. Strategic opportunities exist for companies to develop and market innovative, sustainable biocides that meet the evolving needs of consumers and industries. Focusing on product differentiation, strengthening supply chain resilience, and navigating evolving regulatory landscapes will be critical for success in this dynamic market.
Biocides Market Segmentation
-
1. Type
- 1.1. Halogen Compounds
- 1.2. Metallic Compounds
- 1.3. Organosulfurs
- 1.4. Organic Acids
- 1.5. Phenolics
- 1.6. Other Types (Quaternary Ammonium-based Compounds)
-
2. Application
- 2.1. Water Treatment
- 2.2. Pharmaceutical and Personal Care
- 2.3. Wood Preservation
- 2.4. Food and Beverage
- 2.5. Paints and Coatings
- 2.6. Other Applications (Disinfectant and Sanitization)
Biocides Market Segmentation By Geography
-
1. Asia Pacific
- 1.1. China
- 1.2. India
- 1.3. Japan
- 1.4. South Korea
- 1.5. Thailand
- 1.6. Malaysia
- 1.7. Indonesia
- 1.8. Vietnam
- 1.9. Rest of Asia Pacific
-
2. North America
- 2.1. United States
- 2.2. Canada
- 2.3. Mexico
-
3. Europe
- 3.1. Germany
- 3.2. United Kingdom
- 3.3. Italy
- 3.4. France
- 3.5. Spain
- 3.6. Russia
- 3.7. Turkey
- 3.8. NORDIC
- 3.9. Rest of Europe
-
4. South America
- 4.1. Brazil
- 4.2. Argentina
- 4.3. Colombia
- 4.4. Rest of South America
-
5. Middle East and Africa
- 5.1. Saudi Arabia
- 5.2. South Africa
- 5.3. Nigeria
- 5.4. Qatar
- 5.5. Egypt
- 5.6. UAE
- 5.7. Rest of Middle East and Africa
Biocides Market REPORT HIGHLIGHTS
| Aspects | Details |
|---|---|
| Study Period | 2019-2033 |
| Base Year | 2024 |
| Estimated Year | 2025 |
| Forecast Period | 2025-2033 |
| Historical Period | 2019-2024 |
| Growth Rate | CAGR of > 4.00% from 2019-2033 |
| Segmentation |
|
Table of Contents
- 1. Introduction
- 1.1. Research Scope
- 1.2. Market Segmentation
- 1.3. Research Methodology
- 1.4. Definitions and Assumptions
- 2. Executive Summary
- 2.1. Introduction
- 3. Market Dynamics
- 3.1. Introduction
- 3.2. Market Drivers
- 3.2.1. Increasing Demand for Water Treatment Globally; Growing Demand From the Food and Beverage Industry
- 3.3. Market Restrains
- 3.3.1. Environmental Issues and Health Hazards Related to Biocides; Other Restraints
- 3.4. Market Trends
- 3.4.1. The Water Treatment Segment is Expected to Dominate the Market
- 4. Market Factor Analysis
- 4.1. Porters Five Forces
- 4.2. Supply/Value Chain
- 4.3. PESTEL analysis
- 4.4. Market Entropy
- 4.5. Patent/Trademark Analysis
- 5. Global Biocides Market Analysis, Insights and Forecast, 2019-2031
- 5.1. Market Analysis, Insights and Forecast - by Type
- 5.1.1. Halogen Compounds
- 5.1.2. Metallic Compounds
- 5.1.3. Organosulfurs
- 5.1.4. Organic Acids
- 5.1.5. Phenolics
- 5.1.6. Other Types (Quaternary Ammonium-based Compounds)
- 5.2. Market Analysis, Insights and Forecast - by Application
- 5.2.1. Water Treatment
- 5.2.2. Pharmaceutical and Personal Care
- 5.2.3. Wood Preservation
- 5.2.4. Food and Beverage
- 5.2.5. Paints and Coatings
- 5.2.6. Other Applications (Disinfectant and Sanitization)
- 5.3. Market Analysis, Insights and Forecast - by Region
- 5.3.1. Asia Pacific
- 5.3.2. North America
- 5.3.3. Europe
- 5.3.4. South America
- 5.3.5. Middle East and Africa
- 5.1. Market Analysis, Insights and Forecast - by Type
- 6. Asia Pacific Biocides Market Analysis, Insights and Forecast, 2019-2031
- 6.1. Market Analysis, Insights and Forecast - by Type
- 6.1.1. Halogen Compounds
- 6.1.2. Metallic Compounds
- 6.1.3. Organosulfurs
- 6.1.4. Organic Acids
- 6.1.5. Phenolics
- 6.1.6. Other Types (Quaternary Ammonium-based Compounds)
- 6.2. Market Analysis, Insights and Forecast - by Application
- 6.2.1. Water Treatment
- 6.2.2. Pharmaceutical and Personal Care
- 6.2.3. Wood Preservation
- 6.2.4. Food and Beverage
- 6.2.5. Paints and Coatings
- 6.2.6. Other Applications (Disinfectant and Sanitization)
- 6.1. Market Analysis, Insights and Forecast - by Type
- 7. North America Biocides Market Analysis, Insights and Forecast, 2019-2031
- 7.1. Market Analysis, Insights and Forecast - by Type
- 7.1.1. Halogen Compounds
- 7.1.2. Metallic Compounds
- 7.1.3. Organosulfurs
- 7.1.4. Organic Acids
- 7.1.5. Phenolics
- 7.1.6. Other Types (Quaternary Ammonium-based Compounds)
- 7.2. Market Analysis, Insights and Forecast - by Application
- 7.2.1. Water Treatment
- 7.2.2. Pharmaceutical and Personal Care
- 7.2.3. Wood Preservation
- 7.2.4. Food and Beverage
- 7.2.5. Paints and Coatings
- 7.2.6. Other Applications (Disinfectant and Sanitization)
- 7.1. Market Analysis, Insights and Forecast - by Type
- 8. Europe Biocides Market Analysis, Insights and Forecast, 2019-2031
- 8.1. Market Analysis, Insights and Forecast - by Type
- 8.1.1. Halogen Compounds
- 8.1.2. Metallic Compounds
- 8.1.3. Organosulfurs
- 8.1.4. Organic Acids
- 8.1.5. Phenolics
- 8.1.6. Other Types (Quaternary Ammonium-based Compounds)
- 8.2. Market Analysis, Insights and Forecast - by Application
- 8.2.1. Water Treatment
- 8.2.2. Pharmaceutical and Personal Care
- 8.2.3. Wood Preservation
- 8.2.4. Food and Beverage
- 8.2.5. Paints and Coatings
- 8.2.6. Other Applications (Disinfectant and Sanitization)
- 8.1. Market Analysis, Insights and Forecast - by Type
- 9. South America Biocides Market Analysis, Insights and Forecast, 2019-2031
- 9.1. Market Analysis, Insights and Forecast - by Type
- 9.1.1. Halogen Compounds
- 9.1.2. Metallic Compounds
- 9.1.3. Organosulfurs
- 9.1.4. Organic Acids
- 9.1.5. Phenolics
- 9.1.6. Other Types (Quaternary Ammonium-based Compounds)
- 9.2. Market Analysis, Insights and Forecast - by Application
- 9.2.1. Water Treatment
- 9.2.2. Pharmaceutical and Personal Care
- 9.2.3. Wood Preservation
- 9.2.4. Food and Beverage
- 9.2.5. Paints and Coatings
- 9.2.6. Other Applications (Disinfectant and Sanitization)
- 9.1. Market Analysis, Insights and Forecast - by Type
- 10. Middle East and Africa Biocides Market Analysis, Insights and Forecast, 2019-2031
- 10.1. Market Analysis, Insights and Forecast - by Type
- 10.1.1. Halogen Compounds
- 10.1.2. Metallic Compounds
- 10.1.3. Organosulfurs
- 10.1.4. Organic Acids
- 10.1.5. Phenolics
- 10.1.6. Other Types (Quaternary Ammonium-based Compounds)
- 10.2. Market Analysis, Insights and Forecast - by Application
- 10.2.1. Water Treatment
- 10.2.2. Pharmaceutical and Personal Care
- 10.2.3. Wood Preservation
- 10.2.4. Food and Beverage
- 10.2.5. Paints and Coatings
- 10.2.6. Other Applications (Disinfectant and Sanitization)
- 10.1. Market Analysis, Insights and Forecast - by Type
- 11. North America Biocides Market Analysis, Insights and Forecast, 2019-2031
- 11.1. Market Analysis, Insights and Forecast - By Country/Sub-region
- 11.1.1 United States
- 11.1.2 Canada
- 11.1.3 Mexico
- 12. Europe Biocides Market Analysis, Insights and Forecast, 2019-2031
- 12.1. Market Analysis, Insights and Forecast - By Country/Sub-region
- 12.1.1 Germany
- 12.1.2 France
- 12.1.3 Italy
- 12.1.4 United Kingdom
- 12.1.5 Netherlands
- 12.1.6 Rest of Europe
- 13. Asia Pacific Biocides Market Analysis, Insights and Forecast, 2019-2031
- 13.1. Market Analysis, Insights and Forecast - By Country/Sub-region
- 13.1.1 China
- 13.1.2 Japan
- 13.1.3 India
- 13.1.4 South Korea
- 13.1.5 Taiwan
- 13.1.6 Australia
- 13.1.7 Rest of Asia-Pacific
- 14. South America Biocides Market Analysis, Insights and Forecast, 2019-2031
- 14.1. Market Analysis, Insights and Forecast - By Country/Sub-region
- 14.1.1 Brazil
- 14.1.2 Argentina
- 14.1.3 Rest of South America
- 15. MEA Biocides Market Analysis, Insights and Forecast, 2019-2031
- 15.1. Market Analysis, Insights and Forecast - By Country/Sub-region
- 15.1.1 Middle East
- 15.1.2 Africa
- 16. Competitive Analysis
- 16.1. Global Market Share Analysis 2024
- 16.2. Company Profiles
- 16.2.1 Ecolab
- 16.2.1.1. Overview
- 16.2.1.2. Products
- 16.2.1.3. SWOT Analysis
- 16.2.1.4. Recent Developments
- 16.2.1.5. Financials (Based on Availability)
- 16.2.2 Nouryon
- 16.2.2.1. Overview
- 16.2.2.2. Products
- 16.2.2.3. SWOT Analysis
- 16.2.2.4. Recent Developments
- 16.2.2.5. Financials (Based on Availability)
- 16.2.3 Merck KGaA
- 16.2.3.1. Overview
- 16.2.3.2. Products
- 16.2.3.3. SWOT Analysis
- 16.2.3.4. Recent Developments
- 16.2.3.5. Financials (Based on Availability)
- 16.2.4 Solvay
- 16.2.4.1. Overview
- 16.2.4.2. Products
- 16.2.4.3. SWOT Analysis
- 16.2.4.4. Recent Developments
- 16.2.4.5. Financials (Based on Availability)
- 16.2.5 Troy Corporation
- 16.2.5.1. Overview
- 16.2.5.2. Products
- 16.2.5.3. SWOT Analysis
- 16.2.5.4. Recent Developments
- 16.2.5.5. Financials (Based on Availability)
- 16.2.6 Kemipex
- 16.2.6.1. Overview
- 16.2.6.2. Products
- 16.2.6.3. SWOT Analysis
- 16.2.6.4. Recent Developments
- 16.2.6.5. Financials (Based on Availability)
- 16.2.7 BASF SE
- 16.2.7.1. Overview
- 16.2.7.2. Products
- 16.2.7.3. SWOT Analysis
- 16.2.7.4. Recent Developments
- 16.2.7.5. Financials (Based on Availability)
- 16.2.8 SUEZ
- 16.2.8.1. Overview
- 16.2.8.2. Products
- 16.2.8.3. SWOT Analysis
- 16.2.8.4. Recent Developments
- 16.2.8.5. Financials (Based on Availability)
- 16.2.9 Kemira
- 16.2.9.1. Overview
- 16.2.9.2. Products
- 16.2.9.3. SWOT Analysis
- 16.2.9.4. Recent Developments
- 16.2.9.5. Financials (Based on Availability)
- 16.2.10 Dow
- 16.2.10.1. Overview
- 16.2.10.2. Products
- 16.2.10.3. SWOT Analysis
- 16.2.10.4. Recent Developments
- 16.2.10.5. Financials (Based on Availability)
- 16.2.11 Valtris Specialty Chemicals
- 16.2.11.1. Overview
- 16.2.11.2. Products
- 16.2.11.3. SWOT Analysis
- 16.2.11.4. Recent Developments
- 16.2.11.5. Financials (Based on Availability)
- 16.2.12 BWA WATER ADDITIVES
- 16.2.12.1. Overview
- 16.2.12.2. Products
- 16.2.12.3. SWOT Analysis
- 16.2.12.4. Recent Developments
- 16.2.12.5. Financials (Based on Availability)
- 16.2.13 The Lubrizol Corporation
- 16.2.13.1. Overview
- 16.2.13.2. Products
- 16.2.13.3. SWOT Analysis
- 16.2.13.4. Recent Developments
- 16.2.13.5. Financials (Based on Availability)
- 16.2.14 Baker Hughes Company
- 16.2.14.1. Overview
- 16.2.14.2. Products
- 16.2.14.3. SWOT Analysis
- 16.2.14.4. Recent Developments
- 16.2.14.5. Financials (Based on Availability)
- 16.2.15 Lonza
- 16.2.15.1. Overview
- 16.2.15.2. Products
- 16.2.15.3. SWOT Analysis
- 16.2.15.4. Recent Developments
- 16.2.15.5. Financials (Based on Availability)
- 16.2.16 Thor
- 16.2.16.1. Overview
- 16.2.16.2. Products
- 16.2.16.3. SWOT Analysis
- 16.2.16.4. Recent Developments
- 16.2.16.5. Financials (Based on Availability)
- 16.2.17 Veolia
- 16.2.17.1. Overview
- 16.2.17.2. Products
- 16.2.17.3. SWOT Analysis
- 16.2.17.4. Recent Developments
- 16.2.17.5. Financials (Based on Availability)
- 16.2.18 Albemarle Corporation
- 16.2.18.1. Overview
- 16.2.18.2. Products
- 16.2.18.3. SWOT Analysis
- 16.2.18.4. Recent Developments
- 16.2.18.5. Financials (Based on Availability)
- 16.2.1 Ecolab
List of Figures
- Figure 1: Global Biocides Market Revenue Breakdown (Million, %) by Region 2024 & 2032
- Figure 2: Global Biocides Market Volume Breakdown (K Tons, %) by Region 2024 & 2032
- Figure 3: North America Biocides Market Revenue (Million), by Country 2024 & 2032
- Figure 4: North America Biocides Market Volume (K Tons), by Country 2024 & 2032
- Figure 5: North America Biocides Market Revenue Share (%), by Country 2024 & 2032
- Figure 6: North America Biocides Market Volume Share (%), by Country 2024 & 2032
- Figure 7: Europe Biocides Market Revenue (Million), by Country 2024 & 2032
- Figure 8: Europe Biocides Market Volume (K Tons), by Country 2024 & 2032
- Figure 9: Europe Biocides Market Revenue Share (%), by Country 2024 & 2032
- Figure 10: Europe Biocides Market Volume Share (%), by Country 2024 & 2032
- Figure 11: Asia Pacific Biocides Market Revenue (Million), by Country 2024 & 2032
- Figure 12: Asia Pacific Biocides Market Volume (K Tons), by Country 2024 & 2032
- Figure 13: Asia Pacific Biocides Market Revenue Share (%), by Country 2024 & 2032
- Figure 14: Asia Pacific Biocides Market Volume Share (%), by Country 2024 & 2032
- Figure 15: South America Biocides Market Revenue (Million), by Country 2024 & 2032
- Figure 16: South America Biocides Market Volume (K Tons), by Country 2024 & 2032
- Figure 17: South America Biocides Market Revenue Share (%), by Country 2024 & 2032
- Figure 18: South America Biocides Market Volume Share (%), by Country 2024 & 2032
- Figure 19: MEA Biocides Market Revenue (Million), by Country 2024 & 2032
- Figure 20: MEA Biocides Market Volume (K Tons), by Country 2024 & 2032
- Figure 21: MEA Biocides Market Revenue Share (%), by Country 2024 & 2032
- Figure 22: MEA Biocides Market Volume Share (%), by Country 2024 & 2032
- Figure 23: Asia Pacific Biocides Market Revenue (Million), by Type 2024 & 2032
- Figure 24: Asia Pacific Biocides Market Volume (K Tons), by Type 2024 & 2032
- Figure 25: Asia Pacific Biocides Market Revenue Share (%), by Type 2024 & 2032
- Figure 26: Asia Pacific Biocides Market Volume Share (%), by Type 2024 & 2032
- Figure 27: Asia Pacific Biocides Market Revenue (Million), by Application 2024 & 2032
- Figure 28: Asia Pacific Biocides Market Volume (K Tons), by Application 2024 & 2032
- Figure 29: Asia Pacific Biocides Market Revenue Share (%), by Application 2024 & 2032
- Figure 30: Asia Pacific Biocides Market Volume Share (%), by Application 2024 & 2032
- Figure 31: Asia Pacific Biocides Market Revenue (Million), by Country 2024 & 2032
- Figure 32: Asia Pacific Biocides Market Volume (K Tons), by Country 2024 & 2032
- Figure 33: Asia Pacific Biocides Market Revenue Share (%), by Country 2024 & 2032
- Figure 34: Asia Pacific Biocides Market Volume Share (%), by Country 2024 & 2032
- Figure 35: North America Biocides Market Revenue (Million), by Type 2024 & 2032
- Figure 36: North America Biocides Market Volume (K Tons), by Type 2024 & 2032
- Figure 37: North America Biocides Market Revenue Share (%), by Type 2024 & 2032
- Figure 38: North America Biocides Market Volume Share (%), by Type 2024 & 2032
- Figure 39: North America Biocides Market Revenue (Million), by Application 2024 & 2032
- Figure 40: North America Biocides Market Volume (K Tons), by Application 2024 & 2032
- Figure 41: North America Biocides Market Revenue Share (%), by Application 2024 & 2032
- Figure 42: North America Biocides Market Volume Share (%), by Application 2024 & 2032
- Figure 43: North America Biocides Market Revenue (Million), by Country 2024 & 2032
- Figure 44: North America Biocides Market Volume (K Tons), by Country 2024 & 2032
- Figure 45: North America Biocides Market Revenue Share (%), by Country 2024 & 2032
- Figure 46: North America Biocides Market Volume Share (%), by Country 2024 & 2032
- Figure 47: Europe Biocides Market Revenue (Million), by Type 2024 & 2032
- Figure 48: Europe Biocides Market Volume (K Tons), by Type 2024 & 2032
- Figure 49: Europe Biocides Market Revenue Share (%), by Type 2024 & 2032
- Figure 50: Europe Biocides Market Volume Share (%), by Type 2024 & 2032
- Figure 51: Europe Biocides Market Revenue (Million), by Application 2024 & 2032
- Figure 52: Europe Biocides Market Volume (K Tons), by Application 2024 & 2032
- Figure 53: Europe Biocides Market Revenue Share (%), by Application 2024 & 2032
- Figure 54: Europe Biocides Market Volume Share (%), by Application 2024 & 2032
- Figure 55: Europe Biocides Market Revenue (Million), by Country 2024 & 2032
- Figure 56: Europe Biocides Market Volume (K Tons), by Country 2024 & 2032
- Figure 57: Europe Biocides Market Revenue Share (%), by Country 2024 & 2032
- Figure 58: Europe Biocides Market Volume Share (%), by Country 2024 & 2032
- Figure 59: South America Biocides Market Revenue (Million), by Type 2024 & 2032
- Figure 60: South America Biocides Market Volume (K Tons), by Type 2024 & 2032
- Figure 61: South America Biocides Market Revenue Share (%), by Type 2024 & 2032
- Figure 62: South America Biocides Market Volume Share (%), by Type 2024 & 2032
- Figure 63: South America Biocides Market Revenue (Million), by Application 2024 & 2032
- Figure 64: South America Biocides Market Volume (K Tons), by Application 2024 & 2032
- Figure 65: South America Biocides Market Revenue Share (%), by Application 2024 & 2032
- Figure 66: South America Biocides Market Volume Share (%), by Application 2024 & 2032
- Figure 67: South America Biocides Market Revenue (Million), by Country 2024 & 2032
- Figure 68: South America Biocides Market Volume (K Tons), by Country 2024 & 2032
- Figure 69: South America Biocides Market Revenue Share (%), by Country 2024 & 2032
- Figure 70: South America Biocides Market Volume Share (%), by Country 2024 & 2032
- Figure 71: Middle East and Africa Biocides Market Revenue (Million), by Type 2024 & 2032
- Figure 72: Middle East and Africa Biocides Market Volume (K Tons), by Type 2024 & 2032
- Figure 73: Middle East and Africa Biocides Market Revenue Share (%), by Type 2024 & 2032
- Figure 74: Middle East and Africa Biocides Market Volume Share (%), by Type 2024 & 2032
- Figure 75: Middle East and Africa Biocides Market Revenue (Million), by Application 2024 & 2032
- Figure 76: Middle East and Africa Biocides Market Volume (K Tons), by Application 2024 & 2032
- Figure 77: Middle East and Africa Biocides Market Revenue Share (%), by Application 2024 & 2032
- Figure 78: Middle East and Africa Biocides Market Volume Share (%), by Application 2024 & 2032
- Figure 79: Middle East and Africa Biocides Market Revenue (Million), by Country 2024 & 2032
- Figure 80: Middle East and Africa Biocides Market Volume (K Tons), by Country 2024 & 2032
- Figure 81: Middle East and Africa Biocides Market Revenue Share (%), by Country 2024 & 2032
- Figure 82: Middle East and Africa Biocides Market Volume Share (%), by Country 2024 & 2032
List of Tables
- Table 1: Global Biocides Market Revenue Million Forecast, by Region 2019 & 2032
- Table 2: Global Biocides Market Volume K Tons Forecast, by Region 2019 & 2032
- Table 3: Global Biocides Market Revenue Million Forecast, by Type 2019 & 2032
- Table 4: Global Biocides Market Volume K Tons Forecast, by Type 2019 & 2032
- Table 5: Global Biocides Market Revenue Million Forecast, by Application 2019 & 2032
- Table 6: Global Biocides Market Volume K Tons Forecast, by Application 2019 & 2032
- Table 7: Global Biocides Market Revenue Million Forecast, by Region 2019 & 2032
- Table 8: Global Biocides Market Volume K Tons Forecast, by Region 2019 & 2032
- Table 9: Global Biocides Market Revenue Million Forecast, by Country 2019 & 2032
- Table 10: Global Biocides Market Volume K Tons Forecast, by Country 2019 & 2032
- Table 11: United States Biocides Market Revenue (Million) Forecast, by Application 2019 & 2032
- Table 12: United States Biocides Market Volume (K Tons) Forecast, by Application 2019 & 2032
- Table 13: Canada Biocides Market Revenue (Million) Forecast, by Application 2019 & 2032
- Table 14: Canada Biocides Market Volume (K Tons) Forecast, by Application 2019 & 2032
- Table 15: Mexico Biocides Market Revenue (Million) Forecast, by Application 2019 & 2032
- Table 16: Mexico Biocides Market Volume (K Tons) Forecast, by Application 2019 & 2032
- Table 17: Global Biocides Market Revenue Million Forecast, by Country 2019 & 2032
- Table 18: Global Biocides Market Volume K Tons Forecast, by Country 2019 & 2032
- Table 19: Germany Biocides Market Revenue (Million) Forecast, by Application 2019 & 2032
- Table 20: Germany Biocides Market Volume (K Tons) Forecast, by Application 2019 & 2032
- Table 21: France Biocides Market Revenue (Million) Forecast, by Application 2019 & 2032
- Table 22: France Biocides Market Volume (K Tons) Forecast, by Application 2019 & 2032
- Table 23: Italy Biocides Market Revenue (Million) Forecast, by Application 2019 & 2032
- Table 24: Italy Biocides Market Volume (K Tons) Forecast, by Application 2019 & 2032
- Table 25: United Kingdom Biocides Market Revenue (Million) Forecast, by Application 2019 & 2032
- Table 26: United Kingdom Biocides Market Volume (K Tons) Forecast, by Application 2019 & 2032
- Table 27: Netherlands Biocides Market Revenue (Million) Forecast, by Application 2019 & 2032
- Table 28: Netherlands Biocides Market Volume (K Tons) Forecast, by Application 2019 & 2032
- Table 29: Rest of Europe Biocides Market Revenue (Million) Forecast, by Application 2019 & 2032
- Table 30: Rest of Europe Biocides Market Volume (K Tons) Forecast, by Application 2019 & 2032
- Table 31: Global Biocides Market Revenue Million Forecast, by Country 2019 & 2032
- Table 32: Global Biocides Market Volume K Tons Forecast, by Country 2019 & 2032
- Table 33: China Biocides Market Revenue (Million) Forecast, by Application 2019 & 2032
- Table 34: China Biocides Market Volume (K Tons) Forecast, by Application 2019 & 2032
- Table 35: Japan Biocides Market Revenue (Million) Forecast, by Application 2019 & 2032
- Table 36: Japan Biocides Market Volume (K Tons) Forecast, by Application 2019 & 2032
- Table 37: India Biocides Market Revenue (Million) Forecast, by Application 2019 & 2032
- Table 38: India Biocides Market Volume (K Tons) Forecast, by Application 2019 & 2032
- Table 39: South Korea Biocides Market Revenue (Million) Forecast, by Application 2019 & 2032
- Table 40: South Korea Biocides Market Volume (K Tons) Forecast, by Application 2019 & 2032
- Table 41: Taiwan Biocides Market Revenue (Million) Forecast, by Application 2019 & 2032
- Table 42: Taiwan Biocides Market Volume (K Tons) Forecast, by Application 2019 & 2032
- Table 43: Australia Biocides Market Revenue (Million) Forecast, by Application 2019 & 2032
- Table 44: Australia Biocides Market Volume (K Tons) Forecast, by Application 2019 & 2032
- Table 45: Rest of Asia-Pacific Biocides Market Revenue (Million) Forecast, by Application 2019 & 2032
- Table 46: Rest of Asia-Pacific Biocides Market Volume (K Tons) Forecast, by Application 2019 & 2032
- Table 47: Global Biocides Market Revenue Million Forecast, by Country 2019 & 2032
- Table 48: Global Biocides Market Volume K Tons Forecast, by Country 2019 & 2032
- Table 49: Brazil Biocides Market Revenue (Million) Forecast, by Application 2019 & 2032
- Table 50: Brazil Biocides Market Volume (K Tons) Forecast, by Application 2019 & 2032
- Table 51: Argentina Biocides Market Revenue (Million) Forecast, by Application 2019 & 2032
- Table 52: Argentina Biocides Market Volume (K Tons) Forecast, by Application 2019 & 2032
- Table 53: Rest of South America Biocides Market Revenue (Million) Forecast, by Application 2019 & 2032
- Table 54: Rest of South America Biocides Market Volume (K Tons) Forecast, by Application 2019 & 2032
- Table 55: Global Biocides Market Revenue Million Forecast, by Country 2019 & 2032
- Table 56: Global Biocides Market Volume K Tons Forecast, by Country 2019 & 2032
- Table 57: Middle East Biocides Market Revenue (Million) Forecast, by Application 2019 & 2032
- Table 58: Middle East Biocides Market Volume (K Tons) Forecast, by Application 2019 & 2032
- Table 59: Africa Biocides Market Revenue (Million) Forecast, by Application 2019 & 2032
- Table 60: Africa Biocides Market Volume (K Tons) Forecast, by Application 2019 & 2032
- Table 61: Global Biocides Market Revenue Million Forecast, by Type 2019 & 2032
- Table 62: Global Biocides Market Volume K Tons Forecast, by Type 2019 & 2032
- Table 63: Global Biocides Market Revenue Million Forecast, by Application 2019 & 2032
- Table 64: Global Biocides Market Volume K Tons Forecast, by Application 2019 & 2032
- Table 65: Global Biocides Market Revenue Million Forecast, by Country 2019 & 2032
- Table 66: Global Biocides Market Volume K Tons Forecast, by Country 2019 & 2032
- Table 67: China Biocides Market Revenue (Million) Forecast, by Application 2019 & 2032
- Table 68: China Biocides Market Volume (K Tons) Forecast, by Application 2019 & 2032
- Table 69: India Biocides Market Revenue (Million) Forecast, by Application 2019 & 2032
- Table 70: India Biocides Market Volume (K Tons) Forecast, by Application 2019 & 2032
- Table 71: Japan Biocides Market Revenue (Million) Forecast, by Application 2019 & 2032
- Table 72: Japan Biocides Market Volume (K Tons) Forecast, by Application 2019 & 2032
- Table 73: South Korea Biocides Market Revenue (Million) Forecast, by Application 2019 & 2032
- Table 74: South Korea Biocides Market Volume (K Tons) Forecast, by Application 2019 & 2032
- Table 75: Thailand Biocides Market Revenue (Million) Forecast, by Application 2019 & 2032
- Table 76: Thailand Biocides Market Volume (K Tons) Forecast, by Application 2019 & 2032
- Table 77: Malaysia Biocides Market Revenue (Million) Forecast, by Application 2019 & 2032
- Table 78: Malaysia Biocides Market Volume (K Tons) Forecast, by Application 2019 & 2032
- Table 79: Indonesia Biocides Market Revenue (Million) Forecast, by Application 2019 & 2032
- Table 80: Indonesia Biocides Market Volume (K Tons) Forecast, by Application 2019 & 2032
- Table 81: Vietnam Biocides Market Revenue (Million) Forecast, by Application 2019 & 2032
- Table 82: Vietnam Biocides Market Volume (K Tons) Forecast, by Application 2019 & 2032
- Table 83: Rest of Asia Pacific Biocides Market Revenue (Million) Forecast, by Application 2019 & 2032
- Table 84: Rest of Asia Pacific Biocides Market Volume (K Tons) Forecast, by Application 2019 & 2032
- Table 85: Global Biocides Market Revenue Million Forecast, by Type 2019 & 2032
- Table 86: Global Biocides Market Volume K Tons Forecast, by Type 2019 & 2032
- Table 87: Global Biocides Market Revenue Million Forecast, by Application 2019 & 2032
- Table 88: Global Biocides Market Volume K Tons Forecast, by Application 2019 & 2032
- Table 89: Global Biocides Market Revenue Million Forecast, by Country 2019 & 2032
- Table 90: Global Biocides Market Volume K Tons Forecast, by Country 2019 & 2032
- Table 91: United States Biocides Market Revenue (Million) Forecast, by Application 2019 & 2032
- Table 92: United States Biocides Market Volume (K Tons) Forecast, by Application 2019 & 2032
- Table 93: Canada Biocides Market Revenue (Million) Forecast, by Application 2019 & 2032
- Table 94: Canada Biocides Market Volume (K Tons) Forecast, by Application 2019 & 2032
- Table 95: Mexico Biocides Market Revenue (Million) Forecast, by Application 2019 & 2032
- Table 96: Mexico Biocides Market Volume (K Tons) Forecast, by Application 2019 & 2032
- Table 97: Global Biocides Market Revenue Million Forecast, by Type 2019 & 2032
- Table 98: Global Biocides Market Volume K Tons Forecast, by Type 2019 & 2032
- Table 99: Global Biocides Market Revenue Million Forecast, by Application 2019 & 2032
- Table 100: Global Biocides Market Volume K Tons Forecast, by Application 2019 & 2032
- Table 101: Global Biocides Market Revenue Million Forecast, by Country 2019 & 2032
- Table 102: Global Biocides Market Volume K Tons Forecast, by Country 2019 & 2032
- Table 103: Germany Biocides Market Revenue (Million) Forecast, by Application 2019 & 2032
- Table 104: Germany Biocides Market Volume (K Tons) Forecast, by Application 2019 & 2032
- Table 105: United Kingdom Biocides Market Revenue (Million) Forecast, by Application 2019 & 2032
- Table 106: United Kingdom Biocides Market Volume (K Tons) Forecast, by Application 2019 & 2032
- Table 107: Italy Biocides Market Revenue (Million) Forecast, by Application 2019 & 2032
- Table 108: Italy Biocides Market Volume (K Tons) Forecast, by Application 2019 & 2032
- Table 109: France Biocides Market Revenue (Million) Forecast, by Application 2019 & 2032
- Table 110: France Biocides Market Volume (K Tons) Forecast, by Application 2019 & 2032
- Table 111: Spain Biocides Market Revenue (Million) Forecast, by Application 2019 & 2032
- Table 112: Spain Biocides Market Volume (K Tons) Forecast, by Application 2019 & 2032
- Table 113: Russia Biocides Market Revenue (Million) Forecast, by Application 2019 & 2032
- Table 114: Russia Biocides Market Volume (K Tons) Forecast, by Application 2019 & 2032
- Table 115: Turkey Biocides Market Revenue (Million) Forecast, by Application 2019 & 2032
- Table 116: Turkey Biocides Market Volume (K Tons) Forecast, by Application 2019 & 2032
- Table 117: NORDIC Biocides Market Revenue (Million) Forecast, by Application 2019 & 2032
- Table 118: NORDIC Biocides Market Volume (K Tons) Forecast, by Application 2019 & 2032
- Table 119: Rest of Europe Biocides Market Revenue (Million) Forecast, by Application 2019 & 2032
- Table 120: Rest of Europe Biocides Market Volume (K Tons) Forecast, by Application 2019 & 2032
- Table 121: Global Biocides Market Revenue Million Forecast, by Type 2019 & 2032
- Table 122: Global Biocides Market Volume K Tons Forecast, by Type 2019 & 2032
- Table 123: Global Biocides Market Revenue Million Forecast, by Application 2019 & 2032
- Table 124: Global Biocides Market Volume K Tons Forecast, by Application 2019 & 2032
- Table 125: Global Biocides Market Revenue Million Forecast, by Country 2019 & 2032
- Table 126: Global Biocides Market Volume K Tons Forecast, by Country 2019 & 2032
- Table 127: Brazil Biocides Market Revenue (Million) Forecast, by Application 2019 & 2032
- Table 128: Brazil Biocides Market Volume (K Tons) Forecast, by Application 2019 & 2032
- Table 129: Argentina Biocides Market Revenue (Million) Forecast, by Application 2019 & 2032
- Table 130: Argentina Biocides Market Volume (K Tons) Forecast, by Application 2019 & 2032
- Table 131: Colombia Biocides Market Revenue (Million) Forecast, by Application 2019 & 2032
- Table 132: Colombia Biocides Market Volume (K Tons) Forecast, by Application 2019 & 2032
- Table 133: Rest of South America Biocides Market Revenue (Million) Forecast, by Application 2019 & 2032
- Table 134: Rest of South America Biocides Market Volume (K Tons) Forecast, by Application 2019 & 2032
- Table 135: Global Biocides Market Revenue Million Forecast, by Type 2019 & 2032
- Table 136: Global Biocides Market Volume K Tons Forecast, by Type 2019 & 2032
- Table 137: Global Biocides Market Revenue Million Forecast, by Application 2019 & 2032
- Table 138: Global Biocides Market Volume K Tons Forecast, by Application 2019 & 2032
- Table 139: Global Biocides Market Revenue Million Forecast, by Country 2019 & 2032
- Table 140: Global Biocides Market Volume K Tons Forecast, by Country 2019 & 2032
- Table 141: Saudi Arabia Biocides Market Revenue (Million) Forecast, by Application 2019 & 2032
- Table 142: Saudi Arabia Biocides Market Volume (K Tons) Forecast, by Application 2019 & 2032
- Table 143: South Africa Biocides Market Revenue (Million) Forecast, by Application 2019 & 2032
- Table 144: South Africa Biocides Market Volume (K Tons) Forecast, by Application 2019 & 2032
- Table 145: Nigeria Biocides Market Revenue (Million) Forecast, by Application 2019 & 2032
- Table 146: Nigeria Biocides Market Volume (K Tons) Forecast, by Application 2019 & 2032
- Table 147: Qatar Biocides Market Revenue (Million) Forecast, by Application 2019 & 2032
- Table 148: Qatar Biocides Market Volume (K Tons) Forecast, by Application 2019 & 2032
- Table 149: Egypt Biocides Market Revenue (Million) Forecast, by Application 2019 & 2032
- Table 150: Egypt Biocides Market Volume (K Tons) Forecast, by Application 2019 & 2032
- Table 151: UAE Biocides Market Revenue (Million) Forecast, by Application 2019 & 2032
- Table 152: UAE Biocides Market Volume (K Tons) Forecast, by Application 2019 & 2032
- Table 153: Rest of Middle East and Africa Biocides Market Revenue (Million) Forecast, by Application 2019 & 2032
- Table 154: Rest of Middle East and Africa Biocides Market Volume (K Tons) Forecast, by Application 2019 & 2032
Frequently Asked Questions
1. What is the projected Compound Annual Growth Rate (CAGR) of the Biocides Market?
The projected CAGR is approximately > 4.00%.
2. Which companies are prominent players in the Biocides Market?
Key companies in the market include Ecolab, Nouryon, Merck KGaA, Solvay, Troy Corporation, Kemipex, BASF SE, SUEZ, Kemira, Dow, Valtris Specialty Chemicals, BWA WATER ADDITIVES, The Lubrizol Corporation, Baker Hughes Company, Lonza, Thor, Veolia, Albemarle Corporation.
3. What are the main segments of the Biocides Market?
The market segments include Type, Application.
4. Can you provide details about the market size?
The market size is estimated to be USD 10.19 Million as of 2022.
5. What are some drivers contributing to market growth?
Increasing Demand for Water Treatment Globally; Growing Demand From the Food and Beverage Industry.
6. What are the notable trends driving market growth?
The Water Treatment Segment is Expected to Dominate the Market.
7. Are there any restraints impacting market growth?
Environmental Issues and Health Hazards Related to Biocides; Other Restraints.
8. Can you provide examples of recent developments in the market?
March 2024: UNIVAR SOLUTIONS LLC, a global solutions provider of specialized ingredients and chemicals, announced the conclusion of a new distribution contract with Arxada covering a complete portfolio of biocides and preservatives used in a wide range of industrial applications. This new agreement enhances Univar Solutions’ product offerings in Brazil’s paints, coatings, and lubricants markets, adding cost-effective, highly versatile antimicrobials and performance additives specifically designed for preservation and microbial control.
9. What pricing options are available for accessing the report?
Pricing options include single-user, multi-user, and enterprise licenses priced at USD 3,950, USD 4,950, and USD 6,950 respectively.
10. Is the market size provided in terms of value or volume?
The market size is provided in terms of value, measured in Million and volume, measured in K Tons.
11. Are there any specific market keywords associated with the report?
Yes, the market keyword associated with the report is "Biocides Market," which aids in identifying and referencing the specific market segment covered.
12. How do I determine which pricing option suits my needs best?
The pricing options vary based on user requirements and access needs. Individual users may opt for single-user licenses, while businesses requiring broader access may choose multi-user or enterprise licenses for cost-effective access to the report.
13. Are there any additional resources or data provided in the Biocides Market report?
While the report offers comprehensive insights, it's advisable to review the specific contents or supplementary materials provided to ascertain if additional resources or data are available.
14. How can I stay updated on further developments or reports in the Biocides Market?
To stay informed about further developments, trends, and reports in the Biocides Market, consider subscribing to industry newsletters, following relevant companies and organizations, or regularly checking reputable industry news sources and publications.
Methodology
Step 1 - Identification of Relevant Samples Size from Population Database


Step 2 - Approaches for Defining Global Market Size (Value, Volume* & Price*)

Note*: In applicable scenarios
Step 3 - Data Sources
Primary Research
- Web Analytics
- Survey Reports
- Research Institute
- Latest Research Reports
- Opinion Leaders
Secondary Research
- Annual Reports
- White Paper
- Latest Press Release
- Industry Association
- Paid Database
- Investor Presentations

Step 4 - Data Triangulation
Involves using different sources of information in order to increase the validity of a study
These sources are likely to be stakeholders in a program - participants, other researchers, program staff, other community members, and so on.
Then we put all data in single framework & apply various statistical tools to find out the dynamic on the market.
During the analysis stage, feedback from the stakeholder groups would be compared to determine areas of agreement as well as areas of divergence


