
Key Insights
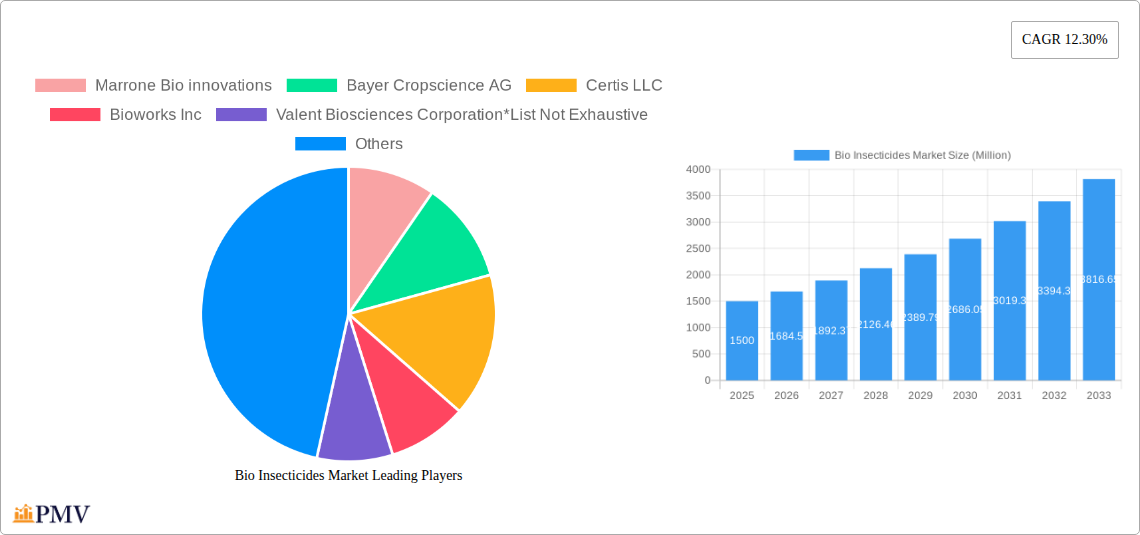
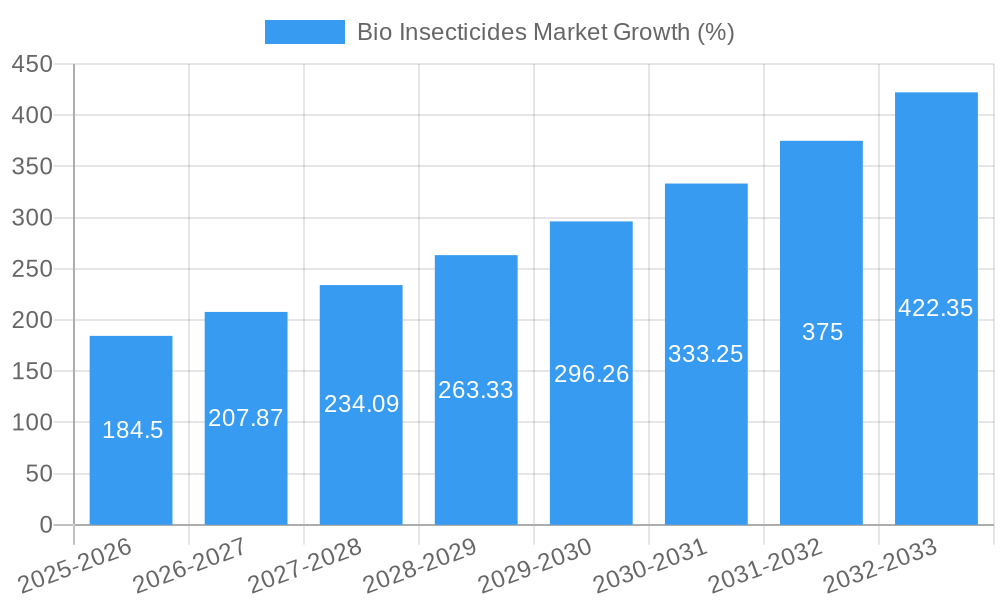
The global bio insecticides market is experiencing robust growth, projected to reach a substantial size by 2033. A compound annual growth rate (CAGR) of 12.30% from 2019 to 2024 indicates a rapidly expanding market driven by increasing consumer demand for eco-friendly agricultural practices, stringent regulations on synthetic pesticides, and growing awareness of the harmful effects of chemical insecticides on human health and the environment. The rising prevalence of insect-borne diseases and the need for sustainable pest management solutions further fuel market expansion. Key application segments include grains & cereals, pulses & oilseeds, commercial crops, and fruits & vegetables, with each segment contributing significantly to overall market value. Leading players like Marrone Bio Innovations, Bayer CropScience AG, and Corteva Agriscience are driving innovation through research and development, focusing on novel biopesticide formulations and delivery systems to enhance efficacy and broaden their application. Market growth is further supported by strategic partnerships, mergers and acquisitions, and increased investments in the biopesticide sector. Geographic expansion, especially in developing economies with high agricultural output, presents significant opportunities for market growth. However, factors such as high initial investment costs, relatively lower efficacy compared to synthetic pesticides in certain applications, and limitations in storage and shelf life represent challenges to overcome.
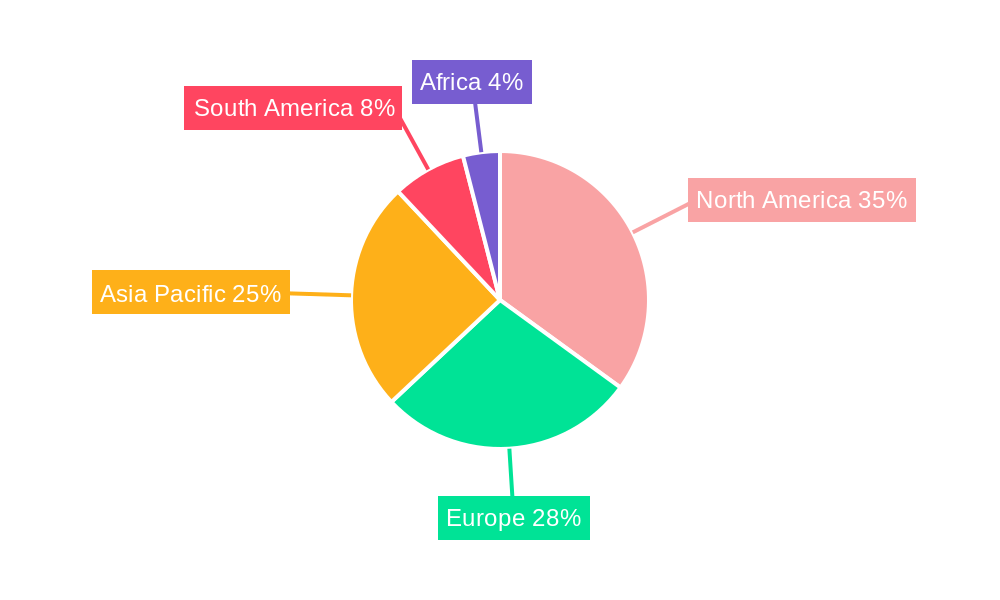
Despite these challenges, the long-term prospects for bio insecticides remain positive. The increasing adoption of integrated pest management (IPM) strategies, which combine biopesticides with other sustainable pest control methods, is expected to drive significant market growth. Furthermore, government initiatives promoting sustainable agriculture and the development of more effective and cost-competitive biopesticide products are expected to propel market expansion. The market is segmented geographically, with North America, Europe, and Asia Pacific representing key regions, exhibiting varied growth rates depending on factors such as regulatory frameworks, agricultural practices, and consumer awareness. The future success of bio insecticide companies will hinge on their ability to address the current limitations, develop innovative products, and effectively engage with farmers and consumers. The focus on enhancing product efficacy, improving shelf-life, and developing effective distribution channels will be critical for sustained market growth.
Bio Insecticides Market: A Comprehensive Analysis (2019-2033)
This comprehensive report provides an in-depth analysis of the global Bio Insecticides Market, offering valuable insights for stakeholders across the agricultural and chemical sectors. The study covers the period 2019-2033, with a focus on the forecast period 2025-2033, using 2025 as the base year. The report projects a market value of xx Million by 2033, showcasing significant growth potential driven by increasing consumer demand for sustainable agriculture and stringent regulations on synthetic pesticides. This detailed analysis incorporates key market segments, competitive landscapes, and future growth projections, empowering businesses to make informed strategic decisions.
Bio Insecticides Market Market Structure & Competitive Dynamics
The Bio Insecticides market exhibits a moderately concentrated structure, with several key players holding significant market share. Marrone Bio Innovations, Bayer CropScience AG, Certis LLC, Bioworks Inc, and Valent Biosciences Corporation are some of the prominent players, though the market also features numerous smaller, specialized companies. Market concentration is influenced by factors such as research and development capabilities, distribution networks, and regulatory approvals. The innovation ecosystem is dynamic, with continuous development of novel bioinsecticides based on microbial agents, botanical extracts, and pheromones. Regulatory frameworks, varying across regions, play a crucial role in market access and product approvals. The market witnesses significant M&A activity, with larger companies acquiring smaller players to expand their product portfolios and market reach. Deal values have ranged from xx Million to xx Million in recent years. The increasing consumer preference for organically produced food and stringent regulations are key factors influencing this consolidation. Product substitutes, such as synthetic insecticides, present ongoing competition, although the growing preference for eco-friendly solutions is bolstering the bioinsecticide market.
- Market Share: Top 5 players hold approximately xx% of the market share in 2025.
- M&A Activity: Significant M&A activity observed in the last 5 years, with an average deal value of xx Million.
- Innovation Ecosystems: Focus on developing next-generation bioinsecticides with enhanced efficacy and broader application.
- Regulatory Landscape: Stringent regulations on chemical pesticides are creating favorable growth opportunities for bioinsecticides.
Bio Insecticides Market Industry Trends & Insights
The global bioinsecticides market is experiencing robust growth, driven by several key factors. The increasing awareness of the environmental hazards associated with synthetic pesticides is a major catalyst, pushing farmers and consumers toward more sustainable alternatives. Government regulations promoting organic farming and sustainable agriculture are further fueling market growth. Technological advancements in biopesticide formulation and delivery systems are improving efficacy and reducing production costs. The market is also witnessing a growing adoption of precision agriculture techniques, enhancing the targeted application of bioinsecticides and maximizing their effectiveness. The increasing prevalence of insect resistance to synthetic pesticides is another key driver, making bioinsecticides an attractive solution. The compound annual growth rate (CAGR) for the bioinsecticides market is projected to be xx% during the forecast period (2025-2033). Market penetration is expected to increase significantly, particularly in developing economies where the demand for food security is high. Competitive dynamics are shaped by innovation, pricing strategies, and distribution networks.
Dominant Markets & Segments in Bio Insecticides Market
The bioinsecticides market shows strong regional variations in dominance. North America currently holds a significant market share, driven by stringent regulations on synthetic pesticides and a strong consumer preference for organic produce. However, Asia-Pacific is expected to witness rapid growth in the forecast period due to increasing agricultural activity and rising consumer awareness. Within application segments, Fruits & Vegetables currently commands the largest market share due to high-value crops and consumer demand. Grains & Cereals segment demonstrates steady growth, reflecting the significant acreage under cultivation globally.
- Key Drivers in North America: Stringent environmental regulations, high consumer demand for organic produce, strong research and development activities.
- Key Drivers in Asia-Pacific: Growing agricultural sector, rising disposable incomes, increasing consumer awareness of environmental issues.
- Fruits & Vegetables Segment: Highest market share due to high value crops and consumer demand for safe produce.
- Grains & Cereals Segment: Steady growth driven by large cultivated areas and increasing demand for safe food grains.
Bio Insecticides Market Product Innovations
Recent innovations in bioinsecticides focus on enhancing their efficacy and expanding their application range. This includes developing novel formulations with improved shelf life and enhanced delivery systems. Companies are also exploring combinations of bioinsecticides with other biocontrol agents to achieve better pest management. These advancements are improving the competitiveness of bioinsecticides against synthetic alternatives, attracting a broader range of end-users.
Report Segmentation & Scope
This report segments the Bio Insecticides Market by application:
- Grains & Cereals: This segment encompasses the use of bioinsecticides in various grain and cereal crops, with projected growth driven by increasing demand for organic grains. Market size in 2025 is estimated at xx Million.
- Pulses & Oilseeds: This segment focuses on the application of bioinsecticides in pulse and oilseed crops, exhibiting moderate growth due to rising consumer preference for healthy oils and pulses. The market size in 2025 is projected at xx Million.
- Commercial Crops: This segment covers the use of bioinsecticides in various cash crops like cotton and coffee, with growth influenced by market prices and consumer preferences. The estimated 2025 market size is xx Million.
- Fruits & Vegetables: This segment holds the largest market share, with consistent growth driven by consumer demand for organically produced fruits and vegetables. Market size is estimated at xx Million in 2025.
- Other Applications: This includes applications in forestry, ornamental plants, and other areas, showing promising growth potential. Estimated at xx Million in 2025.
Key Drivers of Bio Insecticides Market Growth
Several key factors drive the growth of the bioinsecticides market. These include increasing consumer preference for organically produced food, stringent regulations on synthetic pesticides, growing awareness of environmental concerns, and technological advancements leading to more effective and cost-efficient bioinsecticides. Government initiatives promoting sustainable agriculture and increasing investment in research and development further contribute to market expansion.
Challenges in the Bio Insecticides Market Sector
Despite its growth potential, the bioinsecticides market faces several challenges. These include relatively higher production costs compared to synthetic pesticides, inconsistent efficacy across different environmental conditions, and the need for longer application periods. Regulatory hurdles and variations in approval processes across different regions also pose difficulties. Limited shelf life and storage issues also impact the broader adoption of some bioinsecticides.
Leading Players in the Bio Insecticides Market Market
- Marrone Bio Innovations
- Bayer CropScience AG
- Certis LLC
- Bioworks Inc
- Valent Biosciences Corporation
- Isagro Spa
- Corteva Agriscience
- Novozymes AS
- Koppert Biological Systems
- BASF SE
Key Developments in Bio Insecticides Market Sector
- 2023-Q2: Marrone Bio Innovations launched a new bioinsecticide with enhanced efficacy against key pests.
- 2022-Q4: Bayer CropScience AG acquired a smaller biopesticide company, expanding its product portfolio.
- 2021-Q3: New regulations in the EU further restricted the use of certain synthetic insecticides, boosting demand for bioinsecticides. (Further developments to be included in the full report)
Strategic Bio Insecticides Market Market Outlook
The future of the bioinsecticides market is bright, with significant growth potential driven by the increasing adoption of sustainable agriculture practices and growing consumer demand for environmentally friendly products. Strategic opportunities exist for companies that can develop innovative products with enhanced efficacy, cost-effectiveness, and wider applications. Focusing on research and development, strategic partnerships, and effective marketing strategies will be crucial for capturing market share in this rapidly expanding sector. The market presents opportunities for both established players and new entrants to develop and commercialize next-generation bioinsecticides.
Bio Insecticides Market Segmentation
- 1. Production Analysis
- 2. Consumption Analysis
- 3. Import Market Analysis (Value & Volume)
- 4. Export Market Analysis (Value & Volume)
- 5. Price Trend Analysis
Bio Insecticides Market Segmentation By Geography
-
1. North America
- 1.1. United States
- 1.2. Canada
- 1.3. Mexico
-
2. South America
- 2.1. Brazil
- 2.2. Argentina
- 2.3. Rest of South America
-
3. Europe
- 3.1. United Kingdom
- 3.2. Germany
- 3.3. France
- 3.4. Italy
- 3.5. Spain
- 3.6. Russia
- 3.7. Benelux
- 3.8. Nordics
- 3.9. Rest of Europe
-
4. Middle East & Africa
- 4.1. Turkey
- 4.2. Israel
- 4.3. GCC
- 4.4. North Africa
- 4.5. South Africa
- 4.6. Rest of Middle East & Africa
-
5. Asia Pacific
- 5.1. China
- 5.2. India
- 5.3. Japan
- 5.4. South Korea
- 5.5. ASEAN
- 5.6. Oceania
- 5.7. Rest of Asia Pacific
Bio Insecticides Market REPORT HIGHLIGHTS
| Aspects | Details |
|---|---|
| Study Period | 2019-2033 |
| Base Year | 2024 |
| Estimated Year | 2025 |
| Forecast Period | 2025-2033 |
| Historical Period | 2019-2024 |
| Growth Rate | CAGR of 12.30% from 2019-2033 |
| Segmentation |
|
Table of Contents
- 1. Introduction
- 1.1. Research Scope
- 1.2. Market Segmentation
- 1.3. Research Methodology
- 1.4. Definitions and Assumptions
- 2. Executive Summary
- 2.1. Introduction
- 3. Market Dynamics
- 3.1. Introduction
- 3.2. Market Drivers
- 3.2.1. Demand For Landscaping Maintenance; Adoption of Green Spaces and Green Roofs
- 3.3. Market Restrains
- 3.3.1. Shortage of Labor In Landscaping; High Maintenance Cost of Lawn Mowers
- 3.4. Market Trends
- 3.4.1. Fruits and Vegetables Occupy the Largest Share By Application
- 4. Market Factor Analysis
- 4.1. Porters Five Forces
- 4.2. Supply/Value Chain
- 4.3. PESTEL analysis
- 4.4. Market Entropy
- 4.5. Patent/Trademark Analysis
- 5. Global Bio Insecticides Market Analysis, Insights and Forecast, 2019-2031
- 5.1. Market Analysis, Insights and Forecast - by Production Analysis
- 5.2. Market Analysis, Insights and Forecast - by Consumption Analysis
- 5.3. Market Analysis, Insights and Forecast - by Import Market Analysis (Value & Volume)
- 5.4. Market Analysis, Insights and Forecast - by Export Market Analysis (Value & Volume)
- 5.5. Market Analysis, Insights and Forecast - by Price Trend Analysis
- 5.6. Market Analysis, Insights and Forecast - by Region
- 5.6.1. North America
- 5.6.2. South America
- 5.6.3. Europe
- 5.6.4. Middle East & Africa
- 5.6.5. Asia Pacific
- 5.1. Market Analysis, Insights and Forecast - by Production Analysis
- 6. North America Bio Insecticides Market Analysis, Insights and Forecast, 2019-2031
- 6.1. Market Analysis, Insights and Forecast - by Production Analysis
- 6.2. Market Analysis, Insights and Forecast - by Consumption Analysis
- 6.3. Market Analysis, Insights and Forecast - by Import Market Analysis (Value & Volume)
- 6.4. Market Analysis, Insights and Forecast - by Export Market Analysis (Value & Volume)
- 6.5. Market Analysis, Insights and Forecast - by Price Trend Analysis
- 6.1. Market Analysis, Insights and Forecast - by Production Analysis
- 7. South America Bio Insecticides Market Analysis, Insights and Forecast, 2019-2031
- 7.1. Market Analysis, Insights and Forecast - by Production Analysis
- 7.2. Market Analysis, Insights and Forecast - by Consumption Analysis
- 7.3. Market Analysis, Insights and Forecast - by Import Market Analysis (Value & Volume)
- 7.4. Market Analysis, Insights and Forecast - by Export Market Analysis (Value & Volume)
- 7.5. Market Analysis, Insights and Forecast - by Price Trend Analysis
- 7.1. Market Analysis, Insights and Forecast - by Production Analysis
- 8. Europe Bio Insecticides Market Analysis, Insights and Forecast, 2019-2031
- 8.1. Market Analysis, Insights and Forecast - by Production Analysis
- 8.2. Market Analysis, Insights and Forecast - by Consumption Analysis
- 8.3. Market Analysis, Insights and Forecast - by Import Market Analysis (Value & Volume)
- 8.4. Market Analysis, Insights and Forecast - by Export Market Analysis (Value & Volume)
- 8.5. Market Analysis, Insights and Forecast - by Price Trend Analysis
- 8.1. Market Analysis, Insights and Forecast - by Production Analysis
- 9. Middle East & Africa Bio Insecticides Market Analysis, Insights and Forecast, 2019-2031
- 9.1. Market Analysis, Insights and Forecast - by Production Analysis
- 9.2. Market Analysis, Insights and Forecast - by Consumption Analysis
- 9.3. Market Analysis, Insights and Forecast - by Import Market Analysis (Value & Volume)
- 9.4. Market Analysis, Insights and Forecast - by Export Market Analysis (Value & Volume)
- 9.5. Market Analysis, Insights and Forecast - by Price Trend Analysis
- 9.1. Market Analysis, Insights and Forecast - by Production Analysis
- 10. Asia Pacific Bio Insecticides Market Analysis, Insights and Forecast, 2019-2031
- 10.1. Market Analysis, Insights and Forecast - by Production Analysis
- 10.2. Market Analysis, Insights and Forecast - by Consumption Analysis
- 10.3. Market Analysis, Insights and Forecast - by Import Market Analysis (Value & Volume)
- 10.4. Market Analysis, Insights and Forecast - by Export Market Analysis (Value & Volume)
- 10.5. Market Analysis, Insights and Forecast - by Price Trend Analysis
- 10.1. Market Analysis, Insights and Forecast - by Production Analysis
- 11. North America Bio Insecticides Market Analysis, Insights and Forecast, 2019-2031
- 11.1. Market Analysis, Insights and Forecast - By Country/Sub-region
- 11.1.1 United States
- 11.1.2 Canada
- 11.1.3 Mexico
- 11.1.4 Rest of North America
- 12. Europe Bio Insecticides Market Analysis, Insights and Forecast, 2019-2031
- 12.1. Market Analysis, Insights and Forecast - By Country/Sub-region
- 12.1.1 Germany
- 12.1.2 United Kingdom
- 12.1.3 France
- 12.1.4 Spain
- 12.1.5 Italy
- 12.1.6 Russia
- 12.1.7 Rest of Europe
- 13. Asia Pacific Bio Insecticides Market Analysis, Insights and Forecast, 2019-2031
- 13.1. Market Analysis, Insights and Forecast - By Country/Sub-region
- 13.1.1 China
- 13.1.2 India
- 13.1.3 Japan
- 13.1.4 Australia
- 13.1.5 Rest of Asia Pacific
- 14. South America Bio Insecticides Market Analysis, Insights and Forecast, 2019-2031
- 14.1. Market Analysis, Insights and Forecast - By Country/Sub-region
- 14.1.1 Brazil
- 14.1.2 Argentina
- 14.1.3 Rest of South America
- 15. Africa Bio Insecticides Market Analysis, Insights and Forecast, 2019-2031
- 15.1. Market Analysis, Insights and Forecast - By Country/Sub-region
- 15.1.1 South Africa
- 15.1.2 Rest of Africa
- 16. Competitive Analysis
- 16.1. Global Market Share Analysis 2024
- 16.2. Company Profiles
- 16.2.1 Marrone Bio innovations
- 16.2.1.1. Overview
- 16.2.1.2. Products
- 16.2.1.3. SWOT Analysis
- 16.2.1.4. Recent Developments
- 16.2.1.5. Financials (Based on Availability)
- 16.2.2 Bayer Cropscience AG
- 16.2.2.1. Overview
- 16.2.2.2. Products
- 16.2.2.3. SWOT Analysis
- 16.2.2.4. Recent Developments
- 16.2.2.5. Financials (Based on Availability)
- 16.2.3 Certis LLC
- 16.2.3.1. Overview
- 16.2.3.2. Products
- 16.2.3.3. SWOT Analysis
- 16.2.3.4. Recent Developments
- 16.2.3.5. Financials (Based on Availability)
- 16.2.4 Bioworks Inc
- 16.2.4.1. Overview
- 16.2.4.2. Products
- 16.2.4.3. SWOT Analysis
- 16.2.4.4. Recent Developments
- 16.2.4.5. Financials (Based on Availability)
- 16.2.5 Valent Biosciences Corporation*List Not Exhaustive
- 16.2.5.1. Overview
- 16.2.5.2. Products
- 16.2.5.3. SWOT Analysis
- 16.2.5.4. Recent Developments
- 16.2.5.5. Financials (Based on Availability)
- 16.2.6 Isagro Spa
- 16.2.6.1. Overview
- 16.2.6.2. Products
- 16.2.6.3. SWOT Analysis
- 16.2.6.4. Recent Developments
- 16.2.6.5. Financials (Based on Availability)
- 16.2.7 Corteva Agriscience
- 16.2.7.1. Overview
- 16.2.7.2. Products
- 16.2.7.3. SWOT Analysis
- 16.2.7.4. Recent Developments
- 16.2.7.5. Financials (Based on Availability)
- 16.2.8 Novozymes AS
- 16.2.8.1. Overview
- 16.2.8.2. Products
- 16.2.8.3. SWOT Analysis
- 16.2.8.4. Recent Developments
- 16.2.8.5. Financials (Based on Availability)
- 16.2.9 Koppert Biological Systems
- 16.2.9.1. Overview
- 16.2.9.2. Products
- 16.2.9.3. SWOT Analysis
- 16.2.9.4. Recent Developments
- 16.2.9.5. Financials (Based on Availability)
- 16.2.10 BASF SE
- 16.2.10.1. Overview
- 16.2.10.2. Products
- 16.2.10.3. SWOT Analysis
- 16.2.10.4. Recent Developments
- 16.2.10.5. Financials (Based on Availability)
- 16.2.1 Marrone Bio innovations
List of Figures
- Figure 1: Global Bio Insecticides Market Revenue Breakdown (Million, %) by Region 2024 & 2032
- Figure 2: North America Bio Insecticides Market Revenue (Million), by Country 2024 & 2032
- Figure 3: North America Bio Insecticides Market Revenue Share (%), by Country 2024 & 2032
- Figure 4: Europe Bio Insecticides Market Revenue (Million), by Country 2024 & 2032
- Figure 5: Europe Bio Insecticides Market Revenue Share (%), by Country 2024 & 2032
- Figure 6: Asia Pacific Bio Insecticides Market Revenue (Million), by Country 2024 & 2032
- Figure 7: Asia Pacific Bio Insecticides Market Revenue Share (%), by Country 2024 & 2032
- Figure 8: South America Bio Insecticides Market Revenue (Million), by Country 2024 & 2032
- Figure 9: South America Bio Insecticides Market Revenue Share (%), by Country 2024 & 2032
- Figure 10: Africa Bio Insecticides Market Revenue (Million), by Country 2024 & 2032
- Figure 11: Africa Bio Insecticides Market Revenue Share (%), by Country 2024 & 2032
- Figure 12: North America Bio Insecticides Market Revenue (Million), by Production Analysis 2024 & 2032
- Figure 13: North America Bio Insecticides Market Revenue Share (%), by Production Analysis 2024 & 2032
- Figure 14: North America Bio Insecticides Market Revenue (Million), by Consumption Analysis 2024 & 2032
- Figure 15: North America Bio Insecticides Market Revenue Share (%), by Consumption Analysis 2024 & 2032
- Figure 16: North America Bio Insecticides Market Revenue (Million), by Import Market Analysis (Value & Volume) 2024 & 2032
- Figure 17: North America Bio Insecticides Market Revenue Share (%), by Import Market Analysis (Value & Volume) 2024 & 2032
- Figure 18: North America Bio Insecticides Market Revenue (Million), by Export Market Analysis (Value & Volume) 2024 & 2032
- Figure 19: North America Bio Insecticides Market Revenue Share (%), by Export Market Analysis (Value & Volume) 2024 & 2032
- Figure 20: North America Bio Insecticides Market Revenue (Million), by Price Trend Analysis 2024 & 2032
- Figure 21: North America Bio Insecticides Market Revenue Share (%), by Price Trend Analysis 2024 & 2032
- Figure 22: North America Bio Insecticides Market Revenue (Million), by Country 2024 & 2032
- Figure 23: North America Bio Insecticides Market Revenue Share (%), by Country 2024 & 2032
- Figure 24: South America Bio Insecticides Market Revenue (Million), by Production Analysis 2024 & 2032
- Figure 25: South America Bio Insecticides Market Revenue Share (%), by Production Analysis 2024 & 2032
- Figure 26: South America Bio Insecticides Market Revenue (Million), by Consumption Analysis 2024 & 2032
- Figure 27: South America Bio Insecticides Market Revenue Share (%), by Consumption Analysis 2024 & 2032
- Figure 28: South America Bio Insecticides Market Revenue (Million), by Import Market Analysis (Value & Volume) 2024 & 2032
- Figure 29: South America Bio Insecticides Market Revenue Share (%), by Import Market Analysis (Value & Volume) 2024 & 2032
- Figure 30: South America Bio Insecticides Market Revenue (Million), by Export Market Analysis (Value & Volume) 2024 & 2032
- Figure 31: South America Bio Insecticides Market Revenue Share (%), by Export Market Analysis (Value & Volume) 2024 & 2032
- Figure 32: South America Bio Insecticides Market Revenue (Million), by Price Trend Analysis 2024 & 2032
- Figure 33: South America Bio Insecticides Market Revenue Share (%), by Price Trend Analysis 2024 & 2032
- Figure 34: South America Bio Insecticides Market Revenue (Million), by Country 2024 & 2032
- Figure 35: South America Bio Insecticides Market Revenue Share (%), by Country 2024 & 2032
- Figure 36: Europe Bio Insecticides Market Revenue (Million), by Production Analysis 2024 & 2032
- Figure 37: Europe Bio Insecticides Market Revenue Share (%), by Production Analysis 2024 & 2032
- Figure 38: Europe Bio Insecticides Market Revenue (Million), by Consumption Analysis 2024 & 2032
- Figure 39: Europe Bio Insecticides Market Revenue Share (%), by Consumption Analysis 2024 & 2032
- Figure 40: Europe Bio Insecticides Market Revenue (Million), by Import Market Analysis (Value & Volume) 2024 & 2032
- Figure 41: Europe Bio Insecticides Market Revenue Share (%), by Import Market Analysis (Value & Volume) 2024 & 2032
- Figure 42: Europe Bio Insecticides Market Revenue (Million), by Export Market Analysis (Value & Volume) 2024 & 2032
- Figure 43: Europe Bio Insecticides Market Revenue Share (%), by Export Market Analysis (Value & Volume) 2024 & 2032
- Figure 44: Europe Bio Insecticides Market Revenue (Million), by Price Trend Analysis 2024 & 2032
- Figure 45: Europe Bio Insecticides Market Revenue Share (%), by Price Trend Analysis 2024 & 2032
- Figure 46: Europe Bio Insecticides Market Revenue (Million), by Country 2024 & 2032
- Figure 47: Europe Bio Insecticides Market Revenue Share (%), by Country 2024 & 2032
- Figure 48: Middle East & Africa Bio Insecticides Market Revenue (Million), by Production Analysis 2024 & 2032
- Figure 49: Middle East & Africa Bio Insecticides Market Revenue Share (%), by Production Analysis 2024 & 2032
- Figure 50: Middle East & Africa Bio Insecticides Market Revenue (Million), by Consumption Analysis 2024 & 2032
- Figure 51: Middle East & Africa Bio Insecticides Market Revenue Share (%), by Consumption Analysis 2024 & 2032
- Figure 52: Middle East & Africa Bio Insecticides Market Revenue (Million), by Import Market Analysis (Value & Volume) 2024 & 2032
- Figure 53: Middle East & Africa Bio Insecticides Market Revenue Share (%), by Import Market Analysis (Value & Volume) 2024 & 2032
- Figure 54: Middle East & Africa Bio Insecticides Market Revenue (Million), by Export Market Analysis (Value & Volume) 2024 & 2032
- Figure 55: Middle East & Africa Bio Insecticides Market Revenue Share (%), by Export Market Analysis (Value & Volume) 2024 & 2032
- Figure 56: Middle East & Africa Bio Insecticides Market Revenue (Million), by Price Trend Analysis 2024 & 2032
- Figure 57: Middle East & Africa Bio Insecticides Market Revenue Share (%), by Price Trend Analysis 2024 & 2032
- Figure 58: Middle East & Africa Bio Insecticides Market Revenue (Million), by Country 2024 & 2032
- Figure 59: Middle East & Africa Bio Insecticides Market Revenue Share (%), by Country 2024 & 2032
- Figure 60: Asia Pacific Bio Insecticides Market Revenue (Million), by Production Analysis 2024 & 2032
- Figure 61: Asia Pacific Bio Insecticides Market Revenue Share (%), by Production Analysis 2024 & 2032
- Figure 62: Asia Pacific Bio Insecticides Market Revenue (Million), by Consumption Analysis 2024 & 2032
- Figure 63: Asia Pacific Bio Insecticides Market Revenue Share (%), by Consumption Analysis 2024 & 2032
- Figure 64: Asia Pacific Bio Insecticides Market Revenue (Million), by Import Market Analysis (Value & Volume) 2024 & 2032
- Figure 65: Asia Pacific Bio Insecticides Market Revenue Share (%), by Import Market Analysis (Value & Volume) 2024 & 2032
- Figure 66: Asia Pacific Bio Insecticides Market Revenue (Million), by Export Market Analysis (Value & Volume) 2024 & 2032
- Figure 67: Asia Pacific Bio Insecticides Market Revenue Share (%), by Export Market Analysis (Value & Volume) 2024 & 2032
- Figure 68: Asia Pacific Bio Insecticides Market Revenue (Million), by Price Trend Analysis 2024 & 2032
- Figure 69: Asia Pacific Bio Insecticides Market Revenue Share (%), by Price Trend Analysis 2024 & 2032
- Figure 70: Asia Pacific Bio Insecticides Market Revenue (Million), by Country 2024 & 2032
- Figure 71: Asia Pacific Bio Insecticides Market Revenue Share (%), by Country 2024 & 2032
List of Tables
- Table 1: Global Bio Insecticides Market Revenue Million Forecast, by Region 2019 & 2032
- Table 2: Global Bio Insecticides Market Revenue Million Forecast, by Production Analysis 2019 & 2032
- Table 3: Global Bio Insecticides Market Revenue Million Forecast, by Consumption Analysis 2019 & 2032
- Table 4: Global Bio Insecticides Market Revenue Million Forecast, by Import Market Analysis (Value & Volume) 2019 & 2032
- Table 5: Global Bio Insecticides Market Revenue Million Forecast, by Export Market Analysis (Value & Volume) 2019 & 2032
- Table 6: Global Bio Insecticides Market Revenue Million Forecast, by Price Trend Analysis 2019 & 2032
- Table 7: Global Bio Insecticides Market Revenue Million Forecast, by Region 2019 & 2032
- Table 8: Global Bio Insecticides Market Revenue Million Forecast, by Country 2019 & 2032
- Table 9: United States Bio Insecticides Market Revenue (Million) Forecast, by Application 2019 & 2032
- Table 10: Canada Bio Insecticides Market Revenue (Million) Forecast, by Application 2019 & 2032
- Table 11: Mexico Bio Insecticides Market Revenue (Million) Forecast, by Application 2019 & 2032
- Table 12: Rest of North America Bio Insecticides Market Revenue (Million) Forecast, by Application 2019 & 2032
- Table 13: Global Bio Insecticides Market Revenue Million Forecast, by Country 2019 & 2032
- Table 14: Germany Bio Insecticides Market Revenue (Million) Forecast, by Application 2019 & 2032
- Table 15: United Kingdom Bio Insecticides Market Revenue (Million) Forecast, by Application 2019 & 2032
- Table 16: France Bio Insecticides Market Revenue (Million) Forecast, by Application 2019 & 2032
- Table 17: Spain Bio Insecticides Market Revenue (Million) Forecast, by Application 2019 & 2032
- Table 18: Italy Bio Insecticides Market Revenue (Million) Forecast, by Application 2019 & 2032
- Table 19: Russia Bio Insecticides Market Revenue (Million) Forecast, by Application 2019 & 2032
- Table 20: Rest of Europe Bio Insecticides Market Revenue (Million) Forecast, by Application 2019 & 2032
- Table 21: Global Bio Insecticides Market Revenue Million Forecast, by Country 2019 & 2032
- Table 22: China Bio Insecticides Market Revenue (Million) Forecast, by Application 2019 & 2032
- Table 23: India Bio Insecticides Market Revenue (Million) Forecast, by Application 2019 & 2032
- Table 24: Japan Bio Insecticides Market Revenue (Million) Forecast, by Application 2019 & 2032
- Table 25: Australia Bio Insecticides Market Revenue (Million) Forecast, by Application 2019 & 2032
- Table 26: Rest of Asia Pacific Bio Insecticides Market Revenue (Million) Forecast, by Application 2019 & 2032
- Table 27: Global Bio Insecticides Market Revenue Million Forecast, by Country 2019 & 2032
- Table 28: Brazil Bio Insecticides Market Revenue (Million) Forecast, by Application 2019 & 2032
- Table 29: Argentina Bio Insecticides Market Revenue (Million) Forecast, by Application 2019 & 2032
- Table 30: Rest of South America Bio Insecticides Market Revenue (Million) Forecast, by Application 2019 & 2032
- Table 31: Global Bio Insecticides Market Revenue Million Forecast, by Country 2019 & 2032
- Table 32: South Africa Bio Insecticides Market Revenue (Million) Forecast, by Application 2019 & 2032
- Table 33: Rest of Africa Bio Insecticides Market Revenue (Million) Forecast, by Application 2019 & 2032
- Table 34: Global Bio Insecticides Market Revenue Million Forecast, by Production Analysis 2019 & 2032
- Table 35: Global Bio Insecticides Market Revenue Million Forecast, by Consumption Analysis 2019 & 2032
- Table 36: Global Bio Insecticides Market Revenue Million Forecast, by Import Market Analysis (Value & Volume) 2019 & 2032
- Table 37: Global Bio Insecticides Market Revenue Million Forecast, by Export Market Analysis (Value & Volume) 2019 & 2032
- Table 38: Global Bio Insecticides Market Revenue Million Forecast, by Price Trend Analysis 2019 & 2032
- Table 39: Global Bio Insecticides Market Revenue Million Forecast, by Country 2019 & 2032
- Table 40: United States Bio Insecticides Market Revenue (Million) Forecast, by Application 2019 & 2032
- Table 41: Canada Bio Insecticides Market Revenue (Million) Forecast, by Application 2019 & 2032
- Table 42: Mexico Bio Insecticides Market Revenue (Million) Forecast, by Application 2019 & 2032
- Table 43: Global Bio Insecticides Market Revenue Million Forecast, by Production Analysis 2019 & 2032
- Table 44: Global Bio Insecticides Market Revenue Million Forecast, by Consumption Analysis 2019 & 2032
- Table 45: Global Bio Insecticides Market Revenue Million Forecast, by Import Market Analysis (Value & Volume) 2019 & 2032
- Table 46: Global Bio Insecticides Market Revenue Million Forecast, by Export Market Analysis (Value & Volume) 2019 & 2032
- Table 47: Global Bio Insecticides Market Revenue Million Forecast, by Price Trend Analysis 2019 & 2032
- Table 48: Global Bio Insecticides Market Revenue Million Forecast, by Country 2019 & 2032
- Table 49: Brazil Bio Insecticides Market Revenue (Million) Forecast, by Application 2019 & 2032
- Table 50: Argentina Bio Insecticides Market Revenue (Million) Forecast, by Application 2019 & 2032
- Table 51: Rest of South America Bio Insecticides Market Revenue (Million) Forecast, by Application 2019 & 2032
- Table 52: Global Bio Insecticides Market Revenue Million Forecast, by Production Analysis 2019 & 2032
- Table 53: Global Bio Insecticides Market Revenue Million Forecast, by Consumption Analysis 2019 & 2032
- Table 54: Global Bio Insecticides Market Revenue Million Forecast, by Import Market Analysis (Value & Volume) 2019 & 2032
- Table 55: Global Bio Insecticides Market Revenue Million Forecast, by Export Market Analysis (Value & Volume) 2019 & 2032
- Table 56: Global Bio Insecticides Market Revenue Million Forecast, by Price Trend Analysis 2019 & 2032
- Table 57: Global Bio Insecticides Market Revenue Million Forecast, by Country 2019 & 2032
- Table 58: United Kingdom Bio Insecticides Market Revenue (Million) Forecast, by Application 2019 & 2032
- Table 59: Germany Bio Insecticides Market Revenue (Million) Forecast, by Application 2019 & 2032
- Table 60: France Bio Insecticides Market Revenue (Million) Forecast, by Application 2019 & 2032
- Table 61: Italy Bio Insecticides Market Revenue (Million) Forecast, by Application 2019 & 2032
- Table 62: Spain Bio Insecticides Market Revenue (Million) Forecast, by Application 2019 & 2032
- Table 63: Russia Bio Insecticides Market Revenue (Million) Forecast, by Application 2019 & 2032
- Table 64: Benelux Bio Insecticides Market Revenue (Million) Forecast, by Application 2019 & 2032
- Table 65: Nordics Bio Insecticides Market Revenue (Million) Forecast, by Application 2019 & 2032
- Table 66: Rest of Europe Bio Insecticides Market Revenue (Million) Forecast, by Application 2019 & 2032
- Table 67: Global Bio Insecticides Market Revenue Million Forecast, by Production Analysis 2019 & 2032
- Table 68: Global Bio Insecticides Market Revenue Million Forecast, by Consumption Analysis 2019 & 2032
- Table 69: Global Bio Insecticides Market Revenue Million Forecast, by Import Market Analysis (Value & Volume) 2019 & 2032
- Table 70: Global Bio Insecticides Market Revenue Million Forecast, by Export Market Analysis (Value & Volume) 2019 & 2032
- Table 71: Global Bio Insecticides Market Revenue Million Forecast, by Price Trend Analysis 2019 & 2032
- Table 72: Global Bio Insecticides Market Revenue Million Forecast, by Country 2019 & 2032
- Table 73: Turkey Bio Insecticides Market Revenue (Million) Forecast, by Application 2019 & 2032
- Table 74: Israel Bio Insecticides Market Revenue (Million) Forecast, by Application 2019 & 2032
- Table 75: GCC Bio Insecticides Market Revenue (Million) Forecast, by Application 2019 & 2032
- Table 76: North Africa Bio Insecticides Market Revenue (Million) Forecast, by Application 2019 & 2032
- Table 77: South Africa Bio Insecticides Market Revenue (Million) Forecast, by Application 2019 & 2032
- Table 78: Rest of Middle East & Africa Bio Insecticides Market Revenue (Million) Forecast, by Application 2019 & 2032
- Table 79: Global Bio Insecticides Market Revenue Million Forecast, by Production Analysis 2019 & 2032
- Table 80: Global Bio Insecticides Market Revenue Million Forecast, by Consumption Analysis 2019 & 2032
- Table 81: Global Bio Insecticides Market Revenue Million Forecast, by Import Market Analysis (Value & Volume) 2019 & 2032
- Table 82: Global Bio Insecticides Market Revenue Million Forecast, by Export Market Analysis (Value & Volume) 2019 & 2032
- Table 83: Global Bio Insecticides Market Revenue Million Forecast, by Price Trend Analysis 2019 & 2032
- Table 84: Global Bio Insecticides Market Revenue Million Forecast, by Country 2019 & 2032
- Table 85: China Bio Insecticides Market Revenue (Million) Forecast, by Application 2019 & 2032
- Table 86: India Bio Insecticides Market Revenue (Million) Forecast, by Application 2019 & 2032
- Table 87: Japan Bio Insecticides Market Revenue (Million) Forecast, by Application 2019 & 2032
- Table 88: South Korea Bio Insecticides Market Revenue (Million) Forecast, by Application 2019 & 2032
- Table 89: ASEAN Bio Insecticides Market Revenue (Million) Forecast, by Application 2019 & 2032
- Table 90: Oceania Bio Insecticides Market Revenue (Million) Forecast, by Application 2019 & 2032
- Table 91: Rest of Asia Pacific Bio Insecticides Market Revenue (Million) Forecast, by Application 2019 & 2032
Frequently Asked Questions
1. What is the projected Compound Annual Growth Rate (CAGR) of the Bio Insecticides Market?
The projected CAGR is approximately 12.30%.
2. Which companies are prominent players in the Bio Insecticides Market?
Key companies in the market include Marrone Bio innovations, Bayer Cropscience AG, Certis LLC, Bioworks Inc, Valent Biosciences Corporation*List Not Exhaustive, Isagro Spa, Corteva Agriscience, Novozymes AS, Koppert Biological Systems, BASF SE.
3. What are the main segments of the Bio Insecticides Market?
The market segments include Production Analysis, Consumption Analysis, Import Market Analysis (Value & Volume), Export Market Analysis (Value & Volume), Price Trend Analysis.
4. Can you provide details about the market size?
The market size is estimated to be USD XX Million as of 2022.
5. What are some drivers contributing to market growth?
Demand For Landscaping Maintenance; Adoption of Green Spaces and Green Roofs.
6. What are the notable trends driving market growth?
Fruits and Vegetables Occupy the Largest Share By Application.
7. Are there any restraints impacting market growth?
Shortage of Labor In Landscaping; High Maintenance Cost of Lawn Mowers.
8. Can you provide examples of recent developments in the market?
N/A
9. What pricing options are available for accessing the report?
Pricing options include single-user, multi-user, and enterprise licenses priced at USD 4750, USD 5250, and USD 8750 respectively.
10. Is the market size provided in terms of value or volume?
The market size is provided in terms of value, measured in Million.
11. Are there any specific market keywords associated with the report?
Yes, the market keyword associated with the report is "Bio Insecticides Market," which aids in identifying and referencing the specific market segment covered.
12. How do I determine which pricing option suits my needs best?
The pricing options vary based on user requirements and access needs. Individual users may opt for single-user licenses, while businesses requiring broader access may choose multi-user or enterprise licenses for cost-effective access to the report.
13. Are there any additional resources or data provided in the Bio Insecticides Market report?
While the report offers comprehensive insights, it's advisable to review the specific contents or supplementary materials provided to ascertain if additional resources or data are available.
14. How can I stay updated on further developments or reports in the Bio Insecticides Market?
To stay informed about further developments, trends, and reports in the Bio Insecticides Market, consider subscribing to industry newsletters, following relevant companies and organizations, or regularly checking reputable industry news sources and publications.
Methodology
Step 1 - Identification of Relevant Samples Size from Population Database


Step 2 - Approaches for Defining Global Market Size (Value, Volume* & Price*)

Note*: In applicable scenarios
Step 3 - Data Sources
Primary Research
- Web Analytics
- Survey Reports
- Research Institute
- Latest Research Reports
- Opinion Leaders
Secondary Research
- Annual Reports
- White Paper
- Latest Press Release
- Industry Association
- Paid Database
- Investor Presentations

Step 4 - Data Triangulation
Involves using different sources of information in order to increase the validity of a study
These sources are likely to be stakeholders in a program - participants, other researchers, program staff, other community members, and so on.
Then we put all data in single framework & apply various statistical tools to find out the dynamic on the market.
During the analysis stage, feedback from the stakeholder groups would be compared to determine areas of agreement as well as areas of divergence


