Key Insights
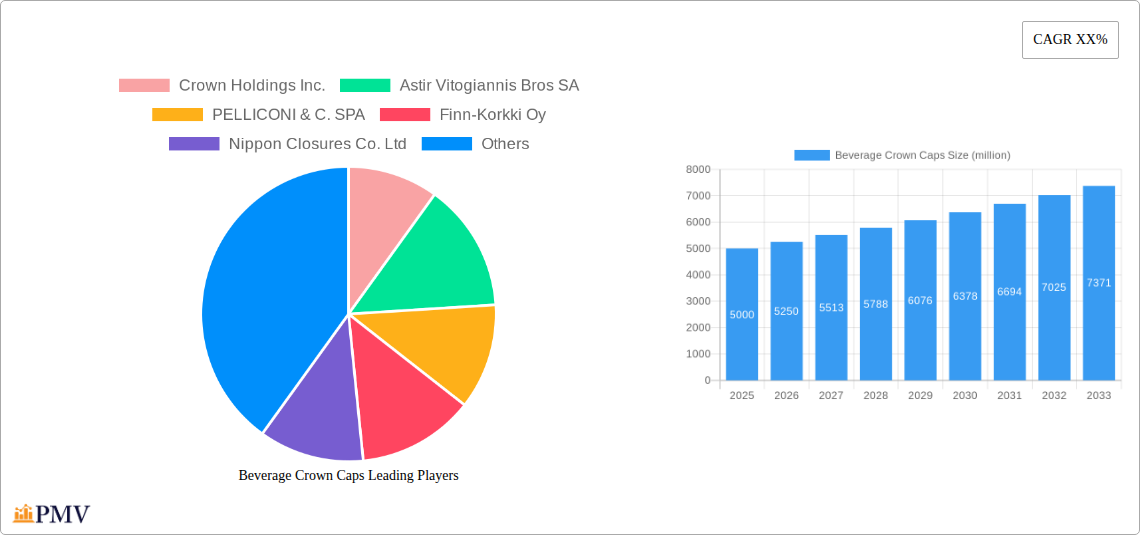
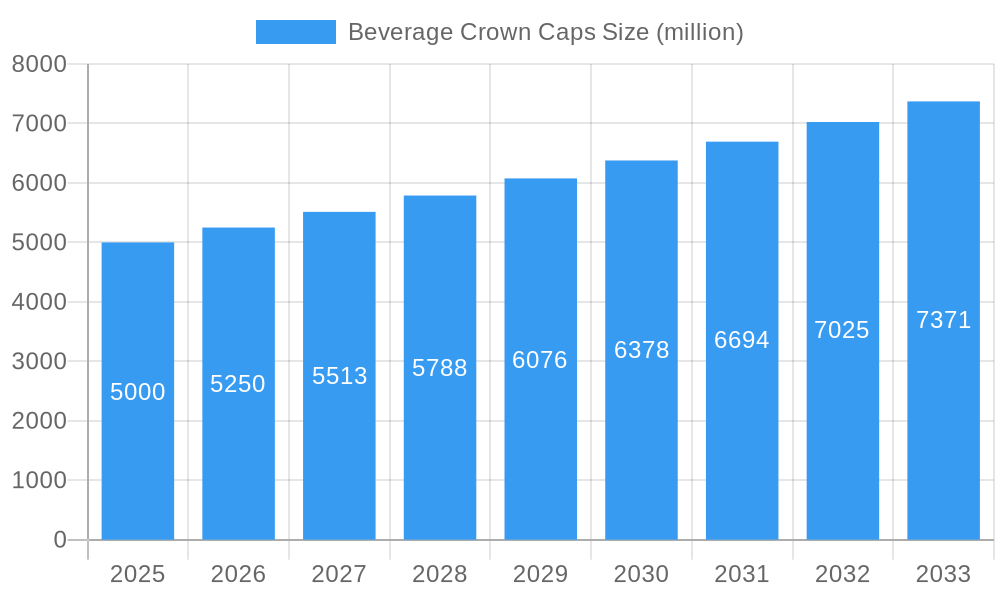
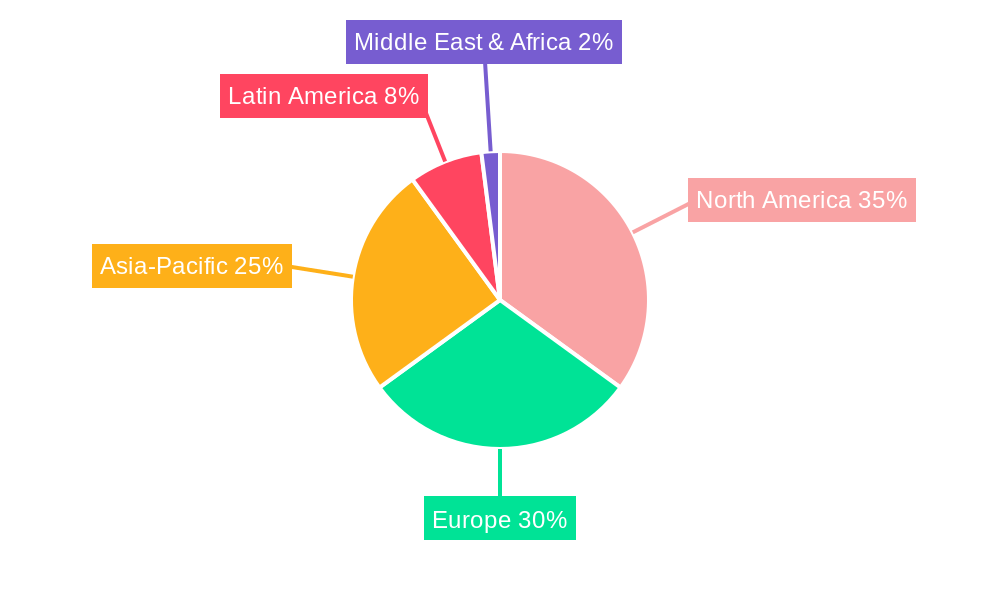
The global beverage crown cap market is experiencing robust growth, driven by the increasing demand for packaged beverages across diverse regions. The market, estimated at $5 billion in 2025, is projected to exhibit a healthy Compound Annual Growth Rate (CAGR) of 5% from 2025 to 2033, reaching approximately $7.5 billion by 2033. This expansion is fueled by several key factors, including the rising popularity of carbonated soft drinks, beer, and energy drinks, all of which heavily rely on crown caps for sealing and preservation. Furthermore, the growing preference for convenient and portable packaging formats contributes significantly to the market's growth trajectory. Consumer demand for tamper-evident closures and sustainable packaging options are also driving innovation within the industry, leading to the development of eco-friendly materials and advanced closure technologies. Major players like Crown Holdings Inc. and Nippon Closures Co. Ltd. are strategically investing in research and development to enhance product offerings and cater to evolving market needs. Regional variations exist, with North America and Europe currently holding significant market shares, while emerging economies in Asia-Pacific are expected to showcase substantial growth potential in the coming years.
Beverage Crown Caps Market Size (In Billion)
Despite the positive outlook, the market faces certain challenges. Fluctuations in raw material prices, particularly for metals such as aluminum, can impact production costs and profitability. Furthermore, the rise of alternative packaging solutions, such as screw caps and other innovative closure systems, presents competitive pressure. However, the inherent advantages of crown caps, such as their superior sealing capabilities, cost-effectiveness, and recyclability, are likely to sustain their market dominance in the foreseeable future. Continued innovation focused on sustainability and enhanced consumer appeal will be critical for maintaining the market's robust growth trajectory and solidifying the position of key players in the global beverage crown cap industry.
Beverage Crown Caps Company Market Share
Beverage Crown Caps Market Report: 2019-2033
This comprehensive report provides an in-depth analysis of the global beverage crown caps market, offering invaluable insights for stakeholders across the value chain. The study covers the period 2019-2033, with a base year of 2025 and a forecast period of 2025-2033. The report leverages rigorous research methodologies to provide actionable intelligence on market size (projected to reach xx million units by 2033), growth drivers, competitive dynamics, and future trends. This detailed analysis will equip businesses with the strategic knowledge necessary to navigate the evolving landscape of the beverage crown caps industry.
Beverage Crown Caps Market Structure & Competitive Dynamics
This section analyzes the competitive landscape of the global beverage crown caps market, encompassing market concentration, innovation ecosystems, regulatory frameworks, product substitutes, end-user trends, and merger & acquisition (M&A) activities. The market is characterized by a moderate level of concentration, with several major players holding significant market share. Crown Holdings Inc. holds an estimated xx% market share globally in 2025, followed by Astir Vitogiannis Bros SA with xx% and Pelloni & C. SPA holding xx%. Smaller players like Finn-Korkki Oy, Nippon Closures Co. Ltd., and others compete primarily within regional markets.
- Market Concentration: The Herfindahl-Hirschman Index (HHI) is estimated to be xx, indicating a moderately concentrated market.
- Innovation Ecosystems: Ongoing innovation focuses on sustainable materials (recycled aluminum, bio-based polymers), improved sealing technologies, and enhanced design aesthetics.
- Regulatory Frameworks: Regulations concerning material safety, recyclability, and labeling vary across regions, impacting production and distribution.
- Product Substitutes: Screw caps and other closure types present competition, particularly for certain beverage categories.
- End-User Trends: The growing demand for convenient and sustainable packaging solutions is driving demand for innovative crown caps.
- M&A Activities: Over the historical period (2019-2024), M&A activity in the beverage crown caps sector totaled approximately xx million USD, with a focus on expansion into new markets and acquisition of specialized technologies. Deals averaged xx million USD in value.
Beverage Crown Caps Industry Trends & Insights
This section delves into the key trends shaping the beverage crown caps market. The market is experiencing robust growth, driven by factors such as the rising consumption of carbonated soft drinks, beer, and other beverages packaged in bottles requiring crown caps. Technological advancements are leading to the development of sustainable and more efficient crown cap manufacturing processes. The CAGR for the beverage crown caps market during the forecast period (2025-2033) is projected to be xx%, driven by increasing demand from emerging economies. Market penetration in developing regions is increasing significantly, with xx% market penetration projected by 2033 in key regions like Southeast Asia. Consumer preference for premium and aesthetically pleasing packaging is also influencing the design and material selection of crown caps. The competitive landscape is dynamic, with companies investing in new technologies and expanding their product portfolios to maintain a competitive edge.
Dominant Markets & Segments in Beverage Crown Caps
The beverage crown caps market demonstrates regional variations in growth and demand. The Asia-Pacific region is currently the dominant market, holding an estimated xx% of the global market share in 2025. This dominance stems from several key factors:
- Economic Growth: Rapid economic growth in countries like China and India drives increased consumption of beverages packaged in bottles.
- Infrastructure Development: Improved infrastructure facilitates efficient production, distribution, and consumption of beverages.
- Changing Consumer Preferences: A rising middle class with increased disposable income fuels demand for packaged beverages.
- Government Policies: Supportive government policies related to the beverage industry further enhance market growth.
North America and Europe represent significant but comparatively slower-growing markets due to market saturation and a focus on sustainability and eco-friendly alternatives.
Beverage Crown Caps Product Innovations
Recent innovations in the beverage crown caps market center around sustainability and enhanced functionality. Manufacturers are increasingly adopting recycled aluminum and exploring bio-based polymers to reduce environmental impact. Improvements in sealing technologies ensure product freshness and prevent leakage. Aesthetically appealing designs and customizability are further enhancing the attractiveness of crown caps to beverage producers. These advancements contribute to increased market penetration and competitive advantage.
Report Segmentation & Scope
The report segments the beverage crown caps market based on material (aluminum, tinplate, etc.), type (easy-open, standard), application (carbonated soft drinks, beer, etc.), and region (North America, Europe, Asia-Pacific, etc.). Each segment's growth projections, market size, and competitive dynamics are analyzed comprehensively. For instance, the aluminum crown cap segment is expected to dominate due to its recyclability and cost-effectiveness. The easy-open segment is experiencing faster growth driven by consumer preference for convenient packaging.
Key Drivers of Beverage Crown Caps Growth
Several factors are driving growth in the beverage crown caps market. Increased consumption of carbonated drinks and beer globally is a primary driver. Technological advancements in manufacturing processes result in cost-effective production, and an increasing focus on sustainable packaging solutions drives innovation in eco-friendly materials like recycled aluminum. Favorable government policies and infrastructure development in several emerging markets contribute significantly to the industry's growth trajectory.
Challenges in the Beverage Crown Caps Sector
The beverage crown caps sector faces challenges such as fluctuations in raw material prices (aluminum, tinplate), stringent environmental regulations concerning waste management, and intense competition from substitute closure types (screw caps). Supply chain disruptions can impact production and delivery timelines, adding to the operational costs. These factors may negatively affect profitability and market growth if not managed efficiently.
Leading Players in the Beverage Crown Caps Market
- Crown Holdings Inc.
- Astir Vitogiannis Bros SA
- PELLICONI & C. SPA
- Finn-Korkki Oy
- Nippon Closures Co. Ltd
- Continental Crowns And Closures
- RANKIN
- SHREE BALAJI CLOSURES
- Crown Seal Public Company Limited
- Imran Crown Cork
Key Developments in Beverage Crown Caps Sector
- January 2023: Crown Holdings Inc. announces the launch of a new sustainable crown cap made from recycled aluminum.
- June 2022: Astir Vitogiannis Bros SA invests in a new state-of-the-art manufacturing facility to increase production capacity.
- November 2021: A significant merger occurs between two smaller crown cap manufacturers in Europe, consolidating market share. (Further details within report)
Strategic Beverage Crown Caps Market Outlook
The beverage crown caps market presents significant growth potential, driven by continued expansion in emerging economies, innovation in sustainable packaging materials, and increased demand for convenient and attractive beverage packaging. Strategic opportunities exist for companies focusing on sustainability, expanding into new markets, and developing innovative closure technologies. The market is poised for steady growth over the forecast period, making it an attractive sector for investment and expansion.
Beverage Crown Caps Segmentation
-
1. Application
- 1.1. Juice
- 1.2. Liquor
- 1.3. Others
-
2. Types
- 2.1. Aluminum
- 2.2. Tin
- 2.3. Others
Beverage Crown Caps Segmentation By Geography
-
1. North America
- 1.1. United States
- 1.2. Canada
- 1.3. Mexico
-
2. South America
- 2.1. Brazil
- 2.2. Argentina
- 2.3. Rest of South America
-
3. Europe
- 3.1. United Kingdom
- 3.2. Germany
- 3.3. France
- 3.4. Italy
- 3.5. Spain
- 3.6. Russia
- 3.7. Benelux
- 3.8. Nordics
- 3.9. Rest of Europe
-
4. Middle East & Africa
- 4.1. Turkey
- 4.2. Israel
- 4.3. GCC
- 4.4. North Africa
- 4.5. South Africa
- 4.6. Rest of Middle East & Africa
-
5. Asia Pacific
- 5.1. China
- 5.2. India
- 5.3. Japan
- 5.4. South Korea
- 5.5. ASEAN
- 5.6. Oceania
- 5.7. Rest of Asia Pacific
Beverage Crown Caps Regional Market Share
Geographic Coverage of Beverage Crown Caps
Beverage Crown Caps REPORT HIGHLIGHTS
| Aspects | Details |
|---|---|
| Study Period | 2020-2034 |
| Base Year | 2025 |
| Estimated Year | 2026 |
| Forecast Period | 2026-2034 |
| Historical Period | 2020-2025 |
| Growth Rate | CAGR of 4.7% from 2020-2034 |
| Segmentation |
|
Table of Contents
- 1. Introduction
- 1.1. Research Scope
- 1.2. Market Segmentation
- 1.3. Research Objective
- 1.4. Definitions and Assumptions
- 2. Executive Summary
- 2.1. Market Snapshot
- 3. Market Dynamics
- 3.1. Market Drivers
- 3.2. Market Restrains
- 3.3. Market Trends
- 3.4. Market Opportunities
- 4. Market Factor Analysis
- 4.1. Porters Five Forces
- 4.1.1. Bargaining Power of Suppliers
- 4.1.2. Bargaining Power of Buyers
- 4.1.3. Threat of New Entrants
- 4.1.4. Threat of Substitutes
- 4.1.5. Competitive Rivalry
- 4.2. PESTEL analysis
- 4.3. BCG Analysis
- 4.3.1. Stars (High Growth, High Market Share)
- 4.3.2. Cash Cows (Low Growth, High Market Share)
- 4.3.3. Question Mark (High Growth, Low Market Share)
- 4.3.4. Dogs (Low Growth, Low Market Share)
- 4.4. Ansoff Matrix Analysis
- 4.5. Supply Chain Analysis
- 4.6. Regulatory Landscape
- 4.7. Current Market Potential and Opportunity Assessment (TAM–SAM–SOM Framework)
- 4.8. PMV Analyst Note
- 4.1. Porters Five Forces
- 5. Market Analysis, Insights and Forecast 2021-2033
- 5.1. Market Analysis, Insights and Forecast - by Application
- 5.1.1. Juice
- 5.1.2. Liquor
- 5.1.3. Others
- 5.2. Market Analysis, Insights and Forecast - by Types
- 5.2.1. Aluminum
- 5.2.2. Tin
- 5.2.3. Others
- 5.3. Market Analysis, Insights and Forecast - by Region
- 5.3.1. North America
- 5.3.2. South America
- 5.3.3. Europe
- 5.3.4. Middle East & Africa
- 5.3.5. Asia Pacific
- 5.1. Market Analysis, Insights and Forecast - by Application
- 6. Global Beverage Crown Caps Analysis, Insights and Forecast, 2021-2033
- 6.1. Market Analysis, Insights and Forecast - by Application
- 6.1.1. Juice
- 6.1.2. Liquor
- 6.1.3. Others
- 6.2. Market Analysis, Insights and Forecast - by Types
- 6.2.1. Aluminum
- 6.2.2. Tin
- 6.2.3. Others
- 6.1. Market Analysis, Insights and Forecast - by Application
- 7. North America Beverage Crown Caps Analysis, Insights and Forecast, 2020-2032
- 7.1. Market Analysis, Insights and Forecast - by Application
- 7.1.1. Juice
- 7.1.2. Liquor
- 7.1.3. Others
- 7.2. Market Analysis, Insights and Forecast - by Types
- 7.2.1. Aluminum
- 7.2.2. Tin
- 7.2.3. Others
- 7.1. Market Analysis, Insights and Forecast - by Application
- 8. South America Beverage Crown Caps Analysis, Insights and Forecast, 2020-2032
- 8.1. Market Analysis, Insights and Forecast - by Application
- 8.1.1. Juice
- 8.1.2. Liquor
- 8.1.3. Others
- 8.2. Market Analysis, Insights and Forecast - by Types
- 8.2.1. Aluminum
- 8.2.2. Tin
- 8.2.3. Others
- 8.1. Market Analysis, Insights and Forecast - by Application
- 9. Europe Beverage Crown Caps Analysis, Insights and Forecast, 2020-2032
- 9.1. Market Analysis, Insights and Forecast - by Application
- 9.1.1. Juice
- 9.1.2. Liquor
- 9.1.3. Others
- 9.2. Market Analysis, Insights and Forecast - by Types
- 9.2.1. Aluminum
- 9.2.2. Tin
- 9.2.3. Others
- 9.1. Market Analysis, Insights and Forecast - by Application
- 10. Middle East & Africa Beverage Crown Caps Analysis, Insights and Forecast, 2020-2032
- 10.1. Market Analysis, Insights and Forecast - by Application
- 10.1.1. Juice
- 10.1.2. Liquor
- 10.1.3. Others
- 10.2. Market Analysis, Insights and Forecast - by Types
- 10.2.1. Aluminum
- 10.2.2. Tin
- 10.2.3. Others
- 10.1. Market Analysis, Insights and Forecast - by Application
- 11. Asia Pacific Beverage Crown Caps Analysis, Insights and Forecast, 2020-2032
- 11.1. Market Analysis, Insights and Forecast - by Application
- 11.1.1. Juice
- 11.1.2. Liquor
- 11.1.3. Others
- 11.2. Market Analysis, Insights and Forecast - by Types
- 11.2.1. Aluminum
- 11.2.2. Tin
- 11.2.3. Others
- 11.1. Market Analysis, Insights and Forecast - by Application
- 12. Competitive Analysis
- 12.1. Company Profiles
- 12.1.1 Crown Holdings Inc.
- 12.1.1.1. Company Overview
- 12.1.1.2. Products
- 12.1.1.3. Company Financials
- 12.1.1.4. SWOT Analysis
- 12.1.2 Astir Vitogiannis Bros SA
- 12.1.2.1. Company Overview
- 12.1.2.2. Products
- 12.1.2.3. Company Financials
- 12.1.2.4. SWOT Analysis
- 12.1.3 PELLICONI & C. SPA
- 12.1.3.1. Company Overview
- 12.1.3.2. Products
- 12.1.3.3. Company Financials
- 12.1.3.4. SWOT Analysis
- 12.1.4 Finn-Korkki Oy
- 12.1.4.1. Company Overview
- 12.1.4.2. Products
- 12.1.4.3. Company Financials
- 12.1.4.4. SWOT Analysis
- 12.1.5 Nippon Closures Co. Ltd
- 12.1.5.1. Company Overview
- 12.1.5.2. Products
- 12.1.5.3. Company Financials
- 12.1.5.4. SWOT Analysis
- 12.1.6 Continental Crowns And Closures
- 12.1.6.1. Company Overview
- 12.1.6.2. Products
- 12.1.6.3. Company Financials
- 12.1.6.4. SWOT Analysis
- 12.1.7 RANKIN
- 12.1.7.1. Company Overview
- 12.1.7.2. Products
- 12.1.7.3. Company Financials
- 12.1.7.4. SWOT Analysis
- 12.1.8 SHREE BALAJI CLOSURES
- 12.1.8.1. Company Overview
- 12.1.8.2. Products
- 12.1.8.3. Company Financials
- 12.1.8.4. SWOT Analysis
- 12.1.9 Crown Seal Public Company Limited
- 12.1.9.1. Company Overview
- 12.1.9.2. Products
- 12.1.9.3. Company Financials
- 12.1.9.4. SWOT Analysis
- 12.1.10 Imran Crown Cork
- 12.1.10.1. Company Overview
- 12.1.10.2. Products
- 12.1.10.3. Company Financials
- 12.1.10.4. SWOT Analysis
- 12.1.1 Crown Holdings Inc.
- 12.2. Market Entropy
- 12.2.1 Company's Key Areas Served
- 12.2.2 Recent Developments
- 12.3. Company Market Share Analysis 2025
- 12.3.1 Top 5 Companies Market Share Analysis
- 12.3.2 Top 3 Companies Market Share Analysis
- 12.4. List of Potential Customers
- 13. Research Methodology
List of Figures
- Figure 1: Global Beverage Crown Caps Revenue Breakdown (undefined, %) by Region 2025 & 2033
- Figure 2: Global Beverage Crown Caps Volume Breakdown (K, %) by Region 2025 & 2033
- Figure 3: North America Beverage Crown Caps Revenue (undefined), by Application 2025 & 2033
- Figure 4: North America Beverage Crown Caps Volume (K), by Application 2025 & 2033
- Figure 5: North America Beverage Crown Caps Revenue Share (%), by Application 2025 & 2033
- Figure 6: North America Beverage Crown Caps Volume Share (%), by Application 2025 & 2033
- Figure 7: North America Beverage Crown Caps Revenue (undefined), by Types 2025 & 2033
- Figure 8: North America Beverage Crown Caps Volume (K), by Types 2025 & 2033
- Figure 9: North America Beverage Crown Caps Revenue Share (%), by Types 2025 & 2033
- Figure 10: North America Beverage Crown Caps Volume Share (%), by Types 2025 & 2033
- Figure 11: North America Beverage Crown Caps Revenue (undefined), by Country 2025 & 2033
- Figure 12: North America Beverage Crown Caps Volume (K), by Country 2025 & 2033
- Figure 13: North America Beverage Crown Caps Revenue Share (%), by Country 2025 & 2033
- Figure 14: North America Beverage Crown Caps Volume Share (%), by Country 2025 & 2033
- Figure 15: South America Beverage Crown Caps Revenue (undefined), by Application 2025 & 2033
- Figure 16: South America Beverage Crown Caps Volume (K), by Application 2025 & 2033
- Figure 17: South America Beverage Crown Caps Revenue Share (%), by Application 2025 & 2033
- Figure 18: South America Beverage Crown Caps Volume Share (%), by Application 2025 & 2033
- Figure 19: South America Beverage Crown Caps Revenue (undefined), by Types 2025 & 2033
- Figure 20: South America Beverage Crown Caps Volume (K), by Types 2025 & 2033
- Figure 21: South America Beverage Crown Caps Revenue Share (%), by Types 2025 & 2033
- Figure 22: South America Beverage Crown Caps Volume Share (%), by Types 2025 & 2033
- Figure 23: South America Beverage Crown Caps Revenue (undefined), by Country 2025 & 2033
- Figure 24: South America Beverage Crown Caps Volume (K), by Country 2025 & 2033
- Figure 25: South America Beverage Crown Caps Revenue Share (%), by Country 2025 & 2033
- Figure 26: South America Beverage Crown Caps Volume Share (%), by Country 2025 & 2033
- Figure 27: Europe Beverage Crown Caps Revenue (undefined), by Application 2025 & 2033
- Figure 28: Europe Beverage Crown Caps Volume (K), by Application 2025 & 2033
- Figure 29: Europe Beverage Crown Caps Revenue Share (%), by Application 2025 & 2033
- Figure 30: Europe Beverage Crown Caps Volume Share (%), by Application 2025 & 2033
- Figure 31: Europe Beverage Crown Caps Revenue (undefined), by Types 2025 & 2033
- Figure 32: Europe Beverage Crown Caps Volume (K), by Types 2025 & 2033
- Figure 33: Europe Beverage Crown Caps Revenue Share (%), by Types 2025 & 2033
- Figure 34: Europe Beverage Crown Caps Volume Share (%), by Types 2025 & 2033
- Figure 35: Europe Beverage Crown Caps Revenue (undefined), by Country 2025 & 2033
- Figure 36: Europe Beverage Crown Caps Volume (K), by Country 2025 & 2033
- Figure 37: Europe Beverage Crown Caps Revenue Share (%), by Country 2025 & 2033
- Figure 38: Europe Beverage Crown Caps Volume Share (%), by Country 2025 & 2033
- Figure 39: Middle East & Africa Beverage Crown Caps Revenue (undefined), by Application 2025 & 2033
- Figure 40: Middle East & Africa Beverage Crown Caps Volume (K), by Application 2025 & 2033
- Figure 41: Middle East & Africa Beverage Crown Caps Revenue Share (%), by Application 2025 & 2033
- Figure 42: Middle East & Africa Beverage Crown Caps Volume Share (%), by Application 2025 & 2033
- Figure 43: Middle East & Africa Beverage Crown Caps Revenue (undefined), by Types 2025 & 2033
- Figure 44: Middle East & Africa Beverage Crown Caps Volume (K), by Types 2025 & 2033
- Figure 45: Middle East & Africa Beverage Crown Caps Revenue Share (%), by Types 2025 & 2033
- Figure 46: Middle East & Africa Beverage Crown Caps Volume Share (%), by Types 2025 & 2033
- Figure 47: Middle East & Africa Beverage Crown Caps Revenue (undefined), by Country 2025 & 2033
- Figure 48: Middle East & Africa Beverage Crown Caps Volume (K), by Country 2025 & 2033
- Figure 49: Middle East & Africa Beverage Crown Caps Revenue Share (%), by Country 2025 & 2033
- Figure 50: Middle East & Africa Beverage Crown Caps Volume Share (%), by Country 2025 & 2033
- Figure 51: Asia Pacific Beverage Crown Caps Revenue (undefined), by Application 2025 & 2033
- Figure 52: Asia Pacific Beverage Crown Caps Volume (K), by Application 2025 & 2033
- Figure 53: Asia Pacific Beverage Crown Caps Revenue Share (%), by Application 2025 & 2033
- Figure 54: Asia Pacific Beverage Crown Caps Volume Share (%), by Application 2025 & 2033
- Figure 55: Asia Pacific Beverage Crown Caps Revenue (undefined), by Types 2025 & 2033
- Figure 56: Asia Pacific Beverage Crown Caps Volume (K), by Types 2025 & 2033
- Figure 57: Asia Pacific Beverage Crown Caps Revenue Share (%), by Types 2025 & 2033
- Figure 58: Asia Pacific Beverage Crown Caps Volume Share (%), by Types 2025 & 2033
- Figure 59: Asia Pacific Beverage Crown Caps Revenue (undefined), by Country 2025 & 2033
- Figure 60: Asia Pacific Beverage Crown Caps Volume (K), by Country 2025 & 2033
- Figure 61: Asia Pacific Beverage Crown Caps Revenue Share (%), by Country 2025 & 2033
- Figure 62: Asia Pacific Beverage Crown Caps Volume Share (%), by Country 2025 & 2033
List of Tables
- Table 1: Global Beverage Crown Caps Revenue undefined Forecast, by Application 2020 & 2033
- Table 2: Global Beverage Crown Caps Volume K Forecast, by Application 2020 & 2033
- Table 3: Global Beverage Crown Caps Revenue undefined Forecast, by Types 2020 & 2033
- Table 4: Global Beverage Crown Caps Volume K Forecast, by Types 2020 & 2033
- Table 5: Global Beverage Crown Caps Revenue undefined Forecast, by Region 2020 & 2033
- Table 6: Global Beverage Crown Caps Volume K Forecast, by Region 2020 & 2033
- Table 7: Global Beverage Crown Caps Revenue undefined Forecast, by Application 2020 & 2033
- Table 8: Global Beverage Crown Caps Volume K Forecast, by Application 2020 & 2033
- Table 9: Global Beverage Crown Caps Revenue undefined Forecast, by Types 2020 & 2033
- Table 10: Global Beverage Crown Caps Volume K Forecast, by Types 2020 & 2033
- Table 11: Global Beverage Crown Caps Revenue undefined Forecast, by Country 2020 & 2033
- Table 12: Global Beverage Crown Caps Volume K Forecast, by Country 2020 & 2033
- Table 13: United States Beverage Crown Caps Revenue (undefined) Forecast, by Application 2020 & 2033
- Table 14: United States Beverage Crown Caps Volume (K) Forecast, by Application 2020 & 2033
- Table 15: Canada Beverage Crown Caps Revenue (undefined) Forecast, by Application 2020 & 2033
- Table 16: Canada Beverage Crown Caps Volume (K) Forecast, by Application 2020 & 2033
- Table 17: Mexico Beverage Crown Caps Revenue (undefined) Forecast, by Application 2020 & 2033
- Table 18: Mexico Beverage Crown Caps Volume (K) Forecast, by Application 2020 & 2033
- Table 19: Global Beverage Crown Caps Revenue undefined Forecast, by Application 2020 & 2033
- Table 20: Global Beverage Crown Caps Volume K Forecast, by Application 2020 & 2033
- Table 21: Global Beverage Crown Caps Revenue undefined Forecast, by Types 2020 & 2033
- Table 22: Global Beverage Crown Caps Volume K Forecast, by Types 2020 & 2033
- Table 23: Global Beverage Crown Caps Revenue undefined Forecast, by Country 2020 & 2033
- Table 24: Global Beverage Crown Caps Volume K Forecast, by Country 2020 & 2033
- Table 25: Brazil Beverage Crown Caps Revenue (undefined) Forecast, by Application 2020 & 2033
- Table 26: Brazil Beverage Crown Caps Volume (K) Forecast, by Application 2020 & 2033
- Table 27: Argentina Beverage Crown Caps Revenue (undefined) Forecast, by Application 2020 & 2033
- Table 28: Argentina Beverage Crown Caps Volume (K) Forecast, by Application 2020 & 2033
- Table 29: Rest of South America Beverage Crown Caps Revenue (undefined) Forecast, by Application 2020 & 2033
- Table 30: Rest of South America Beverage Crown Caps Volume (K) Forecast, by Application 2020 & 2033
- Table 31: Global Beverage Crown Caps Revenue undefined Forecast, by Application 2020 & 2033
- Table 32: Global Beverage Crown Caps Volume K Forecast, by Application 2020 & 2033
- Table 33: Global Beverage Crown Caps Revenue undefined Forecast, by Types 2020 & 2033
- Table 34: Global Beverage Crown Caps Volume K Forecast, by Types 2020 & 2033
- Table 35: Global Beverage Crown Caps Revenue undefined Forecast, by Country 2020 & 2033
- Table 36: Global Beverage Crown Caps Volume K Forecast, by Country 2020 & 2033
- Table 37: United Kingdom Beverage Crown Caps Revenue (undefined) Forecast, by Application 2020 & 2033
- Table 38: United Kingdom Beverage Crown Caps Volume (K) Forecast, by Application 2020 & 2033
- Table 39: Germany Beverage Crown Caps Revenue (undefined) Forecast, by Application 2020 & 2033
- Table 40: Germany Beverage Crown Caps Volume (K) Forecast, by Application 2020 & 2033
- Table 41: France Beverage Crown Caps Revenue (undefined) Forecast, by Application 2020 & 2033
- Table 42: France Beverage Crown Caps Volume (K) Forecast, by Application 2020 & 2033
- Table 43: Italy Beverage Crown Caps Revenue (undefined) Forecast, by Application 2020 & 2033
- Table 44: Italy Beverage Crown Caps Volume (K) Forecast, by Application 2020 & 2033
- Table 45: Spain Beverage Crown Caps Revenue (undefined) Forecast, by Application 2020 & 2033
- Table 46: Spain Beverage Crown Caps Volume (K) Forecast, by Application 2020 & 2033
- Table 47: Russia Beverage Crown Caps Revenue (undefined) Forecast, by Application 2020 & 2033
- Table 48: Russia Beverage Crown Caps Volume (K) Forecast, by Application 2020 & 2033
- Table 49: Benelux Beverage Crown Caps Revenue (undefined) Forecast, by Application 2020 & 2033
- Table 50: Benelux Beverage Crown Caps Volume (K) Forecast, by Application 2020 & 2033
- Table 51: Nordics Beverage Crown Caps Revenue (undefined) Forecast, by Application 2020 & 2033
- Table 52: Nordics Beverage Crown Caps Volume (K) Forecast, by Application 2020 & 2033
- Table 53: Rest of Europe Beverage Crown Caps Revenue (undefined) Forecast, by Application 2020 & 2033
- Table 54: Rest of Europe Beverage Crown Caps Volume (K) Forecast, by Application 2020 & 2033
- Table 55: Global Beverage Crown Caps Revenue undefined Forecast, by Application 2020 & 2033
- Table 56: Global Beverage Crown Caps Volume K Forecast, by Application 2020 & 2033
- Table 57: Global Beverage Crown Caps Revenue undefined Forecast, by Types 2020 & 2033
- Table 58: Global Beverage Crown Caps Volume K Forecast, by Types 2020 & 2033
- Table 59: Global Beverage Crown Caps Revenue undefined Forecast, by Country 2020 & 2033
- Table 60: Global Beverage Crown Caps Volume K Forecast, by Country 2020 & 2033
- Table 61: Turkey Beverage Crown Caps Revenue (undefined) Forecast, by Application 2020 & 2033
- Table 62: Turkey Beverage Crown Caps Volume (K) Forecast, by Application 2020 & 2033
- Table 63: Israel Beverage Crown Caps Revenue (undefined) Forecast, by Application 2020 & 2033
- Table 64: Israel Beverage Crown Caps Volume (K) Forecast, by Application 2020 & 2033
- Table 65: GCC Beverage Crown Caps Revenue (undefined) Forecast, by Application 2020 & 2033
- Table 66: GCC Beverage Crown Caps Volume (K) Forecast, by Application 2020 & 2033
- Table 67: North Africa Beverage Crown Caps Revenue (undefined) Forecast, by Application 2020 & 2033
- Table 68: North Africa Beverage Crown Caps Volume (K) Forecast, by Application 2020 & 2033
- Table 69: South Africa Beverage Crown Caps Revenue (undefined) Forecast, by Application 2020 & 2033
- Table 70: South Africa Beverage Crown Caps Volume (K) Forecast, by Application 2020 & 2033
- Table 71: Rest of Middle East & Africa Beverage Crown Caps Revenue (undefined) Forecast, by Application 2020 & 2033
- Table 72: Rest of Middle East & Africa Beverage Crown Caps Volume (K) Forecast, by Application 2020 & 2033
- Table 73: Global Beverage Crown Caps Revenue undefined Forecast, by Application 2020 & 2033
- Table 74: Global Beverage Crown Caps Volume K Forecast, by Application 2020 & 2033
- Table 75: Global Beverage Crown Caps Revenue undefined Forecast, by Types 2020 & 2033
- Table 76: Global Beverage Crown Caps Volume K Forecast, by Types 2020 & 2033
- Table 77: Global Beverage Crown Caps Revenue undefined Forecast, by Country 2020 & 2033
- Table 78: Global Beverage Crown Caps Volume K Forecast, by Country 2020 & 2033
- Table 79: China Beverage Crown Caps Revenue (undefined) Forecast, by Application 2020 & 2033
- Table 80: China Beverage Crown Caps Volume (K) Forecast, by Application 2020 & 2033
- Table 81: India Beverage Crown Caps Revenue (undefined) Forecast, by Application 2020 & 2033
- Table 82: India Beverage Crown Caps Volume (K) Forecast, by Application 2020 & 2033
- Table 83: Japan Beverage Crown Caps Revenue (undefined) Forecast, by Application 2020 & 2033
- Table 84: Japan Beverage Crown Caps Volume (K) Forecast, by Application 2020 & 2033
- Table 85: South Korea Beverage Crown Caps Revenue (undefined) Forecast, by Application 2020 & 2033
- Table 86: South Korea Beverage Crown Caps Volume (K) Forecast, by Application 2020 & 2033
- Table 87: ASEAN Beverage Crown Caps Revenue (undefined) Forecast, by Application 2020 & 2033
- Table 88: ASEAN Beverage Crown Caps Volume (K) Forecast, by Application 2020 & 2033
- Table 89: Oceania Beverage Crown Caps Revenue (undefined) Forecast, by Application 2020 & 2033
- Table 90: Oceania Beverage Crown Caps Volume (K) Forecast, by Application 2020 & 2033
- Table 91: Rest of Asia Pacific Beverage Crown Caps Revenue (undefined) Forecast, by Application 2020 & 2033
- Table 92: Rest of Asia Pacific Beverage Crown Caps Volume (K) Forecast, by Application 2020 & 2033
Frequently Asked Questions
1. What is the projected Compound Annual Growth Rate (CAGR) of the Beverage Crown Caps?
The projected CAGR is approximately 4.7%.
2. Which companies are prominent players in the Beverage Crown Caps?
Key companies in the market include Crown Holdings Inc., Astir Vitogiannis Bros SA, PELLICONI & C. SPA, Finn-Korkki Oy, Nippon Closures Co. Ltd, Continental Crowns And Closures, RANKIN, SHREE BALAJI CLOSURES, Crown Seal Public Company Limited, Imran Crown Cork.
3. What are the main segments of the Beverage Crown Caps?
The market segments include Application, Types.
4. Can you provide details about the market size?
The market size is estimated to be USD XXX N/A as of 2022.
5. What are some drivers contributing to market growth?
N/A
6. What are the notable trends driving market growth?
N/A
7. Are there any restraints impacting market growth?
N/A
8. Can you provide examples of recent developments in the market?
N/A
9. What pricing options are available for accessing the report?
Pricing options include single-user, multi-user, and enterprise licenses priced at USD 4350.00, USD 6525.00, and USD 8700.00 respectively.
10. Is the market size provided in terms of value or volume?
The market size is provided in terms of value, measured in N/A and volume, measured in K.
11. Are there any specific market keywords associated with the report?
Yes, the market keyword associated with the report is "Beverage Crown Caps," which aids in identifying and referencing the specific market segment covered.
12. How do I determine which pricing option suits my needs best?
The pricing options vary based on user requirements and access needs. Individual users may opt for single-user licenses, while businesses requiring broader access may choose multi-user or enterprise licenses for cost-effective access to the report.
13. Are there any additional resources or data provided in the Beverage Crown Caps report?
While the report offers comprehensive insights, it's advisable to review the specific contents or supplementary materials provided to ascertain if additional resources or data are available.
14. How can I stay updated on further developments or reports in the Beverage Crown Caps?
To stay informed about further developments, trends, and reports in the Beverage Crown Caps, consider subscribing to industry newsletters, following relevant companies and organizations, or regularly checking reputable industry news sources and publications.
Methodology
Step 1 - Identification of Relevant Samples Size from Population Database


Step 2 - Approaches for Defining Global Market Size (Value, Volume* & Price*)

Note*: In applicable scenarios
Step 3 - Data Sources
Primary Research
- Web Analytics
- Survey Reports
- Research Institute
- Latest Research Reports
- Opinion Leaders
Secondary Research
- Annual Reports
- White Paper
- Latest Press Release
- Industry Association
- Paid Database
- Investor Presentations

Step 4 - Data Triangulation
Involves using different sources of information in order to increase the validity of a study
These sources are likely to be stakeholders in a program - participants, other researchers, program staff, other community members, and so on.
Then we put all data in single framework & apply various statistical tools to find out the dynamic on the market.
During the analysis stage, feedback from the stakeholder groups would be compared to determine areas of agreement as well as areas of divergence

