

Key Insights
The global beverage two-piece can market is experiencing significant expansion, driven by escalating demand for convenient and sustainable packaging in the beverage sector. Key growth drivers include the rising popularity of ready-to-drink beverages, carbonated soft drinks, and energy drinks. The inherent lightweight and recyclability of two-piece cans position them as an eco-friendly packaging solution, aligning with growing consumer preference for sustainable products and stringent global environmental regulations.
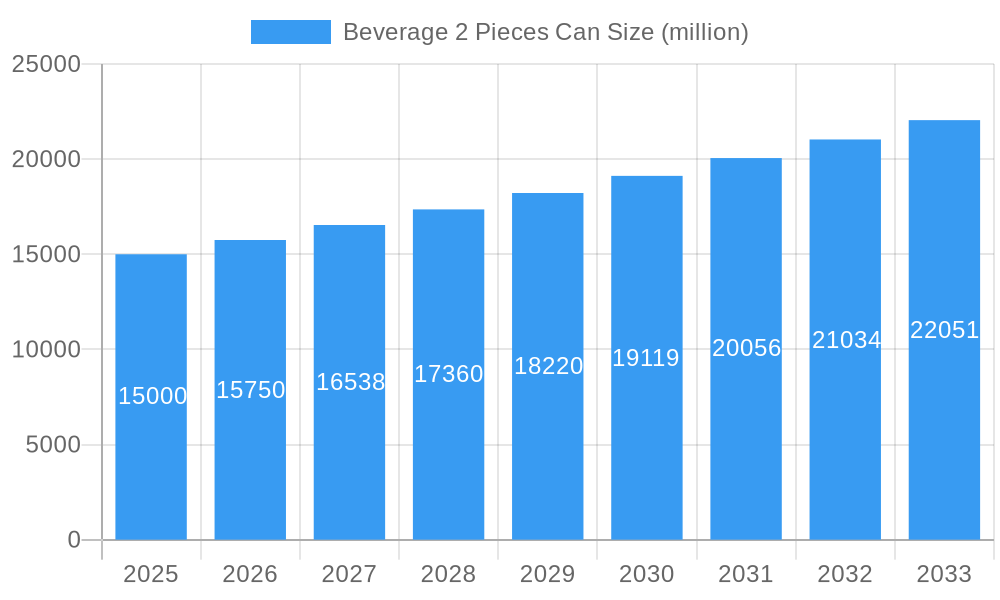
Beverage 2 Pieces Can Market Size (In Billion)
The market is projected to reach $4.96 billion by 2025, with a projected Compound Annual Growth Rate (CAGR) of 3.1% from 2025 to 2033. This growth is anticipated to be fueled by innovations in can design, materials, and manufacturing processes, enhancing product protection, extending shelf life, and improving aesthetics. Leading industry players are actively investing in research and development to meet evolving market demands.
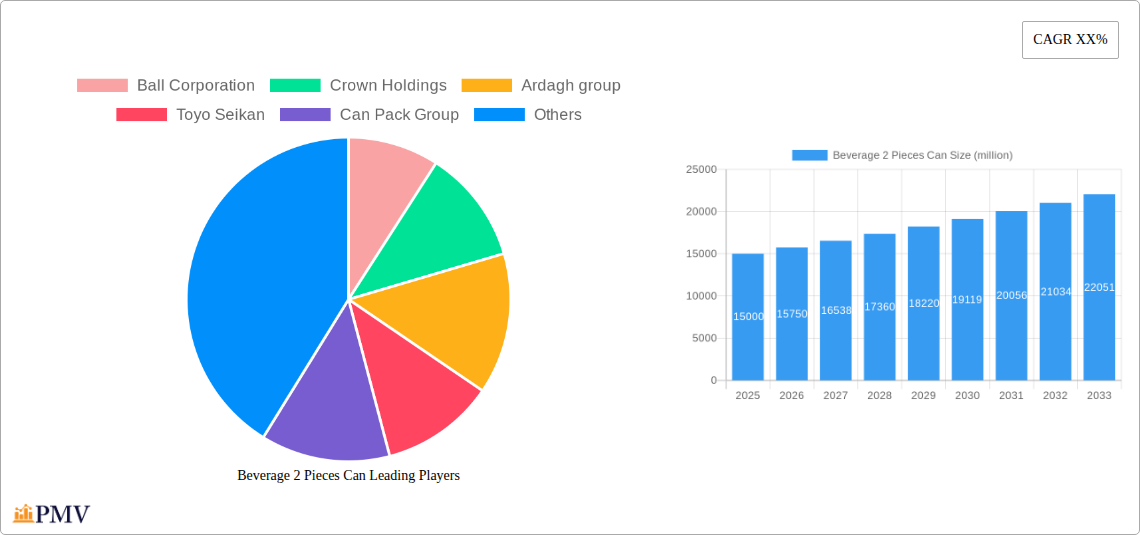
Beverage 2 Pieces Can Company Market Share
Market segmentation indicates a strong preference for aluminum cans, attributed to their recyclability and superior barrier properties. North America and Europe currently lead the market, with the Asia-Pacific region poised for substantial growth due to increasing disposable incomes and rising consumption of packaged beverages. Despite challenges such as fluctuating raw material prices and potential supply chain disruptions, the overall market outlook remains positive. The competitive landscape features a dynamic mix of multinational corporations and regional players, fostering continuous innovation. Technological advancements, including the development of thinner, lighter cans, are expected to further enhance efficiency and sustainability, contributing to the sustained expansion of the beverage two-piece can market.
Beverage 2 Pieces Can Market Report: 2019-2033 Forecast
This comprehensive report provides an in-depth analysis of the global beverage 2 pieces can market, offering invaluable insights for industry stakeholders, investors, and strategic decision-makers. Covering the period from 2019 to 2033, with a focus on the estimated year 2025, this report unveils the market's structure, competitive landscape, growth drivers, and future outlook. The market size is projected to reach millions of units by 2033, showcasing significant growth potential.
Beverage 2 Pieces Can Market Structure & Competitive Dynamics
The global beverage 2 pieces can market is characterized by a moderately concentrated structure, with several major players holding significant market share. Key players include Ball Corporation, Crown Holdings, Ardagh Group, Toyo Seikan, and others. The market exhibits a dynamic competitive landscape, shaped by ongoing mergers and acquisitions (M&A) activities, technological innovation, and evolving regulatory frameworks.
- Market Concentration: The top 5 players collectively hold an estimated xx% market share in 2025, indicating moderate concentration. This is expected to shift slightly by 2033, with projections showing a xx% combined market share.
- Innovation Ecosystems: Continuous advancements in can manufacturing technologies, including lightweighting and improved printing techniques, are driving innovation. The emergence of sustainable packaging solutions, like recycled aluminum cans, is also a key driver.
- Regulatory Frameworks: Government regulations concerning material sourcing, recycling, and labeling significantly impact the industry. Variations in these regulations across different regions present both opportunities and challenges.
- Product Substitutes: While aluminum cans remain dominant, they face competition from alternative packaging materials like glass bottles and flexible pouches. However, the superior properties of aluminum cans in terms of cost, recyclability, and preservation, continue to favor their market dominance.
- End-User Trends: The growing demand for convenient and sustainable packaging solutions is fueling the growth of the beverage 2 pieces can market. Consumer preference for on-the-go consumption patterns continues to be a major driver.
- M&A Activities: Over the historical period (2019-2024), several significant M&A deals valued at a total of approximately $xx million have reshaped the competitive landscape. Further consolidation is anticipated during the forecast period (2025-2033).
Beverage 2 Pieces Can Industry Trends & Insights
The beverage 2 pieces can market exhibits robust growth, driven by several key factors. The compound annual growth rate (CAGR) is projected to be xx% during the forecast period (2025-2033), exceeding the historical CAGR of xx% (2019-2024). This growth is fueled by increasing demand from the beverage industry, particularly for carbonated soft drinks, energy drinks, and beer.
Technological disruptions are shaping market dynamics, with advancements in manufacturing processes leading to improved efficiency, reduced costs, and enhanced product quality. Consumer preference for sustainable and eco-friendly packaging is also influencing industry trends, driving the adoption of recycled aluminum. The competitive landscape remains intense, with companies focusing on product differentiation, innovation, and cost optimization to maintain market share. Market penetration of aluminum cans in the beverage sector remains high and is expected to grow further, reaching xx% by 2033.
Dominant Markets & Segments in Beverage 2 Pieces Can
The North American region currently holds a dominant position in the global beverage 2 pieces can market, driven by strong consumer demand and a well-established infrastructure. However, Asia-Pacific is showing exceptional growth, fueled by rising disposable incomes and increasing consumption of beverages in emerging economies.
Key Drivers of North American Dominance:
- Well-established beverage industry.
- High per capita consumption of beverages.
- Strong infrastructure for can manufacturing and distribution.
- Favorable economic conditions.
Key Drivers of Asia-Pacific Growth:
- Rapidly expanding middle class.
- Increasing urbanization.
- Growing demand for convenience foods and beverages.
- Government support for infrastructure development.
Detailed analysis reveals that while North America maintains a leading position, the Asia-Pacific market is poised for significant growth, potentially overtaking North America in market share by 2033.
Beverage 2 Pieces Can Product Innovations
Recent innovations in beverage 2 pieces cans focus on improved sustainability, enhanced functionality, and differentiated designs. Lightweighting technologies are reducing material usage, while advancements in printing techniques are improving branding and aesthetics. The incorporation of recycled aluminum is gaining traction, aligning with growing consumer demand for eco-friendly packaging. These innovations are enhancing the competitive advantages of beverage 2 pieces cans, ensuring continued market relevance.
Report Segmentation & Scope
This report segments the beverage 2 pieces can market based on several factors:
By Material: Aluminum, Steel (and their combinations). Aluminum cans dominate the market due to their lightweight and recyclable nature. Growth projections for both segments are strong, driven by the factors previously mentioned.
By Application: Carbonated Soft Drinks (CSDs), Beer, Energy Drinks, Juices, Other Beverages. CSDs currently hold the largest market share, followed by beer and energy drinks. Growth in all segments is expected, with energy drinks demonstrating particularly strong potential.
By Region: North America, Europe, Asia-Pacific, Middle East & Africa, South America. Each region’s market size and dynamics are explored in detail. Competitive dynamics vary across regions, reflecting differences in consumer preferences, regulatory frameworks, and industry structures.
Key Drivers of Beverage 2 Pieces Can Growth
Several factors are driving the growth of the beverage 2 pieces can market:
- Technological advancements: Lightweighting and improved printing technologies reduce costs and enhance aesthetic appeal.
- Growing demand for convenience: Consumers increasingly favor on-the-go consumption, driving demand for convenient packaging solutions.
- Sustainable packaging trends: Increased focus on environmental concerns is boosting demand for recyclable aluminum cans.
- Economic growth in emerging markets: Rising disposable incomes in developing countries fuel higher beverage consumption.
Challenges in the Beverage 2 Pieces Can Sector
The beverage 2 pieces can sector faces several challenges:
- Fluctuating raw material prices: Aluminum prices impact manufacturing costs and profitability.
- Stringent environmental regulations: Compliance costs and limitations can impact operations.
- Intense competition: Companies face pressure to innovate and offer competitive pricing.
- Supply chain disruptions: Global events can cause shortages and delays. The impact of these disruptions is quantified in the report, detailing the effects on market stability and price volatility.
Leading Players in the Beverage 2 Pieces Can Market
- Ball Corporation
- Crown Holdings
- Ardagh Group
- Toyo Seikan
- Can Pack Group
- Silgan Holdings Inc
- Daiwa Can Company
- Baosteel Packaging
- ORG Technology
- ShengXing Group
- CPMC Holdings
- Hokkan Holdings
- Showa Aluminum Can Corporation
- United Can (Great China Metal)
- Kingcan Holdings
- Jiamei Food Packaging
- Jiyuan Packaging Holdings
Key Developments in Beverage 2 Pieces Can Sector
- 2022 Q3: Ball Corporation announces investment in a new recycling facility.
- 2023 Q1: Crown Holdings launches a new line of sustainable cans.
- 2024 Q2: Ardagh Group acquires a smaller can manufacturer. (Further details of specific dates and impact will be elaborated within the full report).
Strategic Beverage 2 Pieces Can Market Outlook
The beverage 2 pieces can market is poised for continued growth, driven by persistent demand, innovation, and sustainability trends. Strategic opportunities exist for companies focused on sustainable solutions, innovative designs, and efficient supply chain management. Growth in emerging markets presents substantial potential, while technological advancements will continue to shape the industry's trajectory. The market's future success hinges on adapting to changing consumer preferences and environmental regulations.
Beverage 2 Pieces Can Segmentation
-
1. Application
- 1.1. Beer
- 1.2. Carbonated Drinks
- 1.3. Others
-
2. Types
- 2.1. Steel
- 2.2. Aluminum
Beverage 2 Pieces Can Segmentation By Geography
-
1. North America
- 1.1. United States
- 1.2. Canada
- 1.3. Mexico
-
2. South America
- 2.1. Brazil
- 2.2. Argentina
- 2.3. Rest of South America
-
3. Europe
- 3.1. United Kingdom
- 3.2. Germany
- 3.3. France
- 3.4. Italy
- 3.5. Spain
- 3.6. Russia
- 3.7. Benelux
- 3.8. Nordics
- 3.9. Rest of Europe
-
4. Middle East & Africa
- 4.1. Turkey
- 4.2. Israel
- 4.3. GCC
- 4.4. North Africa
- 4.5. South Africa
- 4.6. Rest of Middle East & Africa
-
5. Asia Pacific
- 5.1. China
- 5.2. India
- 5.3. Japan
- 5.4. South Korea
- 5.5. ASEAN
- 5.6. Oceania
- 5.7. Rest of Asia Pacific

Beverage 2 Pieces Can Regional Market Share
Geographic Coverage of Beverage 2 Pieces Can
Beverage 2 Pieces Can REPORT HIGHLIGHTS
| Aspects | Details |
|---|---|
| Study Period | 2020-2034 |
| Base Year | 2025 |
| Estimated Year | 2026 |
| Forecast Period | 2026-2034 |
| Historical Period | 2020-2025 |
| Growth Rate | CAGR of 3.1% from 2020-2034 |
| Segmentation |
|
Table of Contents
- 1. Introduction
- 1.1. Research Scope
- 1.2. Market Segmentation
- 1.3. Research Objective
- 1.4. Definitions and Assumptions
- 2. Executive Summary
- 2.1. Market Snapshot
- 3. Market Dynamics
- 3.1. Market Drivers
- 3.2. Market Restrains
- 3.3. Market Trends
- 3.4. Market Opportunities
- 4. Market Factor Analysis
- 4.1. Porters Five Forces
- 4.1.1. Bargaining Power of Suppliers
- 4.1.2. Bargaining Power of Buyers
- 4.1.3. Threat of New Entrants
- 4.1.4. Threat of Substitutes
- 4.1.5. Competitive Rivalry
- 4.2. PESTEL analysis
- 4.3. BCG Analysis
- 4.3.1. Stars (High Growth, High Market Share)
- 4.3.2. Cash Cows (Low Growth, High Market Share)
- 4.3.3. Question Mark (High Growth, Low Market Share)
- 4.3.4. Dogs (Low Growth, Low Market Share)
- 4.4. Ansoff Matrix Analysis
- 4.5. Supply Chain Analysis
- 4.6. Regulatory Landscape
- 4.7. Current Market Potential and Opportunity Assessment (TAM–SAM–SOM Framework)
- 4.8. PMV Analyst Note
- 4.1. Porters Five Forces
- 5. Market Analysis, Insights and Forecast 2021-2033
- 5.1. Market Analysis, Insights and Forecast - by Application
- 5.1.1. Beer
- 5.1.2. Carbonated Drinks
- 5.1.3. Others
- 5.2. Market Analysis, Insights and Forecast - by Types
- 5.2.1. Steel
- 5.2.2. Aluminum
- 5.3. Market Analysis, Insights and Forecast - by Region
- 5.3.1. North America
- 5.3.2. South America
- 5.3.3. Europe
- 5.3.4. Middle East & Africa
- 5.3.5. Asia Pacific
- 5.1. Market Analysis, Insights and Forecast - by Application
- 6. Global Beverage 2 Pieces Can Analysis, Insights and Forecast, 2021-2033
- 6.1. Market Analysis, Insights and Forecast - by Application
- 6.1.1. Beer
- 6.1.2. Carbonated Drinks
- 6.1.3. Others
- 6.2. Market Analysis, Insights and Forecast - by Types
- 6.2.1. Steel
- 6.2.2. Aluminum
- 6.1. Market Analysis, Insights and Forecast - by Application
- 7. North America Beverage 2 Pieces Can Analysis, Insights and Forecast, 2020-2032
- 7.1. Market Analysis, Insights and Forecast - by Application
- 7.1.1. Beer
- 7.1.2. Carbonated Drinks
- 7.1.3. Others
- 7.2. Market Analysis, Insights and Forecast - by Types
- 7.2.1. Steel
- 7.2.2. Aluminum
- 7.1. Market Analysis, Insights and Forecast - by Application
- 8. South America Beverage 2 Pieces Can Analysis, Insights and Forecast, 2020-2032
- 8.1. Market Analysis, Insights and Forecast - by Application
- 8.1.1. Beer
- 8.1.2. Carbonated Drinks
- 8.1.3. Others
- 8.2. Market Analysis, Insights and Forecast - by Types
- 8.2.1. Steel
- 8.2.2. Aluminum
- 8.1. Market Analysis, Insights and Forecast - by Application
- 9. Europe Beverage 2 Pieces Can Analysis, Insights and Forecast, 2020-2032
- 9.1. Market Analysis, Insights and Forecast - by Application
- 9.1.1. Beer
- 9.1.2. Carbonated Drinks
- 9.1.3. Others
- 9.2. Market Analysis, Insights and Forecast - by Types
- 9.2.1. Steel
- 9.2.2. Aluminum
- 9.1. Market Analysis, Insights and Forecast - by Application
- 10. Middle East & Africa Beverage 2 Pieces Can Analysis, Insights and Forecast, 2020-2032
- 10.1. Market Analysis, Insights and Forecast - by Application
- 10.1.1. Beer
- 10.1.2. Carbonated Drinks
- 10.1.3. Others
- 10.2. Market Analysis, Insights and Forecast - by Types
- 10.2.1. Steel
- 10.2.2. Aluminum
- 10.1. Market Analysis, Insights and Forecast - by Application
- 11. Asia Pacific Beverage 2 Pieces Can Analysis, Insights and Forecast, 2020-2032
- 11.1. Market Analysis, Insights and Forecast - by Application
- 11.1.1. Beer
- 11.1.2. Carbonated Drinks
- 11.1.3. Others
- 11.2. Market Analysis, Insights and Forecast - by Types
- 11.2.1. Steel
- 11.2.2. Aluminum
- 11.1. Market Analysis, Insights and Forecast - by Application
- 12. Competitive Analysis
- 12.1. Company Profiles
- 12.1.1 Ball Corporation
- 12.1.1.1. Company Overview
- 12.1.1.2. Products
- 12.1.1.3. Company Financials
- 12.1.1.4. SWOT Analysis
- 12.1.2 Crown Holdings
- 12.1.2.1. Company Overview
- 12.1.2.2. Products
- 12.1.2.3. Company Financials
- 12.1.2.4. SWOT Analysis
- 12.1.3 Ardagh group
- 12.1.3.1. Company Overview
- 12.1.3.2. Products
- 12.1.3.3. Company Financials
- 12.1.3.4. SWOT Analysis
- 12.1.4 Toyo Seikan
- 12.1.4.1. Company Overview
- 12.1.4.2. Products
- 12.1.4.3. Company Financials
- 12.1.4.4. SWOT Analysis
- 12.1.5 Can Pack Group
- 12.1.5.1. Company Overview
- 12.1.5.2. Products
- 12.1.5.3. Company Financials
- 12.1.5.4. SWOT Analysis
- 12.1.6 Silgan Holdings Inc
- 12.1.6.1. Company Overview
- 12.1.6.2. Products
- 12.1.6.3. Company Financials
- 12.1.6.4. SWOT Analysis
- 12.1.7 Daiwa Can Company
- 12.1.7.1. Company Overview
- 12.1.7.2. Products
- 12.1.7.3. Company Financials
- 12.1.7.4. SWOT Analysis
- 12.1.8 Baosteel Packaging
- 12.1.8.1. Company Overview
- 12.1.8.2. Products
- 12.1.8.3. Company Financials
- 12.1.8.4. SWOT Analysis
- 12.1.9 ORG Technology
- 12.1.9.1. Company Overview
- 12.1.9.2. Products
- 12.1.9.3. Company Financials
- 12.1.9.4. SWOT Analysis
- 12.1.10 ShengXing Group
- 12.1.10.1. Company Overview
- 12.1.10.2. Products
- 12.1.10.3. Company Financials
- 12.1.10.4. SWOT Analysis
- 12.1.11 CPMC Holdings
- 12.1.11.1. Company Overview
- 12.1.11.2. Products
- 12.1.11.3. Company Financials
- 12.1.11.4. SWOT Analysis
- 12.1.12 Hokkan Holdings
- 12.1.12.1. Company Overview
- 12.1.12.2. Products
- 12.1.12.3. Company Financials
- 12.1.12.4. SWOT Analysis
- 12.1.13 Showa Aluminum Can Corporation
- 12.1.13.1. Company Overview
- 12.1.13.2. Products
- 12.1.13.3. Company Financials
- 12.1.13.4. SWOT Analysis
- 12.1.14 United Can (Great China Metal)
- 12.1.14.1. Company Overview
- 12.1.14.2. Products
- 12.1.14.3. Company Financials
- 12.1.14.4. SWOT Analysis
- 12.1.15 Kingcan Holdings
- 12.1.15.1. Company Overview
- 12.1.15.2. Products
- 12.1.15.3. Company Financials
- 12.1.15.4. SWOT Analysis
- 12.1.16 Jiamei Food Packaging
- 12.1.16.1. Company Overview
- 12.1.16.2. Products
- 12.1.16.3. Company Financials
- 12.1.16.4. SWOT Analysis
- 12.1.17 Jiyuan Packaging Holdings
- 12.1.17.1. Company Overview
- 12.1.17.2. Products
- 12.1.17.3. Company Financials
- 12.1.17.4. SWOT Analysis
- 12.1.1 Ball Corporation
- 12.2. Market Entropy
- 12.2.1 Company's Key Areas Served
- 12.2.2 Recent Developments
- 12.3. Company Market Share Analysis 2025
- 12.3.1 Top 5 Companies Market Share Analysis
- 12.3.2 Top 3 Companies Market Share Analysis
- 12.4. List of Potential Customers
- 13. Research Methodology
List of Figures
- Figure 1: Global Beverage 2 Pieces Can Revenue Breakdown (billion, %) by Region 2025 & 2033
- Figure 2: Global Beverage 2 Pieces Can Volume Breakdown (K, %) by Region 2025 & 2033
- Figure 3: North America Beverage 2 Pieces Can Revenue (billion), by Application 2025 & 2033
- Figure 4: North America Beverage 2 Pieces Can Volume (K), by Application 2025 & 2033
- Figure 5: North America Beverage 2 Pieces Can Revenue Share (%), by Application 2025 & 2033
- Figure 6: North America Beverage 2 Pieces Can Volume Share (%), by Application 2025 & 2033
- Figure 7: North America Beverage 2 Pieces Can Revenue (billion), by Types 2025 & 2033
- Figure 8: North America Beverage 2 Pieces Can Volume (K), by Types 2025 & 2033
- Figure 9: North America Beverage 2 Pieces Can Revenue Share (%), by Types 2025 & 2033
- Figure 10: North America Beverage 2 Pieces Can Volume Share (%), by Types 2025 & 2033
- Figure 11: North America Beverage 2 Pieces Can Revenue (billion), by Country 2025 & 2033
- Figure 12: North America Beverage 2 Pieces Can Volume (K), by Country 2025 & 2033
- Figure 13: North America Beverage 2 Pieces Can Revenue Share (%), by Country 2025 & 2033
- Figure 14: North America Beverage 2 Pieces Can Volume Share (%), by Country 2025 & 2033
- Figure 15: South America Beverage 2 Pieces Can Revenue (billion), by Application 2025 & 2033
- Figure 16: South America Beverage 2 Pieces Can Volume (K), by Application 2025 & 2033
- Figure 17: South America Beverage 2 Pieces Can Revenue Share (%), by Application 2025 & 2033
- Figure 18: South America Beverage 2 Pieces Can Volume Share (%), by Application 2025 & 2033
- Figure 19: South America Beverage 2 Pieces Can Revenue (billion), by Types 2025 & 2033
- Figure 20: South America Beverage 2 Pieces Can Volume (K), by Types 2025 & 2033
- Figure 21: South America Beverage 2 Pieces Can Revenue Share (%), by Types 2025 & 2033
- Figure 22: South America Beverage 2 Pieces Can Volume Share (%), by Types 2025 & 2033
- Figure 23: South America Beverage 2 Pieces Can Revenue (billion), by Country 2025 & 2033
- Figure 24: South America Beverage 2 Pieces Can Volume (K), by Country 2025 & 2033
- Figure 25: South America Beverage 2 Pieces Can Revenue Share (%), by Country 2025 & 2033
- Figure 26: South America Beverage 2 Pieces Can Volume Share (%), by Country 2025 & 2033
- Figure 27: Europe Beverage 2 Pieces Can Revenue (billion), by Application 2025 & 2033
- Figure 28: Europe Beverage 2 Pieces Can Volume (K), by Application 2025 & 2033
- Figure 29: Europe Beverage 2 Pieces Can Revenue Share (%), by Application 2025 & 2033
- Figure 30: Europe Beverage 2 Pieces Can Volume Share (%), by Application 2025 & 2033
- Figure 31: Europe Beverage 2 Pieces Can Revenue (billion), by Types 2025 & 2033
- Figure 32: Europe Beverage 2 Pieces Can Volume (K), by Types 2025 & 2033
- Figure 33: Europe Beverage 2 Pieces Can Revenue Share (%), by Types 2025 & 2033
- Figure 34: Europe Beverage 2 Pieces Can Volume Share (%), by Types 2025 & 2033
- Figure 35: Europe Beverage 2 Pieces Can Revenue (billion), by Country 2025 & 2033
- Figure 36: Europe Beverage 2 Pieces Can Volume (K), by Country 2025 & 2033
- Figure 37: Europe Beverage 2 Pieces Can Revenue Share (%), by Country 2025 & 2033
- Figure 38: Europe Beverage 2 Pieces Can Volume Share (%), by Country 2025 & 2033
- Figure 39: Middle East & Africa Beverage 2 Pieces Can Revenue (billion), by Application 2025 & 2033
- Figure 40: Middle East & Africa Beverage 2 Pieces Can Volume (K), by Application 2025 & 2033
- Figure 41: Middle East & Africa Beverage 2 Pieces Can Revenue Share (%), by Application 2025 & 2033
- Figure 42: Middle East & Africa Beverage 2 Pieces Can Volume Share (%), by Application 2025 & 2033
- Figure 43: Middle East & Africa Beverage 2 Pieces Can Revenue (billion), by Types 2025 & 2033
- Figure 44: Middle East & Africa Beverage 2 Pieces Can Volume (K), by Types 2025 & 2033
- Figure 45: Middle East & Africa Beverage 2 Pieces Can Revenue Share (%), by Types 2025 & 2033
- Figure 46: Middle East & Africa Beverage 2 Pieces Can Volume Share (%), by Types 2025 & 2033
- Figure 47: Middle East & Africa Beverage 2 Pieces Can Revenue (billion), by Country 2025 & 2033
- Figure 48: Middle East & Africa Beverage 2 Pieces Can Volume (K), by Country 2025 & 2033
- Figure 49: Middle East & Africa Beverage 2 Pieces Can Revenue Share (%), by Country 2025 & 2033
- Figure 50: Middle East & Africa Beverage 2 Pieces Can Volume Share (%), by Country 2025 & 2033
- Figure 51: Asia Pacific Beverage 2 Pieces Can Revenue (billion), by Application 2025 & 2033
- Figure 52: Asia Pacific Beverage 2 Pieces Can Volume (K), by Application 2025 & 2033
- Figure 53: Asia Pacific Beverage 2 Pieces Can Revenue Share (%), by Application 2025 & 2033
- Figure 54: Asia Pacific Beverage 2 Pieces Can Volume Share (%), by Application 2025 & 2033
- Figure 55: Asia Pacific Beverage 2 Pieces Can Revenue (billion), by Types 2025 & 2033
- Figure 56: Asia Pacific Beverage 2 Pieces Can Volume (K), by Types 2025 & 2033
- Figure 57: Asia Pacific Beverage 2 Pieces Can Revenue Share (%), by Types 2025 & 2033
- Figure 58: Asia Pacific Beverage 2 Pieces Can Volume Share (%), by Types 2025 & 2033
- Figure 59: Asia Pacific Beverage 2 Pieces Can Revenue (billion), by Country 2025 & 2033
- Figure 60: Asia Pacific Beverage 2 Pieces Can Volume (K), by Country 2025 & 2033
- Figure 61: Asia Pacific Beverage 2 Pieces Can Revenue Share (%), by Country 2025 & 2033
- Figure 62: Asia Pacific Beverage 2 Pieces Can Volume Share (%), by Country 2025 & 2033
List of Tables
- Table 1: Global Beverage 2 Pieces Can Revenue billion Forecast, by Application 2020 & 2033
- Table 2: Global Beverage 2 Pieces Can Volume K Forecast, by Application 2020 & 2033
- Table 3: Global Beverage 2 Pieces Can Revenue billion Forecast, by Types 2020 & 2033
- Table 4: Global Beverage 2 Pieces Can Volume K Forecast, by Types 2020 & 2033
- Table 5: Global Beverage 2 Pieces Can Revenue billion Forecast, by Region 2020 & 2033
- Table 6: Global Beverage 2 Pieces Can Volume K Forecast, by Region 2020 & 2033
- Table 7: Global Beverage 2 Pieces Can Revenue billion Forecast, by Application 2020 & 2033
- Table 8: Global Beverage 2 Pieces Can Volume K Forecast, by Application 2020 & 2033
- Table 9: Global Beverage 2 Pieces Can Revenue billion Forecast, by Types 2020 & 2033
- Table 10: Global Beverage 2 Pieces Can Volume K Forecast, by Types 2020 & 2033
- Table 11: Global Beverage 2 Pieces Can Revenue billion Forecast, by Country 2020 & 2033
- Table 12: Global Beverage 2 Pieces Can Volume K Forecast, by Country 2020 & 2033
- Table 13: United States Beverage 2 Pieces Can Revenue (billion) Forecast, by Application 2020 & 2033
- Table 14: United States Beverage 2 Pieces Can Volume (K) Forecast, by Application 2020 & 2033
- Table 15: Canada Beverage 2 Pieces Can Revenue (billion) Forecast, by Application 2020 & 2033
- Table 16: Canada Beverage 2 Pieces Can Volume (K) Forecast, by Application 2020 & 2033
- Table 17: Mexico Beverage 2 Pieces Can Revenue (billion) Forecast, by Application 2020 & 2033
- Table 18: Mexico Beverage 2 Pieces Can Volume (K) Forecast, by Application 2020 & 2033
- Table 19: Global Beverage 2 Pieces Can Revenue billion Forecast, by Application 2020 & 2033
- Table 20: Global Beverage 2 Pieces Can Volume K Forecast, by Application 2020 & 2033
- Table 21: Global Beverage 2 Pieces Can Revenue billion Forecast, by Types 2020 & 2033
- Table 22: Global Beverage 2 Pieces Can Volume K Forecast, by Types 2020 & 2033
- Table 23: Global Beverage 2 Pieces Can Revenue billion Forecast, by Country 2020 & 2033
- Table 24: Global Beverage 2 Pieces Can Volume K Forecast, by Country 2020 & 2033
- Table 25: Brazil Beverage 2 Pieces Can Revenue (billion) Forecast, by Application 2020 & 2033
- Table 26: Brazil Beverage 2 Pieces Can Volume (K) Forecast, by Application 2020 & 2033
- Table 27: Argentina Beverage 2 Pieces Can Revenue (billion) Forecast, by Application 2020 & 2033
- Table 28: Argentina Beverage 2 Pieces Can Volume (K) Forecast, by Application 2020 & 2033
- Table 29: Rest of South America Beverage 2 Pieces Can Revenue (billion) Forecast, by Application 2020 & 2033
- Table 30: Rest of South America Beverage 2 Pieces Can Volume (K) Forecast, by Application 2020 & 2033
- Table 31: Global Beverage 2 Pieces Can Revenue billion Forecast, by Application 2020 & 2033
- Table 32: Global Beverage 2 Pieces Can Volume K Forecast, by Application 2020 & 2033
- Table 33: Global Beverage 2 Pieces Can Revenue billion Forecast, by Types 2020 & 2033
- Table 34: Global Beverage 2 Pieces Can Volume K Forecast, by Types 2020 & 2033
- Table 35: Global Beverage 2 Pieces Can Revenue billion Forecast, by Country 2020 & 2033
- Table 36: Global Beverage 2 Pieces Can Volume K Forecast, by Country 2020 & 2033
- Table 37: United Kingdom Beverage 2 Pieces Can Revenue (billion) Forecast, by Application 2020 & 2033
- Table 38: United Kingdom Beverage 2 Pieces Can Volume (K) Forecast, by Application 2020 & 2033
- Table 39: Germany Beverage 2 Pieces Can Revenue (billion) Forecast, by Application 2020 & 2033
- Table 40: Germany Beverage 2 Pieces Can Volume (K) Forecast, by Application 2020 & 2033
- Table 41: France Beverage 2 Pieces Can Revenue (billion) Forecast, by Application 2020 & 2033
- Table 42: France Beverage 2 Pieces Can Volume (K) Forecast, by Application 2020 & 2033
- Table 43: Italy Beverage 2 Pieces Can Revenue (billion) Forecast, by Application 2020 & 2033
- Table 44: Italy Beverage 2 Pieces Can Volume (K) Forecast, by Application 2020 & 2033
- Table 45: Spain Beverage 2 Pieces Can Revenue (billion) Forecast, by Application 2020 & 2033
- Table 46: Spain Beverage 2 Pieces Can Volume (K) Forecast, by Application 2020 & 2033
- Table 47: Russia Beverage 2 Pieces Can Revenue (billion) Forecast, by Application 2020 & 2033
- Table 48: Russia Beverage 2 Pieces Can Volume (K) Forecast, by Application 2020 & 2033
- Table 49: Benelux Beverage 2 Pieces Can Revenue (billion) Forecast, by Application 2020 & 2033
- Table 50: Benelux Beverage 2 Pieces Can Volume (K) Forecast, by Application 2020 & 2033
- Table 51: Nordics Beverage 2 Pieces Can Revenue (billion) Forecast, by Application 2020 & 2033
- Table 52: Nordics Beverage 2 Pieces Can Volume (K) Forecast, by Application 2020 & 2033
- Table 53: Rest of Europe Beverage 2 Pieces Can Revenue (billion) Forecast, by Application 2020 & 2033
- Table 54: Rest of Europe Beverage 2 Pieces Can Volume (K) Forecast, by Application 2020 & 2033
- Table 55: Global Beverage 2 Pieces Can Revenue billion Forecast, by Application 2020 & 2033
- Table 56: Global Beverage 2 Pieces Can Volume K Forecast, by Application 2020 & 2033
- Table 57: Global Beverage 2 Pieces Can Revenue billion Forecast, by Types 2020 & 2033
- Table 58: Global Beverage 2 Pieces Can Volume K Forecast, by Types 2020 & 2033
- Table 59: Global Beverage 2 Pieces Can Revenue billion Forecast, by Country 2020 & 2033
- Table 60: Global Beverage 2 Pieces Can Volume K Forecast, by Country 2020 & 2033
- Table 61: Turkey Beverage 2 Pieces Can Revenue (billion) Forecast, by Application 2020 & 2033
- Table 62: Turkey Beverage 2 Pieces Can Volume (K) Forecast, by Application 2020 & 2033
- Table 63: Israel Beverage 2 Pieces Can Revenue (billion) Forecast, by Application 2020 & 2033
- Table 64: Israel Beverage 2 Pieces Can Volume (K) Forecast, by Application 2020 & 2033
- Table 65: GCC Beverage 2 Pieces Can Revenue (billion) Forecast, by Application 2020 & 2033
- Table 66: GCC Beverage 2 Pieces Can Volume (K) Forecast, by Application 2020 & 2033
- Table 67: North Africa Beverage 2 Pieces Can Revenue (billion) Forecast, by Application 2020 & 2033
- Table 68: North Africa Beverage 2 Pieces Can Volume (K) Forecast, by Application 2020 & 2033
- Table 69: South Africa Beverage 2 Pieces Can Revenue (billion) Forecast, by Application 2020 & 2033
- Table 70: South Africa Beverage 2 Pieces Can Volume (K) Forecast, by Application 2020 & 2033
- Table 71: Rest of Middle East & Africa Beverage 2 Pieces Can Revenue (billion) Forecast, by Application 2020 & 2033
- Table 72: Rest of Middle East & Africa Beverage 2 Pieces Can Volume (K) Forecast, by Application 2020 & 2033
- Table 73: Global Beverage 2 Pieces Can Revenue billion Forecast, by Application 2020 & 2033
- Table 74: Global Beverage 2 Pieces Can Volume K Forecast, by Application 2020 & 2033
- Table 75: Global Beverage 2 Pieces Can Revenue billion Forecast, by Types 2020 & 2033
- Table 76: Global Beverage 2 Pieces Can Volume K Forecast, by Types 2020 & 2033
- Table 77: Global Beverage 2 Pieces Can Revenue billion Forecast, by Country 2020 & 2033
- Table 78: Global Beverage 2 Pieces Can Volume K Forecast, by Country 2020 & 2033
- Table 79: China Beverage 2 Pieces Can Revenue (billion) Forecast, by Application 2020 & 2033
- Table 80: China Beverage 2 Pieces Can Volume (K) Forecast, by Application 2020 & 2033
- Table 81: India Beverage 2 Pieces Can Revenue (billion) Forecast, by Application 2020 & 2033
- Table 82: India Beverage 2 Pieces Can Volume (K) Forecast, by Application 2020 & 2033
- Table 83: Japan Beverage 2 Pieces Can Revenue (billion) Forecast, by Application 2020 & 2033
- Table 84: Japan Beverage 2 Pieces Can Volume (K) Forecast, by Application 2020 & 2033
- Table 85: South Korea Beverage 2 Pieces Can Revenue (billion) Forecast, by Application 2020 & 2033
- Table 86: South Korea Beverage 2 Pieces Can Volume (K) Forecast, by Application 2020 & 2033
- Table 87: ASEAN Beverage 2 Pieces Can Revenue (billion) Forecast, by Application 2020 & 2033
- Table 88: ASEAN Beverage 2 Pieces Can Volume (K) Forecast, by Application 2020 & 2033
- Table 89: Oceania Beverage 2 Pieces Can Revenue (billion) Forecast, by Application 2020 & 2033
- Table 90: Oceania Beverage 2 Pieces Can Volume (K) Forecast, by Application 2020 & 2033
- Table 91: Rest of Asia Pacific Beverage 2 Pieces Can Revenue (billion) Forecast, by Application 2020 & 2033
- Table 92: Rest of Asia Pacific Beverage 2 Pieces Can Volume (K) Forecast, by Application 2020 & 2033
Frequently Asked Questions
1. What is the projected Compound Annual Growth Rate (CAGR) of the Beverage 2 Pieces Can?
The projected CAGR is approximately 3.1%.
2. Which companies are prominent players in the Beverage 2 Pieces Can?
Key companies in the market include Ball Corporation, Crown Holdings, Ardagh group, Toyo Seikan, Can Pack Group, Silgan Holdings Inc, Daiwa Can Company, Baosteel Packaging, ORG Technology, ShengXing Group, CPMC Holdings, Hokkan Holdings, Showa Aluminum Can Corporation, United Can (Great China Metal), Kingcan Holdings, Jiamei Food Packaging, Jiyuan Packaging Holdings.
3. What are the main segments of the Beverage 2 Pieces Can?
The market segments include Application, Types.
4. Can you provide details about the market size?
The market size is estimated to be USD 4.96 billion as of 2022.
5. What are some drivers contributing to market growth?
N/A
6. What are the notable trends driving market growth?
N/A
7. Are there any restraints impacting market growth?
N/A
8. Can you provide examples of recent developments in the market?
N/A
9. What pricing options are available for accessing the report?
Pricing options include single-user, multi-user, and enterprise licenses priced at USD 3350.00, USD 5025.00, and USD 6700.00 respectively.
10. Is the market size provided in terms of value or volume?
The market size is provided in terms of value, measured in billion and volume, measured in K.
11. Are there any specific market keywords associated with the report?
Yes, the market keyword associated with the report is "Beverage 2 Pieces Can," which aids in identifying and referencing the specific market segment covered.
12. How do I determine which pricing option suits my needs best?
The pricing options vary based on user requirements and access needs. Individual users may opt for single-user licenses, while businesses requiring broader access may choose multi-user or enterprise licenses for cost-effective access to the report.
13. Are there any additional resources or data provided in the Beverage 2 Pieces Can report?
While the report offers comprehensive insights, it's advisable to review the specific contents or supplementary materials provided to ascertain if additional resources or data are available.
14. How can I stay updated on further developments or reports in the Beverage 2 Pieces Can?
To stay informed about further developments, trends, and reports in the Beverage 2 Pieces Can, consider subscribing to industry newsletters, following relevant companies and organizations, or regularly checking reputable industry news sources and publications.
Methodology
Step 1 - Identification of Relevant Samples Size from Population Database


Step 2 - Approaches for Defining Global Market Size (Value, Volume* & Price*)

Note*: In applicable scenarios
Step 3 - Data Sources
Primary Research
- Web Analytics
- Survey Reports
- Research Institute
- Latest Research Reports
- Opinion Leaders
Secondary Research
- Annual Reports
- White Paper
- Latest Press Release
- Industry Association
- Paid Database
- Investor Presentations

Step 4 - Data Triangulation
Involves using different sources of information in order to increase the validity of a study
These sources are likely to be stakeholders in a program - participants, other researchers, program staff, other community members, and so on.
Then we put all data in single framework & apply various statistical tools to find out the dynamic on the market.
During the analysis stage, feedback from the stakeholder groups would be compared to determine areas of agreement as well as areas of divergence