

Key Insights
The global market for battery dangerous goods packaging is experiencing robust growth, driven by the escalating demand for lithium-ion batteries in electric vehicles, consumer electronics, and energy storage systems. The increasing stringency of regulations surrounding the safe transport of hazardous materials, particularly batteries, is a significant catalyst for market expansion. Companies are investing heavily in innovative packaging solutions that meet these stringent safety standards, incorporating advanced materials and designs to minimize the risk of damage, leakage, and fire during transit. The market is segmented by packaging type (e.g., UN-certified boxes, specialized containers, bulk packaging), battery type (lithium-ion, lead-acid, etc.), and end-use industry (automotive, electronics, etc.). Competition is intense, with established players and new entrants vying for market share through product innovation, strategic partnerships, and geographic expansion. While rising raw material costs pose a challenge, the overall market outlook remains positive, fueled by the continued growth of the battery industry and the imperative for safe and compliant transportation.
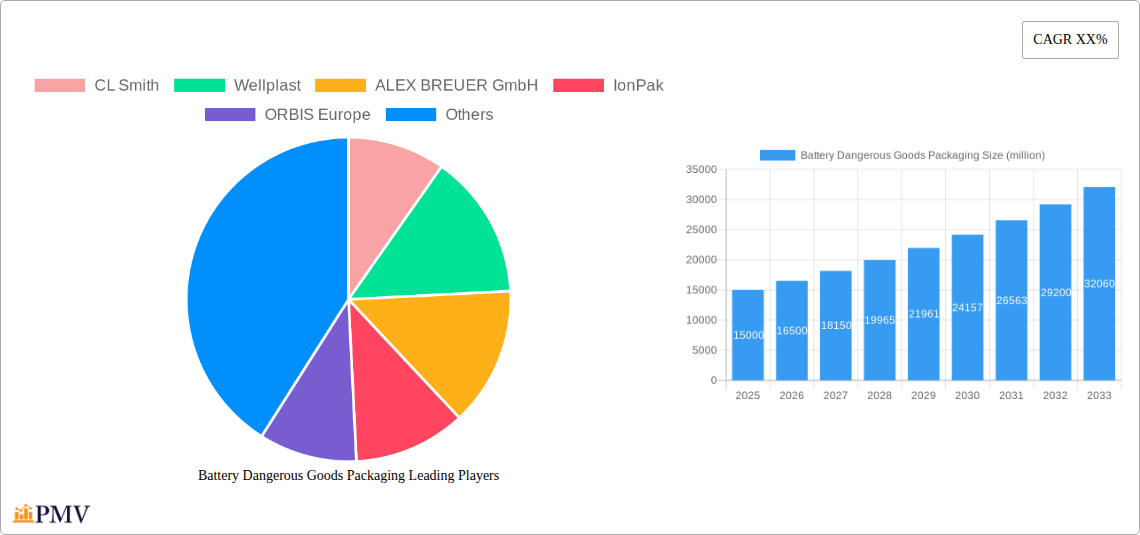
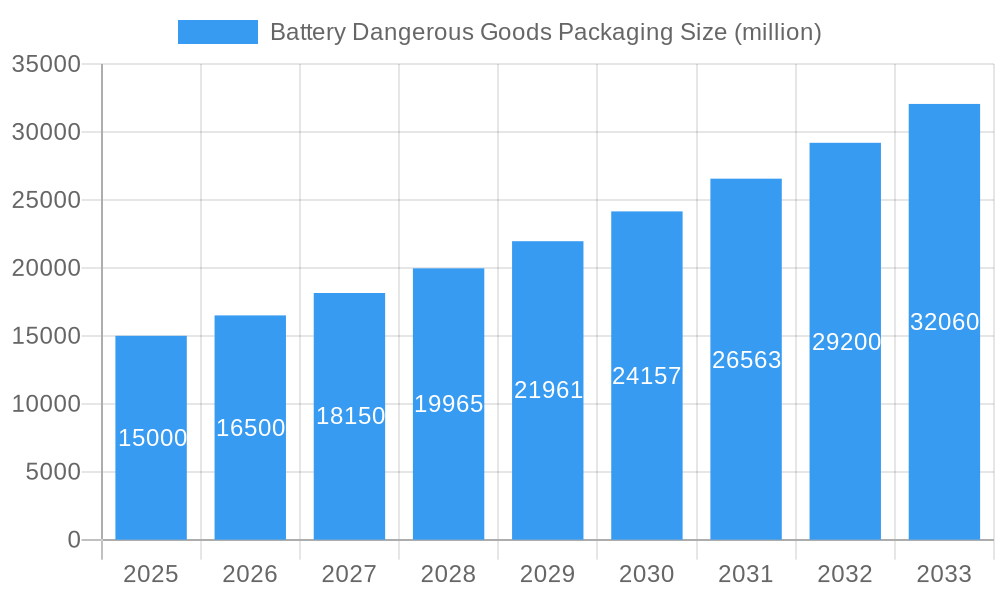
Battery Dangerous Goods Packaging Market Size (In Billion)
Growth is projected to be steady through 2033, driven by the increasing adoption of electric vehicles globally and the expansion of renewable energy infrastructure. Key players are focusing on developing sustainable packaging solutions, aligning with the growing emphasis on environmental responsibility within the logistics sector. This includes the use of recycled materials and the development of lightweight, yet highly protective packaging. Regional variations in market growth will be influenced by factors such as the pace of electric vehicle adoption, regulatory frameworks, and economic conditions. North America and Europe are currently leading the market, but Asia-Pacific is expected to experience significant growth in the coming years due to the rapid expansion of the electronics and renewable energy sectors in the region. The focus on improving supply chain efficiency and reducing transportation costs will further drive demand for optimized battery packaging solutions.
Battery Dangerous Goods Packaging Company Market Share
Battery Dangerous Goods Packaging Market Report: 2019-2033
This comprehensive report provides a detailed analysis of the global Battery Dangerous Goods Packaging market, offering invaluable insights for industry stakeholders, investors, and researchers. The study covers the period from 2019 to 2033, with a focus on the forecast period of 2025-2033, using 2025 as the base year and estimated year. The report's value exceeds $xx million, covering critical aspects of market structure, competitive dynamics, industry trends, and future growth potential. This in-depth analysis leverages extensive data and research, providing actionable intelligence for strategic decision-making.
Battery Dangerous Goods Packaging Market Structure & Competitive Dynamics
The global Battery Dangerous Goods Packaging market exhibits a moderately consolidated structure, with several key players holding significant market share. In 2025, the top five companies—CL Smith, Wellplast, ALEX BREUER GmbH, IonPak, and ORBIS Europe—are estimated to collectively account for approximately xx% of the market. This concentration is influenced by factors such as high entry barriers related to specialized manufacturing and stringent regulatory compliance. The market’s innovation ecosystem is dynamic, with ongoing developments in materials science, packaging design, and automation technologies. Regulatory frameworks, particularly those concerning UN standards for dangerous goods transportation, heavily influence packaging specifications and adoption rates. While limited, product substitutes exist, such as alternative packaging materials or transportation methods, but these often come with compromises in safety or cost-effectiveness. End-user trends towards lightweighting, improved sustainability, and enhanced security significantly impact product development.
- Market Concentration: Top 5 players control approximately xx% of the market in 2025.
- M&A Activity: Over the historical period (2019-2024), there were approximately xx M&A deals, with a total estimated value of $xx million. Most deals focused on expanding geographic reach and enhancing product portfolios.
- Regulatory Framework: UN recommendations and national regulations drive stringent safety and compliance requirements.
Battery Dangerous Goods Packaging Industry Trends & Insights
The Battery Dangerous Goods Packaging market is experiencing robust growth, driven by several key factors. The increasing demand for electric vehicles (EVs) and energy storage systems (ESS) is a primary driver, directly impacting the need for safe and compliant packaging solutions for lithium-ion batteries. Technological advancements in materials science, leading to lighter, stronger, and more environmentally friendly packaging materials, contribute to market expansion. Consumer preferences for sustainable and eco-friendly options are also playing a role, with manufacturers increasingly focusing on recyclable and biodegradable packaging.
The market's Compound Annual Growth Rate (CAGR) is projected to be approximately xx% during the forecast period (2025-2033). This growth is further amplified by the rising adoption of renewable energy sources and the increasing demand for portable electronic devices. Market penetration of advanced packaging technologies, such as specialized inserts and integrated monitoring systems, is steadily rising, reflecting the industry's focus on enhanced safety and traceability. The competitive landscape is characterized by intense competition, driven by innovation, cost optimization, and customer service.
Dominant Markets & Segments in Battery Dangerous Goods Packaging
The Asia-Pacific region is projected to be the dominant market for Battery Dangerous Goods Packaging during the forecast period. This dominance is fueled by rapid growth in the EV and ESS sectors within countries like China, Japan, South Korea, and India. The significant investments in these sectors, coupled with supportive government policies and robust infrastructure, contribute significantly to high packaging demand.
- Key Drivers in Asia-Pacific:
- Rapid growth in EV and ESS manufacturing.
- Government incentives promoting renewable energy adoption.
- Expanding logistics and transportation infrastructure.
- Increasing disposable income and consumer electronics demand.
Europe and North America also represent substantial markets, driven by stringent regulations, environmental consciousness, and increasing adoption of electric mobility solutions.
Battery Dangerous Goods Packaging Product Innovations
Recent product innovations include the development of lightweight yet robust packaging using advanced materials like high-strength plastics and composite materials. These innovations directly address the need for efficient transportation and reduced carbon footprint. Integrated monitoring systems, including temperature sensors and GPS trackers, enhance safety and traceability throughout the supply chain. The incorporation of absorbent materials and specialized cushioning solutions further protects batteries during transit, minimizing the risk of damage or leakage. These advancements enhance the safety and reliability of battery transportation, significantly improving market fit and competitive advantage.
Report Segmentation & Scope
The report segments the Battery Dangerous Goods Packaging market based on several key parameters:
Packaging Material: This segment analyzes the market share and growth potential of various materials, including plastics, corrugated cardboard, and specialized composites. Each material segment offers unique properties, affecting its suitability for specific battery types and transport conditions.
Battery Type: This segment categorizes the packaging based on the type of battery, such as lithium-ion, lead-acid, and nickel-cadmium, with each battery type having unique packaging requirements dictated by its properties and safety regulations.
End-use Industry: This segment analyzes market size and growth across various industries using battery dangerous goods packaging including automotive, electronics, energy storage, and industrial applications.
Geographic Region: This segment provides detailed insights into market performance and growth projections across key regions globally, including North America, Europe, Asia-Pacific, and the rest of the world.
Key Drivers of Battery Dangerous Goods Packaging Growth
The growth of the Battery Dangerous Goods Packaging market is propelled by several factors: The surging demand for electric vehicles and renewable energy storage solutions is a primary driver. Stringent regulations governing the transportation of dangerous goods necessitate safe and compliant packaging, thus creating substantial demand. Technological advancements in materials science, leading to lighter, stronger, and more sustainable packaging options, further accelerate market growth. Furthermore, the growing awareness of environmental concerns and the increasing adoption of sustainable packaging practices contribute significantly to the market's expansion.
Challenges in the Battery Dangerous Goods Packaging Sector
The Battery Dangerous Goods Packaging sector faces several challenges. Stringent regulatory compliance, especially related to UN standards and changing environmental regulations, poses a significant hurdle for manufacturers. Supply chain disruptions and fluctuations in raw material prices impact production costs and profitability. Intense competition among established players and new entrants necessitates continuous innovation and cost optimization. These factors collectively influence pricing strategies and overall market dynamics. Furthermore, maintaining a balance between cost-effectiveness and the need for superior safety and environmental consciousness poses ongoing challenges.
Leading Players in the Battery Dangerous Goods Packaging Market
- CL Smith
- Wellplast
- ALEX BREUER GmbH
- IonPak
- ORBIS Europe
- Nefab AB
- Hermann Christian Knüppel
- United Parcel Service (UPS)
- Fedex
- DS Smith
- Manika Moulds
- DHL
- Heitkamp & Thumann Group
- Zarges
- Obexion Max
- Air Sea Containers
- Excell Battery Company
Key Developments in Battery Dangerous Goods Packaging Sector
- January 2023: Introduction of a new, recyclable polypropylene packaging solution by Wellplast.
- June 2022: CL Smith announced a strategic partnership with a leading material supplier to secure supply chain stability.
- October 2021: ALEX BREUER GmbH launched a new line of lightweight, high-strength battery packaging.
- Further developments (xx): [Add xx further developments with dates and brief descriptions of their impact on market dynamics]
Strategic Battery Dangerous Goods Packaging Market Outlook
The Battery Dangerous Goods Packaging market is poised for continued expansion, fueled by the accelerating adoption of EVs, energy storage solutions, and the increasing demand for portable electronic devices. Strategic opportunities exist for companies focusing on innovation in sustainable materials, enhanced safety features, and efficient supply chain management. The market's growth trajectory is inextricably linked to technological advancements, government regulations, and consumer preferences for sustainable solutions. Companies that proactively adapt to these evolving dynamics are well-positioned to capitalize on the market's considerable growth potential.
Battery Dangerous Goods Packaging Segmentation
-
1. Application
- 1.1. Lithium Ion Battery
- 1.2. Lead-acid Battery
- 1.3. Nickel-cadmium Battery
- 1.4. NiMH Battery
- 1.5. Others
-
2. Types
- 2.1. Cardboard
- 2.2. Foam
- 2.3. Plastic
- 2.4. Wood
- 2.5. Othes
Battery Dangerous Goods Packaging Segmentation By Geography
-
1. North America
- 1.1. United States
- 1.2. Canada
- 1.3. Mexico
-
2. South America
- 2.1. Brazil
- 2.2. Argentina
- 2.3. Rest of South America
-
3. Europe
- 3.1. United Kingdom
- 3.2. Germany
- 3.3. France
- 3.4. Italy
- 3.5. Spain
- 3.6. Russia
- 3.7. Benelux
- 3.8. Nordics
- 3.9. Rest of Europe
-
4. Middle East & Africa
- 4.1. Turkey
- 4.2. Israel
- 4.3. GCC
- 4.4. North Africa
- 4.5. South Africa
- 4.6. Rest of Middle East & Africa
-
5. Asia Pacific
- 5.1. China
- 5.2. India
- 5.3. Japan
- 5.4. South Korea
- 5.5. ASEAN
- 5.6. Oceania
- 5.7. Rest of Asia Pacific

Battery Dangerous Goods Packaging Regional Market Share
Geographic Coverage of Battery Dangerous Goods Packaging
Battery Dangerous Goods Packaging REPORT HIGHLIGHTS
| Aspects | Details |
|---|---|
| Study Period | 2020-2034 |
| Base Year | 2025 |
| Estimated Year | 2026 |
| Forecast Period | 2026-2034 |
| Historical Period | 2020-2025 |
| Growth Rate | CAGR of 12.15% from 2020-2034 |
| Segmentation |
|
Table of Contents
- 1. Introduction
- 1.1. Research Scope
- 1.2. Market Segmentation
- 1.3. Research Methodology
- 1.4. Definitions and Assumptions
- 2. Executive Summary
- 2.1. Introduction
- 3. Market Dynamics
- 3.1. Introduction
- 3.2. Market Drivers
- 3.3. Market Restrains
- 3.4. Market Trends
- 4. Market Factor Analysis
- 4.1. Porters Five Forces
- 4.2. Supply/Value Chain
- 4.3. PESTEL analysis
- 4.4. Market Entropy
- 4.5. Patent/Trademark Analysis
- 5. Global Battery Dangerous Goods Packaging Analysis, Insights and Forecast, 2020-2032
- 5.1. Market Analysis, Insights and Forecast - by Application
- 5.1.1. Lithium Ion Battery
- 5.1.2. Lead-acid Battery
- 5.1.3. Nickel-cadmium Battery
- 5.1.4. NiMH Battery
- 5.1.5. Others
- 5.2. Market Analysis, Insights and Forecast - by Types
- 5.2.1. Cardboard
- 5.2.2. Foam
- 5.2.3. Plastic
- 5.2.4. Wood
- 5.2.5. Othes
- 5.3. Market Analysis, Insights and Forecast - by Region
- 5.3.1. North America
- 5.3.2. South America
- 5.3.3. Europe
- 5.3.4. Middle East & Africa
- 5.3.5. Asia Pacific
- 5.1. Market Analysis, Insights and Forecast - by Application
- 6. North America Battery Dangerous Goods Packaging Analysis, Insights and Forecast, 2020-2032
- 6.1. Market Analysis, Insights and Forecast - by Application
- 6.1.1. Lithium Ion Battery
- 6.1.2. Lead-acid Battery
- 6.1.3. Nickel-cadmium Battery
- 6.1.4. NiMH Battery
- 6.1.5. Others
- 6.2. Market Analysis, Insights and Forecast - by Types
- 6.2.1. Cardboard
- 6.2.2. Foam
- 6.2.3. Plastic
- 6.2.4. Wood
- 6.2.5. Othes
- 6.1. Market Analysis, Insights and Forecast - by Application
- 7. South America Battery Dangerous Goods Packaging Analysis, Insights and Forecast, 2020-2032
- 7.1. Market Analysis, Insights and Forecast - by Application
- 7.1.1. Lithium Ion Battery
- 7.1.2. Lead-acid Battery
- 7.1.3. Nickel-cadmium Battery
- 7.1.4. NiMH Battery
- 7.1.5. Others
- 7.2. Market Analysis, Insights and Forecast - by Types
- 7.2.1. Cardboard
- 7.2.2. Foam
- 7.2.3. Plastic
- 7.2.4. Wood
- 7.2.5. Othes
- 7.1. Market Analysis, Insights and Forecast - by Application
- 8. Europe Battery Dangerous Goods Packaging Analysis, Insights and Forecast, 2020-2032
- 8.1. Market Analysis, Insights and Forecast - by Application
- 8.1.1. Lithium Ion Battery
- 8.1.2. Lead-acid Battery
- 8.1.3. Nickel-cadmium Battery
- 8.1.4. NiMH Battery
- 8.1.5. Others
- 8.2. Market Analysis, Insights and Forecast - by Types
- 8.2.1. Cardboard
- 8.2.2. Foam
- 8.2.3. Plastic
- 8.2.4. Wood
- 8.2.5. Othes
- 8.1. Market Analysis, Insights and Forecast - by Application
- 9. Middle East & Africa Battery Dangerous Goods Packaging Analysis, Insights and Forecast, 2020-2032
- 9.1. Market Analysis, Insights and Forecast - by Application
- 9.1.1. Lithium Ion Battery
- 9.1.2. Lead-acid Battery
- 9.1.3. Nickel-cadmium Battery
- 9.1.4. NiMH Battery
- 9.1.5. Others
- 9.2. Market Analysis, Insights and Forecast - by Types
- 9.2.1. Cardboard
- 9.2.2. Foam
- 9.2.3. Plastic
- 9.2.4. Wood
- 9.2.5. Othes
- 9.1. Market Analysis, Insights and Forecast - by Application
- 10. Asia Pacific Battery Dangerous Goods Packaging Analysis, Insights and Forecast, 2020-2032
- 10.1. Market Analysis, Insights and Forecast - by Application
- 10.1.1. Lithium Ion Battery
- 10.1.2. Lead-acid Battery
- 10.1.3. Nickel-cadmium Battery
- 10.1.4. NiMH Battery
- 10.1.5. Others
- 10.2. Market Analysis, Insights and Forecast - by Types
- 10.2.1. Cardboard
- 10.2.2. Foam
- 10.2.3. Plastic
- 10.2.4. Wood
- 10.2.5. Othes
- 10.1. Market Analysis, Insights and Forecast - by Application
- 11. Competitive Analysis
- 11.1. Global Market Share Analysis 2025
- 11.2. Company Profiles
- 11.2.1 CL Smith
- 11.2.1.1. Overview
- 11.2.1.2. Products
- 11.2.1.3. SWOT Analysis
- 11.2.1.4. Recent Developments
- 11.2.1.5. Financials (Based on Availability)
- 11.2.2 Wellplast
- 11.2.2.1. Overview
- 11.2.2.2. Products
- 11.2.2.3. SWOT Analysis
- 11.2.2.4. Recent Developments
- 11.2.2.5. Financials (Based on Availability)
- 11.2.3 ALEX BREUER GmbH
- 11.2.3.1. Overview
- 11.2.3.2. Products
- 11.2.3.3. SWOT Analysis
- 11.2.3.4. Recent Developments
- 11.2.3.5. Financials (Based on Availability)
- 11.2.4 IonPak
- 11.2.4.1. Overview
- 11.2.4.2. Products
- 11.2.4.3. SWOT Analysis
- 11.2.4.4. Recent Developments
- 11.2.4.5. Financials (Based on Availability)
- 11.2.5 ORBIS Europe
- 11.2.5.1. Overview
- 11.2.5.2. Products
- 11.2.5.3. SWOT Analysis
- 11.2.5.4. Recent Developments
- 11.2.5.5. Financials (Based on Availability)
- 11.2.6 Nefab AB
- 11.2.6.1. Overview
- 11.2.6.2. Products
- 11.2.6.3. SWOT Analysis
- 11.2.6.4. Recent Developments
- 11.2.6.5. Financials (Based on Availability)
- 11.2.7 Hermann Christian Knüppel
- 11.2.7.1. Overview
- 11.2.7.2. Products
- 11.2.7.3. SWOT Analysis
- 11.2.7.4. Recent Developments
- 11.2.7.5. Financials (Based on Availability)
- 11.2.8 United Parcel Service (UPS)
- 11.2.8.1. Overview
- 11.2.8.2. Products
- 11.2.8.3. SWOT Analysis
- 11.2.8.4. Recent Developments
- 11.2.8.5. Financials (Based on Availability)
- 11.2.9 Fedex
- 11.2.9.1. Overview
- 11.2.9.2. Products
- 11.2.9.3. SWOT Analysis
- 11.2.9.4. Recent Developments
- 11.2.9.5. Financials (Based on Availability)
- 11.2.10 DS Smith
- 11.2.10.1. Overview
- 11.2.10.2. Products
- 11.2.10.3. SWOT Analysis
- 11.2.10.4. Recent Developments
- 11.2.10.5. Financials (Based on Availability)
- 11.2.11 Manika Moulds
- 11.2.11.1. Overview
- 11.2.11.2. Products
- 11.2.11.3. SWOT Analysis
- 11.2.11.4. Recent Developments
- 11.2.11.5. Financials (Based on Availability)
- 11.2.12 DHL
- 11.2.12.1. Overview
- 11.2.12.2. Products
- 11.2.12.3. SWOT Analysis
- 11.2.12.4. Recent Developments
- 11.2.12.5. Financials (Based on Availability)
- 11.2.13 Heitkamp & Thumann Group
- 11.2.13.1. Overview
- 11.2.13.2. Products
- 11.2.13.3. SWOT Analysis
- 11.2.13.4. Recent Developments
- 11.2.13.5. Financials (Based on Availability)
- 11.2.14 Zarges
- 11.2.14.1. Overview
- 11.2.14.2. Products
- 11.2.14.3. SWOT Analysis
- 11.2.14.4. Recent Developments
- 11.2.14.5. Financials (Based on Availability)
- 11.2.15 Obexion Max
- 11.2.15.1. Overview
- 11.2.15.2. Products
- 11.2.15.3. SWOT Analysis
- 11.2.15.4. Recent Developments
- 11.2.15.5. Financials (Based on Availability)
- 11.2.16 Air Sea Containers
- 11.2.16.1. Overview
- 11.2.16.2. Products
- 11.2.16.3. SWOT Analysis
- 11.2.16.4. Recent Developments
- 11.2.16.5. Financials (Based on Availability)
- 11.2.17 Excell Battery Company
- 11.2.17.1. Overview
- 11.2.17.2. Products
- 11.2.17.3. SWOT Analysis
- 11.2.17.4. Recent Developments
- 11.2.17.5. Financials (Based on Availability)
- 11.2.1 CL Smith
List of Figures
- Figure 1: Global Battery Dangerous Goods Packaging Revenue Breakdown (undefined, %) by Region 2025 & 2033
- Figure 2: Global Battery Dangerous Goods Packaging Volume Breakdown (K, %) by Region 2025 & 2033
- Figure 3: North America Battery Dangerous Goods Packaging Revenue (undefined), by Application 2025 & 2033
- Figure 4: North America Battery Dangerous Goods Packaging Volume (K), by Application 2025 & 2033
- Figure 5: North America Battery Dangerous Goods Packaging Revenue Share (%), by Application 2025 & 2033
- Figure 6: North America Battery Dangerous Goods Packaging Volume Share (%), by Application 2025 & 2033
- Figure 7: North America Battery Dangerous Goods Packaging Revenue (undefined), by Types 2025 & 2033
- Figure 8: North America Battery Dangerous Goods Packaging Volume (K), by Types 2025 & 2033
- Figure 9: North America Battery Dangerous Goods Packaging Revenue Share (%), by Types 2025 & 2033
- Figure 10: North America Battery Dangerous Goods Packaging Volume Share (%), by Types 2025 & 2033
- Figure 11: North America Battery Dangerous Goods Packaging Revenue (undefined), by Country 2025 & 2033
- Figure 12: North America Battery Dangerous Goods Packaging Volume (K), by Country 2025 & 2033
- Figure 13: North America Battery Dangerous Goods Packaging Revenue Share (%), by Country 2025 & 2033
- Figure 14: North America Battery Dangerous Goods Packaging Volume Share (%), by Country 2025 & 2033
- Figure 15: South America Battery Dangerous Goods Packaging Revenue (undefined), by Application 2025 & 2033
- Figure 16: South America Battery Dangerous Goods Packaging Volume (K), by Application 2025 & 2033
- Figure 17: South America Battery Dangerous Goods Packaging Revenue Share (%), by Application 2025 & 2033
- Figure 18: South America Battery Dangerous Goods Packaging Volume Share (%), by Application 2025 & 2033
- Figure 19: South America Battery Dangerous Goods Packaging Revenue (undefined), by Types 2025 & 2033
- Figure 20: South America Battery Dangerous Goods Packaging Volume (K), by Types 2025 & 2033
- Figure 21: South America Battery Dangerous Goods Packaging Revenue Share (%), by Types 2025 & 2033
- Figure 22: South America Battery Dangerous Goods Packaging Volume Share (%), by Types 2025 & 2033
- Figure 23: South America Battery Dangerous Goods Packaging Revenue (undefined), by Country 2025 & 2033
- Figure 24: South America Battery Dangerous Goods Packaging Volume (K), by Country 2025 & 2033
- Figure 25: South America Battery Dangerous Goods Packaging Revenue Share (%), by Country 2025 & 2033
- Figure 26: South America Battery Dangerous Goods Packaging Volume Share (%), by Country 2025 & 2033
- Figure 27: Europe Battery Dangerous Goods Packaging Revenue (undefined), by Application 2025 & 2033
- Figure 28: Europe Battery Dangerous Goods Packaging Volume (K), by Application 2025 & 2033
- Figure 29: Europe Battery Dangerous Goods Packaging Revenue Share (%), by Application 2025 & 2033
- Figure 30: Europe Battery Dangerous Goods Packaging Volume Share (%), by Application 2025 & 2033
- Figure 31: Europe Battery Dangerous Goods Packaging Revenue (undefined), by Types 2025 & 2033
- Figure 32: Europe Battery Dangerous Goods Packaging Volume (K), by Types 2025 & 2033
- Figure 33: Europe Battery Dangerous Goods Packaging Revenue Share (%), by Types 2025 & 2033
- Figure 34: Europe Battery Dangerous Goods Packaging Volume Share (%), by Types 2025 & 2033
- Figure 35: Europe Battery Dangerous Goods Packaging Revenue (undefined), by Country 2025 & 2033
- Figure 36: Europe Battery Dangerous Goods Packaging Volume (K), by Country 2025 & 2033
- Figure 37: Europe Battery Dangerous Goods Packaging Revenue Share (%), by Country 2025 & 2033
- Figure 38: Europe Battery Dangerous Goods Packaging Volume Share (%), by Country 2025 & 2033
- Figure 39: Middle East & Africa Battery Dangerous Goods Packaging Revenue (undefined), by Application 2025 & 2033
- Figure 40: Middle East & Africa Battery Dangerous Goods Packaging Volume (K), by Application 2025 & 2033
- Figure 41: Middle East & Africa Battery Dangerous Goods Packaging Revenue Share (%), by Application 2025 & 2033
- Figure 42: Middle East & Africa Battery Dangerous Goods Packaging Volume Share (%), by Application 2025 & 2033
- Figure 43: Middle East & Africa Battery Dangerous Goods Packaging Revenue (undefined), by Types 2025 & 2033
- Figure 44: Middle East & Africa Battery Dangerous Goods Packaging Volume (K), by Types 2025 & 2033
- Figure 45: Middle East & Africa Battery Dangerous Goods Packaging Revenue Share (%), by Types 2025 & 2033
- Figure 46: Middle East & Africa Battery Dangerous Goods Packaging Volume Share (%), by Types 2025 & 2033
- Figure 47: Middle East & Africa Battery Dangerous Goods Packaging Revenue (undefined), by Country 2025 & 2033
- Figure 48: Middle East & Africa Battery Dangerous Goods Packaging Volume (K), by Country 2025 & 2033
- Figure 49: Middle East & Africa Battery Dangerous Goods Packaging Revenue Share (%), by Country 2025 & 2033
- Figure 50: Middle East & Africa Battery Dangerous Goods Packaging Volume Share (%), by Country 2025 & 2033
- Figure 51: Asia Pacific Battery Dangerous Goods Packaging Revenue (undefined), by Application 2025 & 2033
- Figure 52: Asia Pacific Battery Dangerous Goods Packaging Volume (K), by Application 2025 & 2033
- Figure 53: Asia Pacific Battery Dangerous Goods Packaging Revenue Share (%), by Application 2025 & 2033
- Figure 54: Asia Pacific Battery Dangerous Goods Packaging Volume Share (%), by Application 2025 & 2033
- Figure 55: Asia Pacific Battery Dangerous Goods Packaging Revenue (undefined), by Types 2025 & 2033
- Figure 56: Asia Pacific Battery Dangerous Goods Packaging Volume (K), by Types 2025 & 2033
- Figure 57: Asia Pacific Battery Dangerous Goods Packaging Revenue Share (%), by Types 2025 & 2033
- Figure 58: Asia Pacific Battery Dangerous Goods Packaging Volume Share (%), by Types 2025 & 2033
- Figure 59: Asia Pacific Battery Dangerous Goods Packaging Revenue (undefined), by Country 2025 & 2033
- Figure 60: Asia Pacific Battery Dangerous Goods Packaging Volume (K), by Country 2025 & 2033
- Figure 61: Asia Pacific Battery Dangerous Goods Packaging Revenue Share (%), by Country 2025 & 2033
- Figure 62: Asia Pacific Battery Dangerous Goods Packaging Volume Share (%), by Country 2025 & 2033
List of Tables
- Table 1: Global Battery Dangerous Goods Packaging Revenue undefined Forecast, by Application 2020 & 2033
- Table 2: Global Battery Dangerous Goods Packaging Volume K Forecast, by Application 2020 & 2033
- Table 3: Global Battery Dangerous Goods Packaging Revenue undefined Forecast, by Types 2020 & 2033
- Table 4: Global Battery Dangerous Goods Packaging Volume K Forecast, by Types 2020 & 2033
- Table 5: Global Battery Dangerous Goods Packaging Revenue undefined Forecast, by Region 2020 & 2033
- Table 6: Global Battery Dangerous Goods Packaging Volume K Forecast, by Region 2020 & 2033
- Table 7: Global Battery Dangerous Goods Packaging Revenue undefined Forecast, by Application 2020 & 2033
- Table 8: Global Battery Dangerous Goods Packaging Volume K Forecast, by Application 2020 & 2033
- Table 9: Global Battery Dangerous Goods Packaging Revenue undefined Forecast, by Types 2020 & 2033
- Table 10: Global Battery Dangerous Goods Packaging Volume K Forecast, by Types 2020 & 2033
- Table 11: Global Battery Dangerous Goods Packaging Revenue undefined Forecast, by Country 2020 & 2033
- Table 12: Global Battery Dangerous Goods Packaging Volume K Forecast, by Country 2020 & 2033
- Table 13: United States Battery Dangerous Goods Packaging Revenue (undefined) Forecast, by Application 2020 & 2033
- Table 14: United States Battery Dangerous Goods Packaging Volume (K) Forecast, by Application 2020 & 2033
- Table 15: Canada Battery Dangerous Goods Packaging Revenue (undefined) Forecast, by Application 2020 & 2033
- Table 16: Canada Battery Dangerous Goods Packaging Volume (K) Forecast, by Application 2020 & 2033
- Table 17: Mexico Battery Dangerous Goods Packaging Revenue (undefined) Forecast, by Application 2020 & 2033
- Table 18: Mexico Battery Dangerous Goods Packaging Volume (K) Forecast, by Application 2020 & 2033
- Table 19: Global Battery Dangerous Goods Packaging Revenue undefined Forecast, by Application 2020 & 2033
- Table 20: Global Battery Dangerous Goods Packaging Volume K Forecast, by Application 2020 & 2033
- Table 21: Global Battery Dangerous Goods Packaging Revenue undefined Forecast, by Types 2020 & 2033
- Table 22: Global Battery Dangerous Goods Packaging Volume K Forecast, by Types 2020 & 2033
- Table 23: Global Battery Dangerous Goods Packaging Revenue undefined Forecast, by Country 2020 & 2033
- Table 24: Global Battery Dangerous Goods Packaging Volume K Forecast, by Country 2020 & 2033
- Table 25: Brazil Battery Dangerous Goods Packaging Revenue (undefined) Forecast, by Application 2020 & 2033
- Table 26: Brazil Battery Dangerous Goods Packaging Volume (K) Forecast, by Application 2020 & 2033
- Table 27: Argentina Battery Dangerous Goods Packaging Revenue (undefined) Forecast, by Application 2020 & 2033
- Table 28: Argentina Battery Dangerous Goods Packaging Volume (K) Forecast, by Application 2020 & 2033
- Table 29: Rest of South America Battery Dangerous Goods Packaging Revenue (undefined) Forecast, by Application 2020 & 2033
- Table 30: Rest of South America Battery Dangerous Goods Packaging Volume (K) Forecast, by Application 2020 & 2033
- Table 31: Global Battery Dangerous Goods Packaging Revenue undefined Forecast, by Application 2020 & 2033
- Table 32: Global Battery Dangerous Goods Packaging Volume K Forecast, by Application 2020 & 2033
- Table 33: Global Battery Dangerous Goods Packaging Revenue undefined Forecast, by Types 2020 & 2033
- Table 34: Global Battery Dangerous Goods Packaging Volume K Forecast, by Types 2020 & 2033
- Table 35: Global Battery Dangerous Goods Packaging Revenue undefined Forecast, by Country 2020 & 2033
- Table 36: Global Battery Dangerous Goods Packaging Volume K Forecast, by Country 2020 & 2033
- Table 37: United Kingdom Battery Dangerous Goods Packaging Revenue (undefined) Forecast, by Application 2020 & 2033
- Table 38: United Kingdom Battery Dangerous Goods Packaging Volume (K) Forecast, by Application 2020 & 2033
- Table 39: Germany Battery Dangerous Goods Packaging Revenue (undefined) Forecast, by Application 2020 & 2033
- Table 40: Germany Battery Dangerous Goods Packaging Volume (K) Forecast, by Application 2020 & 2033
- Table 41: France Battery Dangerous Goods Packaging Revenue (undefined) Forecast, by Application 2020 & 2033
- Table 42: France Battery Dangerous Goods Packaging Volume (K) Forecast, by Application 2020 & 2033
- Table 43: Italy Battery Dangerous Goods Packaging Revenue (undefined) Forecast, by Application 2020 & 2033
- Table 44: Italy Battery Dangerous Goods Packaging Volume (K) Forecast, by Application 2020 & 2033
- Table 45: Spain Battery Dangerous Goods Packaging Revenue (undefined) Forecast, by Application 2020 & 2033
- Table 46: Spain Battery Dangerous Goods Packaging Volume (K) Forecast, by Application 2020 & 2033
- Table 47: Russia Battery Dangerous Goods Packaging Revenue (undefined) Forecast, by Application 2020 & 2033
- Table 48: Russia Battery Dangerous Goods Packaging Volume (K) Forecast, by Application 2020 & 2033
- Table 49: Benelux Battery Dangerous Goods Packaging Revenue (undefined) Forecast, by Application 2020 & 2033
- Table 50: Benelux Battery Dangerous Goods Packaging Volume (K) Forecast, by Application 2020 & 2033
- Table 51: Nordics Battery Dangerous Goods Packaging Revenue (undefined) Forecast, by Application 2020 & 2033
- Table 52: Nordics Battery Dangerous Goods Packaging Volume (K) Forecast, by Application 2020 & 2033
- Table 53: Rest of Europe Battery Dangerous Goods Packaging Revenue (undefined) Forecast, by Application 2020 & 2033
- Table 54: Rest of Europe Battery Dangerous Goods Packaging Volume (K) Forecast, by Application 2020 & 2033
- Table 55: Global Battery Dangerous Goods Packaging Revenue undefined Forecast, by Application 2020 & 2033
- Table 56: Global Battery Dangerous Goods Packaging Volume K Forecast, by Application 2020 & 2033
- Table 57: Global Battery Dangerous Goods Packaging Revenue undefined Forecast, by Types 2020 & 2033
- Table 58: Global Battery Dangerous Goods Packaging Volume K Forecast, by Types 2020 & 2033
- Table 59: Global Battery Dangerous Goods Packaging Revenue undefined Forecast, by Country 2020 & 2033
- Table 60: Global Battery Dangerous Goods Packaging Volume K Forecast, by Country 2020 & 2033
- Table 61: Turkey Battery Dangerous Goods Packaging Revenue (undefined) Forecast, by Application 2020 & 2033
- Table 62: Turkey Battery Dangerous Goods Packaging Volume (K) Forecast, by Application 2020 & 2033
- Table 63: Israel Battery Dangerous Goods Packaging Revenue (undefined) Forecast, by Application 2020 & 2033
- Table 64: Israel Battery Dangerous Goods Packaging Volume (K) Forecast, by Application 2020 & 2033
- Table 65: GCC Battery Dangerous Goods Packaging Revenue (undefined) Forecast, by Application 2020 & 2033
- Table 66: GCC Battery Dangerous Goods Packaging Volume (K) Forecast, by Application 2020 & 2033
- Table 67: North Africa Battery Dangerous Goods Packaging Revenue (undefined) Forecast, by Application 2020 & 2033
- Table 68: North Africa Battery Dangerous Goods Packaging Volume (K) Forecast, by Application 2020 & 2033
- Table 69: South Africa Battery Dangerous Goods Packaging Revenue (undefined) Forecast, by Application 2020 & 2033
- Table 70: South Africa Battery Dangerous Goods Packaging Volume (K) Forecast, by Application 2020 & 2033
- Table 71: Rest of Middle East & Africa Battery Dangerous Goods Packaging Revenue (undefined) Forecast, by Application 2020 & 2033
- Table 72: Rest of Middle East & Africa Battery Dangerous Goods Packaging Volume (K) Forecast, by Application 2020 & 2033
- Table 73: Global Battery Dangerous Goods Packaging Revenue undefined Forecast, by Application 2020 & 2033
- Table 74: Global Battery Dangerous Goods Packaging Volume K Forecast, by Application 2020 & 2033
- Table 75: Global Battery Dangerous Goods Packaging Revenue undefined Forecast, by Types 2020 & 2033
- Table 76: Global Battery Dangerous Goods Packaging Volume K Forecast, by Types 2020 & 2033
- Table 77: Global Battery Dangerous Goods Packaging Revenue undefined Forecast, by Country 2020 & 2033
- Table 78: Global Battery Dangerous Goods Packaging Volume K Forecast, by Country 2020 & 2033
- Table 79: China Battery Dangerous Goods Packaging Revenue (undefined) Forecast, by Application 2020 & 2033
- Table 80: China Battery Dangerous Goods Packaging Volume (K) Forecast, by Application 2020 & 2033
- Table 81: India Battery Dangerous Goods Packaging Revenue (undefined) Forecast, by Application 2020 & 2033
- Table 82: India Battery Dangerous Goods Packaging Volume (K) Forecast, by Application 2020 & 2033
- Table 83: Japan Battery Dangerous Goods Packaging Revenue (undefined) Forecast, by Application 2020 & 2033
- Table 84: Japan Battery Dangerous Goods Packaging Volume (K) Forecast, by Application 2020 & 2033
- Table 85: South Korea Battery Dangerous Goods Packaging Revenue (undefined) Forecast, by Application 2020 & 2033
- Table 86: South Korea Battery Dangerous Goods Packaging Volume (K) Forecast, by Application 2020 & 2033
- Table 87: ASEAN Battery Dangerous Goods Packaging Revenue (undefined) Forecast, by Application 2020 & 2033
- Table 88: ASEAN Battery Dangerous Goods Packaging Volume (K) Forecast, by Application 2020 & 2033
- Table 89: Oceania Battery Dangerous Goods Packaging Revenue (undefined) Forecast, by Application 2020 & 2033
- Table 90: Oceania Battery Dangerous Goods Packaging Volume (K) Forecast, by Application 2020 & 2033
- Table 91: Rest of Asia Pacific Battery Dangerous Goods Packaging Revenue (undefined) Forecast, by Application 2020 & 2033
- Table 92: Rest of Asia Pacific Battery Dangerous Goods Packaging Volume (K) Forecast, by Application 2020 & 2033
Frequently Asked Questions
1. What is the projected Compound Annual Growth Rate (CAGR) of the Battery Dangerous Goods Packaging?
The projected CAGR is approximately 12.15%.
2. Which companies are prominent players in the Battery Dangerous Goods Packaging?
Key companies in the market include CL Smith, Wellplast, ALEX BREUER GmbH, IonPak, ORBIS Europe, Nefab AB, Hermann Christian Knüppel, United Parcel Service (UPS), Fedex, DS Smith, Manika Moulds, DHL, Heitkamp & Thumann Group, Zarges, Obexion Max, Air Sea Containers, Excell Battery Company.
3. What are the main segments of the Battery Dangerous Goods Packaging?
The market segments include Application, Types.
4. Can you provide details about the market size?
The market size is estimated to be USD XXX N/A as of 2022.
5. What are some drivers contributing to market growth?
N/A
6. What are the notable trends driving market growth?
N/A
7. Are there any restraints impacting market growth?
N/A
8. Can you provide examples of recent developments in the market?
N/A
9. What pricing options are available for accessing the report?
Pricing options include single-user, multi-user, and enterprise licenses priced at USD 3350.00, USD 5025.00, and USD 6700.00 respectively.
10. Is the market size provided in terms of value or volume?
The market size is provided in terms of value, measured in N/A and volume, measured in K.
11. Are there any specific market keywords associated with the report?
Yes, the market keyword associated with the report is "Battery Dangerous Goods Packaging," which aids in identifying and referencing the specific market segment covered.
12. How do I determine which pricing option suits my needs best?
The pricing options vary based on user requirements and access needs. Individual users may opt for single-user licenses, while businesses requiring broader access may choose multi-user or enterprise licenses for cost-effective access to the report.
13. Are there any additional resources or data provided in the Battery Dangerous Goods Packaging report?
While the report offers comprehensive insights, it's advisable to review the specific contents or supplementary materials provided to ascertain if additional resources or data are available.
14. How can I stay updated on further developments or reports in the Battery Dangerous Goods Packaging?
To stay informed about further developments, trends, and reports in the Battery Dangerous Goods Packaging, consider subscribing to industry newsletters, following relevant companies and organizations, or regularly checking reputable industry news sources and publications.
Methodology
Step 1 - Identification of Relevant Samples Size from Population Database


Step 2 - Approaches for Defining Global Market Size (Value, Volume* & Price*)

Note*: In applicable scenarios
Step 3 - Data Sources
Primary Research
- Web Analytics
- Survey Reports
- Research Institute
- Latest Research Reports
- Opinion Leaders
Secondary Research
- Annual Reports
- White Paper
- Latest Press Release
- Industry Association
- Paid Database
- Investor Presentations

Step 4 - Data Triangulation
Involves using different sources of information in order to increase the validity of a study
These sources are likely to be stakeholders in a program - participants, other researchers, program staff, other community members, and so on.
Then we put all data in single framework & apply various statistical tools to find out the dynamic on the market.
During the analysis stage, feedback from the stakeholder groups would be compared to determine areas of agreement as well as areas of divergence