

Key Insights
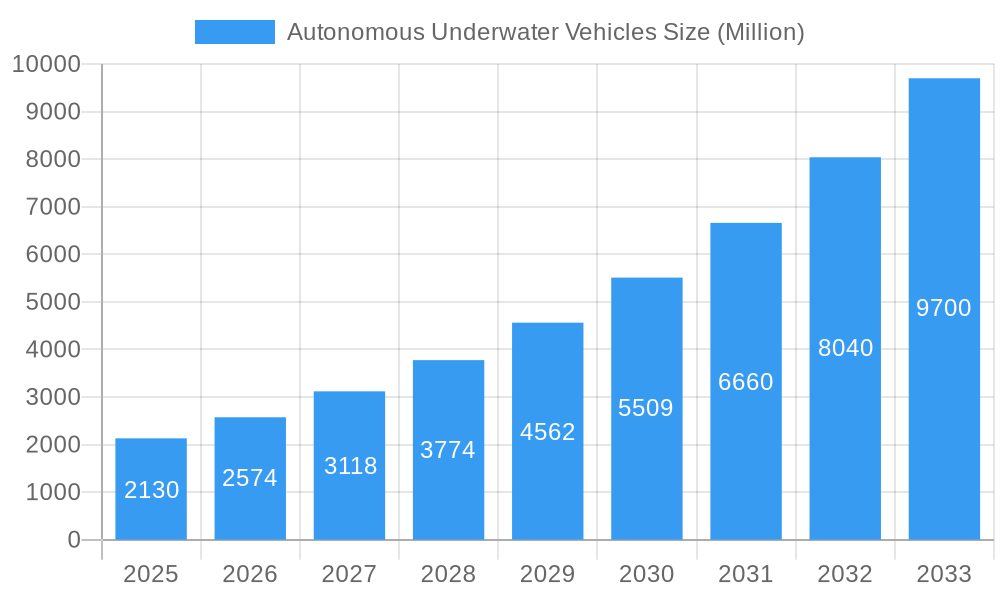
The Autonomous Underwater Vehicle (AUV) market is experiencing robust growth, projected to reach \$2.13 billion in 2025 and expand significantly over the forecast period (2025-2033). A Compound Annual Growth Rate (CAGR) of 20.62% signifies substantial market expansion driven by increasing demand across diverse sectors. Key application areas like military & defense (driven by advancements in underwater surveillance and mine countermeasures), oil & gas (for subsea inspection and maintenance), and environmental protection & monitoring (for data collection and pollution assessment) are primary growth catalysts. Technological advancements, including enhanced sensor capabilities, improved navigation systems, and longer operational endurance, further fuel market expansion. The market is segmented by size (small, medium, large) and application, reflecting diverse user needs and technological capabilities. North America and Europe currently hold significant market shares, but the Asia-Pacific region, fueled by infrastructure development and increased government spending, is poised for rapid growth. The competitive landscape includes major players like L3Harris Technologies, General Dynamics, and Lockheed Martin, indicating a high level of technological sophistication and substantial investment in R&D.
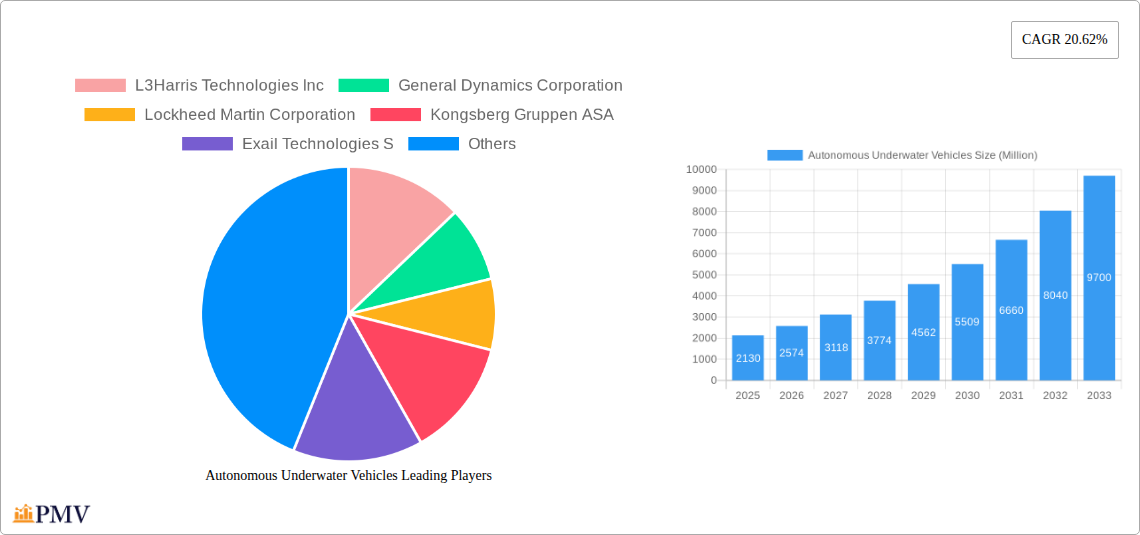
Autonomous Underwater Vehicles Market Size (In Billion)
Continued growth in the AUV market is anticipated due to the increasing need for data acquisition in challenging underwater environments. The rising adoption of AUVs for search and salvage operations, archaeology and exploration, and oceanographic research is expected to drive market expansion. However, high initial investment costs and the complexities associated with AUV operation and maintenance might present some challenges. Furthermore, regulatory compliance and the need for skilled operators are factors that could influence market dynamics. Despite these potential restraints, the long-term outlook remains positive, with ongoing technological innovations, increasing government investments in underwater exploration, and the expanding applications of AUVs across various sectors promising significant growth in the coming years.
Autonomous Underwater Vehicles Company Market Share
Autonomous Underwater Vehicles (AUV) Market Report: 2019-2033
This comprehensive report provides an in-depth analysis of the Autonomous Underwater Vehicles (AUV) market, projecting a significant expansion over the forecast period (2025-2033). The report covers the historical period (2019-2024), with 2025 serving as the base and estimated year. Valuations are expressed in Millions. The study encompasses various segments by application and vehicle type, examining market dynamics, competitive landscapes, and future growth prospects.
Autonomous Underwater Vehicles Market Structure & Competitive Dynamics
The AUV market exhibits a moderately concentrated structure, with key players holding substantial market shares. The market is characterized by intense competition, fueled by ongoing technological advancements and a rising demand across diverse applications. The top ten players, including L3Harris Technologies Inc, General Dynamics Corporation, Lockheed Martin Corporation, Kongsberg Gruppen ASA, Exail Technologies S, SAAB AB, BAE Systems plc, Teledyne Technologies Inc, and The Boeing Company, collectively account for approximately xx% of the global market share in 2025. Innovation ecosystems play a vital role, with significant investments in R&D driving the development of advanced AUV technologies. Regulatory frameworks vary across regions, influencing market access and operational compliance. Product substitutes, such as remotely operated vehicles (ROVs), face competition from increasingly sophisticated AUVs, offering enhanced autonomy and operational efficiency. End-user trends indicate a growing preference for AUVs capable of extended deployments and complex mission execution. The historical period (2019-2024) witnessed several notable mergers and acquisitions (M&A) transactions, with a combined deal value exceeding $xx Million, consolidating market power and driving innovation.
- Market Concentration: High (xx%) in 2025 among top 10 players.
- M&A Activity: Over $xx Million in deal value (2019-2024).
- Key Innovation Drivers: Advanced sensors, AI, improved battery technology.
- Regulatory Landscape: Varies significantly by region (e.g., differing standards for underwater operations).
Autonomous Underwater Vehicles Industry Trends & Insights
The AUV market is experiencing robust growth, driven by increasing demand across diverse sectors. The market is projected to exhibit a Compound Annual Growth Rate (CAGR) of xx% from 2025 to 2033, reaching a market value of $xx Million by 2033. Key growth drivers include advancements in autonomous navigation, sensor technologies, and energy storage solutions. Technological disruptions, such as the integration of Artificial Intelligence (AI) and machine learning algorithms, are enhancing AUV capabilities, enabling more complex and efficient operations. Consumer preferences are shifting towards AUVs with enhanced payload capacity, extended operational endurance, and improved communication capabilities. The competitive landscape remains dynamic, with companies focusing on strategic partnerships, R&D investments, and product diversification to gain a competitive edge. Market penetration is growing steadily across various applications, with particular momentum observed in military & defense and oil & gas sectors. This growth is further fueled by increased government funding for defense initiatives and the exploration of deep-sea oil and gas resources.
Dominant Markets & Segments in Autonomous Underwater Vehicles
The Military & Defense segment is currently the dominant application area for AUVs, accounting for xx% of the market in 2025, driven by the rising need for underwater surveillance, mine countermeasures, and anti-submarine warfare capabilities. The Oil & Gas industry is another major segment, with significant investments in AUVs for pipeline inspections, subsea surveys, and offshore exploration. Geographically, North America holds a dominant market position in 2025, driven by strong military spending and the presence of key AUV manufacturers.
- Dominant Application Segment: Military & Defense (xx% of 2025 market)
- Dominant Geographic Region: North America
- Key Drivers for Military & Defense: Increased defense budgets, growing geopolitical tensions.
- Key Drivers for Oil & Gas: Expanding offshore exploration, need for efficient pipeline inspection.
- Key Drivers for North America: High government spending on defense, robust innovation ecosystem.
By Type: The medium-sized AUV segment is the largest in 2025, striking a balance between operational capabilities and cost-effectiveness. Small AUVs are showing growth, especially in environmental monitoring, while large AUVs are primarily used for specialized applications.
Autonomous Underwater Vehicles Product Innovations
Recent innovations in AUV technology focus on enhancing autonomy, extending operational range, and improving payload capacity. Advances in AI-powered navigation systems, advanced sensor integration, and energy-efficient propulsion systems are transforming AUV capabilities, enabling more complex missions and improved data acquisition. This has led to a wider range of applications and increased market competitiveness among leading players.
Report Segmentation & Scope
The report segments the AUV market based on application (Military & Defense, Oil & Gas, Environment Protection & Monitoring, Oceanography, Archaeology & Exploration, Search & Salvage Operations) and type (Small, Medium, Large). Each segment’s growth projections, market sizes, and competitive dynamics are thoroughly analyzed. The report considers the historical period (2019–2024), the base year (2025), the estimated year (2025), and the forecast period (2025–2033).
Key Drivers of Autonomous Underwater Vehicles Growth
The AUV market's growth is driven by several factors: increasing demand for underwater data acquisition, advancements in autonomous navigation and sensor technologies, rising government investments in defense and oceanographic research, and the growing need for efficient underwater infrastructure inspection and maintenance in various industries.
Challenges in the Autonomous Underwater Vehicles Sector
The AUV sector faces challenges such as high initial investment costs, the complexity of underwater operations, the need for robust communication systems, and regulatory hurdles regarding data security and environmental regulations. Supply chain disruptions and intense competition further complicate market dynamics. The impact of these challenges is projected to decrease incrementally as the sector matures.
Leading Players in the Autonomous Underwater Vehicles Market
Key Developments in Autonomous Underwater Vehicles Sector
- July 2023: L3Harris Technologies Inc. successfully completed the first fully autonomous launch and recovery of an AUV from an underway submarine, showcasing advancements in AUV technology. This significantly enhances operational flexibility and reduces reliance on surface support.
- February 2024: Kongsberg secured a contract with the Defense Innovation Unit (DIU) to supply HUGIN AUVs to the US military, highlighting the growing demand for AUVs in defense applications. This signifies a crucial step in the adoption of advanced AUV technology for military purposes.
Strategic Autonomous Underwater Vehicles Market Outlook
The AUV market holds immense future potential, driven by continuous technological advancements, increasing demand across diverse applications, and significant investments in R&D. Strategic opportunities exist in developing advanced AI-powered AUVs, expanding into new applications, and exploring partnerships to leverage technological expertise and market access. The future growth trajectory appears positive, promising significant returns for companies that are able to successfully navigate the market's challenges.
Autonomous Underwater Vehicles Segmentation
- 1. Production Analysis
- 2. Consumption Analysis
- 3. Import Market Analysis (Value & Volume)
- 4. Export Market Analysis (Value & Volume)
- 5. Price Trend Analysis
Autonomous Underwater Vehicles Segmentation By Geography
-
1. North America
- 1.1. United States
- 1.2. Canada
- 1.3. Mexico
-
2. South America
- 2.1. Brazil
- 2.2. Argentina
- 2.3. Rest of South America
-
3. Europe
- 3.1. United Kingdom
- 3.2. Germany
- 3.3. France
- 3.4. Italy
- 3.5. Spain
- 3.6. Russia
- 3.7. Benelux
- 3.8. Nordics
- 3.9. Rest of Europe
-
4. Middle East & Africa
- 4.1. Turkey
- 4.2. Israel
- 4.3. GCC
- 4.4. North Africa
- 4.5. South Africa
- 4.6. Rest of Middle East & Africa
-
5. Asia Pacific
- 5.1. China
- 5.2. India
- 5.3. Japan
- 5.4. South Korea
- 5.5. ASEAN
- 5.6. Oceania
- 5.7. Rest of Asia Pacific
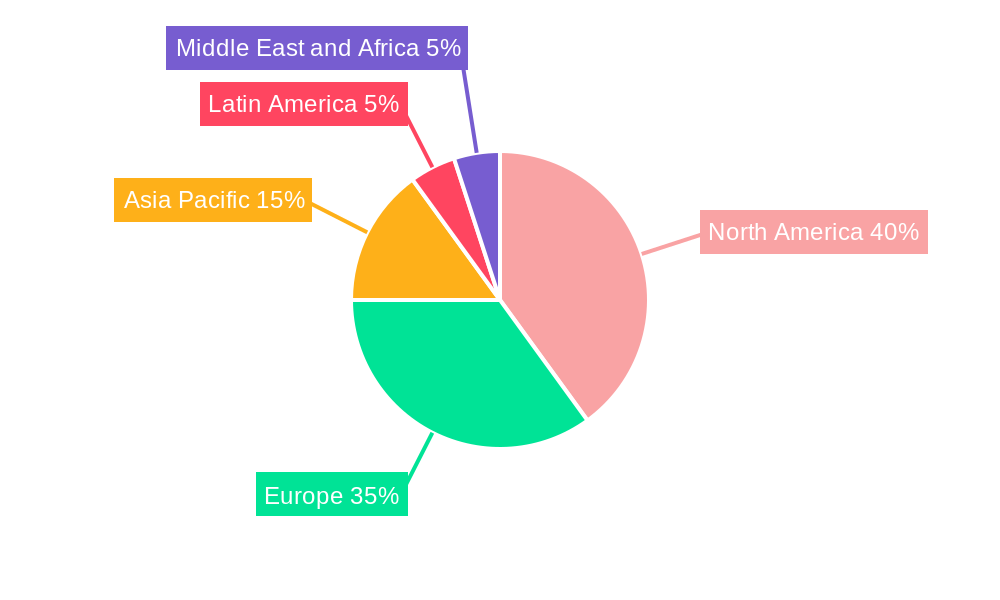
Autonomous Underwater Vehicles Regional Market Share
Geographic Coverage of Autonomous Underwater Vehicles
Autonomous Underwater Vehicles REPORT HIGHLIGHTS
| Aspects | Details |
|---|---|
| Study Period | 2020-2034 |
| Base Year | 2025 |
| Estimated Year | 2026 |
| Forecast Period | 2026-2034 |
| Historical Period | 2020-2025 |
| Growth Rate | CAGR of 8.2% from 2020-2034 |
| Segmentation |
|
Table of Contents
- 1. Introduction
- 1.1. Research Scope
- 1.2. Market Segmentation
- 1.3. Research Objective
- 1.4. Definitions and Assumptions
- 2. Executive Summary
- 2.1. Market Snapshot
- 3. Market Dynamics
- 3.1. Market Drivers
- 3.2. Market Restrains
- 3.3. Market Trends
- 3.4. Market Opportunities
- 4. Market Factor Analysis
- 4.1. Porters Five Forces
- 4.1.1. Bargaining Power of Suppliers
- 4.1.2. Bargaining Power of Buyers
- 4.1.3. Threat of New Entrants
- 4.1.4. Threat of Substitutes
- 4.1.5. Competitive Rivalry
- 4.2. PESTEL analysis
- 4.3. BCG Analysis
- 4.3.1. Stars (High Growth, High Market Share)
- 4.3.2. Cash Cows (Low Growth, High Market Share)
- 4.3.3. Question Mark (High Growth, Low Market Share)
- 4.3.4. Dogs (Low Growth, Low Market Share)
- 4.4. Ansoff Matrix Analysis
- 4.5. Supply Chain Analysis
- 4.6. Regulatory Landscape
- 4.7. Current Market Potential and Opportunity Assessment (TAM–SAM–SOM Framework)
- 4.8. PMV Analyst Note
- 4.1. Porters Five Forces
- 5. Market Analysis, Insights and Forecast 2021-2033
- 5.1. Market Analysis, Insights and Forecast - by Production Analysis
- 5.2. Market Analysis, Insights and Forecast - by Consumption Analysis
- 5.3. Market Analysis, Insights and Forecast - by Import Market Analysis (Value & Volume)
- 5.4. Market Analysis, Insights and Forecast - by Export Market Analysis (Value & Volume)
- 5.5. Market Analysis, Insights and Forecast - by Price Trend Analysis
- 5.6. Market Analysis, Insights and Forecast - by Region
- 5.6.1. North America
- 5.6.2. South America
- 5.6.3. Europe
- 5.6.4. Middle East & Africa
- 5.6.5. Asia Pacific
- 6. Global Autonomous Underwater Vehicles Analysis, Insights and Forecast, 2021-2033
- 6.1. Market Analysis, Insights and Forecast - by Production Analysis
- 6.2. Market Analysis, Insights and Forecast - by Consumption Analysis
- 6.3. Market Analysis, Insights and Forecast - by Import Market Analysis (Value & Volume)
- 6.4. Market Analysis, Insights and Forecast - by Export Market Analysis (Value & Volume)
- 6.5. Market Analysis, Insights and Forecast - by Price Trend Analysis
- 7. North America Autonomous Underwater Vehicles Analysis, Insights and Forecast, 2020-2032
- 7.1. Market Analysis, Insights and Forecast - by Production Analysis
- 7.2. Market Analysis, Insights and Forecast - by Consumption Analysis
- 7.3. Market Analysis, Insights and Forecast - by Import Market Analysis (Value & Volume)
- 7.4. Market Analysis, Insights and Forecast - by Export Market Analysis (Value & Volume)
- 7.5. Market Analysis, Insights and Forecast - by Price Trend Analysis
- 8. South America Autonomous Underwater Vehicles Analysis, Insights and Forecast, 2020-2032
- 8.1. Market Analysis, Insights and Forecast - by Production Analysis
- 8.2. Market Analysis, Insights and Forecast - by Consumption Analysis
- 8.3. Market Analysis, Insights and Forecast - by Import Market Analysis (Value & Volume)
- 8.4. Market Analysis, Insights and Forecast - by Export Market Analysis (Value & Volume)
- 8.5. Market Analysis, Insights and Forecast - by Price Trend Analysis
- 9. Europe Autonomous Underwater Vehicles Analysis, Insights and Forecast, 2020-2032
- 9.1. Market Analysis, Insights and Forecast - by Production Analysis
- 9.2. Market Analysis, Insights and Forecast - by Consumption Analysis
- 9.3. Market Analysis, Insights and Forecast - by Import Market Analysis (Value & Volume)
- 9.4. Market Analysis, Insights and Forecast - by Export Market Analysis (Value & Volume)
- 9.5. Market Analysis, Insights and Forecast - by Price Trend Analysis
- 10. Middle East & Africa Autonomous Underwater Vehicles Analysis, Insights and Forecast, 2020-2032
- 10.1. Market Analysis, Insights and Forecast - by Production Analysis
- 10.2. Market Analysis, Insights and Forecast - by Consumption Analysis
- 10.3. Market Analysis, Insights and Forecast - by Import Market Analysis (Value & Volume)
- 10.4. Market Analysis, Insights and Forecast - by Export Market Analysis (Value & Volume)
- 10.5. Market Analysis, Insights and Forecast - by Price Trend Analysis
- 11. Asia Pacific Autonomous Underwater Vehicles Analysis, Insights and Forecast, 2020-2032
- 11.1. Market Analysis, Insights and Forecast - by Production Analysis
- 11.2. Market Analysis, Insights and Forecast - by Consumption Analysis
- 11.3. Market Analysis, Insights and Forecast - by Import Market Analysis (Value & Volume)
- 11.4. Market Analysis, Insights and Forecast - by Export Market Analysis (Value & Volume)
- 11.5. Market Analysis, Insights and Forecast - by Price Trend Analysis
- 12. Competitive Analysis
- 12.1. Company Profiles
- 12.1.1 L3Harris Technologies Inc
- 12.1.1.1. Company Overview
- 12.1.1.2. Products
- 12.1.1.3. Company Financials
- 12.1.1.4. SWOT Analysis
- 12.1.2 General Dynamics Corporation
- 12.1.2.1. Company Overview
- 12.1.2.2. Products
- 12.1.2.3. Company Financials
- 12.1.2.4. SWOT Analysis
- 12.1.3 Lockheed Martin Corporation
- 12.1.3.1. Company Overview
- 12.1.3.2. Products
- 12.1.3.3. Company Financials
- 12.1.3.4. SWOT Analysis
- 12.1.4 Kongsberg Gruppen ASA
- 12.1.4.1. Company Overview
- 12.1.4.2. Products
- 12.1.4.3. Company Financials
- 12.1.4.4. SWOT Analysis
- 12.1.5 Exail Technologies S
- 12.1.5.1. Company Overview
- 12.1.5.2. Products
- 12.1.5.3. Company Financials
- 12.1.5.4. SWOT Analysis
- 12.1.6 SAAB AB
- 12.1.6.1. Company Overview
- 12.1.6.2. Products
- 12.1.6.3. Company Financials
- 12.1.6.4. SWOT Analysis
- 12.1.7 BAE Systems plc
- 12.1.7.1. Company Overview
- 12.1.7.2. Products
- 12.1.7.3. Company Financials
- 12.1.7.4. SWOT Analysis
- 12.1.8 Teledyne Technologies Inc
- 12.1.8.1. Company Overview
- 12.1.8.2. Products
- 12.1.8.3. Company Financials
- 12.1.8.4. SWOT Analysis
- 12.1.9 The Boeing Company
- 12.1.9.1. Company Overview
- 12.1.9.2. Products
- 12.1.9.3. Company Financials
- 12.1.9.4. SWOT Analysis
- 12.1.1 L3Harris Technologies Inc
- 12.2. Market Entropy
- 12.2.1 Company's Key Areas Served
- 12.2.2 Recent Developments
- 12.3. Company Market Share Analysis 2025
- 12.3.1 Top 5 Companies Market Share Analysis
- 12.3.2 Top 3 Companies Market Share Analysis
- 12.4. List of Potential Customers
- 13. Research Methodology
List of Figures
- Figure 1: Global Autonomous Underwater Vehicles Revenue Breakdown (undefined, %) by Region 2025 & 2033
- Figure 2: North America Autonomous Underwater Vehicles Revenue (undefined), by Production Analysis 2025 & 2033
- Figure 3: North America Autonomous Underwater Vehicles Revenue Share (%), by Production Analysis 2025 & 2033
- Figure 4: North America Autonomous Underwater Vehicles Revenue (undefined), by Consumption Analysis 2025 & 2033
- Figure 5: North America Autonomous Underwater Vehicles Revenue Share (%), by Consumption Analysis 2025 & 2033
- Figure 6: North America Autonomous Underwater Vehicles Revenue (undefined), by Import Market Analysis (Value & Volume) 2025 & 2033
- Figure 7: North America Autonomous Underwater Vehicles Revenue Share (%), by Import Market Analysis (Value & Volume) 2025 & 2033
- Figure 8: North America Autonomous Underwater Vehicles Revenue (undefined), by Export Market Analysis (Value & Volume) 2025 & 2033
- Figure 9: North America Autonomous Underwater Vehicles Revenue Share (%), by Export Market Analysis (Value & Volume) 2025 & 2033
- Figure 10: North America Autonomous Underwater Vehicles Revenue (undefined), by Price Trend Analysis 2025 & 2033
- Figure 11: North America Autonomous Underwater Vehicles Revenue Share (%), by Price Trend Analysis 2025 & 2033
- Figure 12: North America Autonomous Underwater Vehicles Revenue (undefined), by Country 2025 & 2033
- Figure 13: North America Autonomous Underwater Vehicles Revenue Share (%), by Country 2025 & 2033
- Figure 14: South America Autonomous Underwater Vehicles Revenue (undefined), by Production Analysis 2025 & 2033
- Figure 15: South America Autonomous Underwater Vehicles Revenue Share (%), by Production Analysis 2025 & 2033
- Figure 16: South America Autonomous Underwater Vehicles Revenue (undefined), by Consumption Analysis 2025 & 2033
- Figure 17: South America Autonomous Underwater Vehicles Revenue Share (%), by Consumption Analysis 2025 & 2033
- Figure 18: South America Autonomous Underwater Vehicles Revenue (undefined), by Import Market Analysis (Value & Volume) 2025 & 2033
- Figure 19: South America Autonomous Underwater Vehicles Revenue Share (%), by Import Market Analysis (Value & Volume) 2025 & 2033
- Figure 20: South America Autonomous Underwater Vehicles Revenue (undefined), by Export Market Analysis (Value & Volume) 2025 & 2033
- Figure 21: South America Autonomous Underwater Vehicles Revenue Share (%), by Export Market Analysis (Value & Volume) 2025 & 2033
- Figure 22: South America Autonomous Underwater Vehicles Revenue (undefined), by Price Trend Analysis 2025 & 2033
- Figure 23: South America Autonomous Underwater Vehicles Revenue Share (%), by Price Trend Analysis 2025 & 2033
- Figure 24: South America Autonomous Underwater Vehicles Revenue (undefined), by Country 2025 & 2033
- Figure 25: South America Autonomous Underwater Vehicles Revenue Share (%), by Country 2025 & 2033
- Figure 26: Europe Autonomous Underwater Vehicles Revenue (undefined), by Production Analysis 2025 & 2033
- Figure 27: Europe Autonomous Underwater Vehicles Revenue Share (%), by Production Analysis 2025 & 2033
- Figure 28: Europe Autonomous Underwater Vehicles Revenue (undefined), by Consumption Analysis 2025 & 2033
- Figure 29: Europe Autonomous Underwater Vehicles Revenue Share (%), by Consumption Analysis 2025 & 2033
- Figure 30: Europe Autonomous Underwater Vehicles Revenue (undefined), by Import Market Analysis (Value & Volume) 2025 & 2033
- Figure 31: Europe Autonomous Underwater Vehicles Revenue Share (%), by Import Market Analysis (Value & Volume) 2025 & 2033
- Figure 32: Europe Autonomous Underwater Vehicles Revenue (undefined), by Export Market Analysis (Value & Volume) 2025 & 2033
- Figure 33: Europe Autonomous Underwater Vehicles Revenue Share (%), by Export Market Analysis (Value & Volume) 2025 & 2033
- Figure 34: Europe Autonomous Underwater Vehicles Revenue (undefined), by Price Trend Analysis 2025 & 2033
- Figure 35: Europe Autonomous Underwater Vehicles Revenue Share (%), by Price Trend Analysis 2025 & 2033
- Figure 36: Europe Autonomous Underwater Vehicles Revenue (undefined), by Country 2025 & 2033
- Figure 37: Europe Autonomous Underwater Vehicles Revenue Share (%), by Country 2025 & 2033
- Figure 38: Middle East & Africa Autonomous Underwater Vehicles Revenue (undefined), by Production Analysis 2025 & 2033
- Figure 39: Middle East & Africa Autonomous Underwater Vehicles Revenue Share (%), by Production Analysis 2025 & 2033
- Figure 40: Middle East & Africa Autonomous Underwater Vehicles Revenue (undefined), by Consumption Analysis 2025 & 2033
- Figure 41: Middle East & Africa Autonomous Underwater Vehicles Revenue Share (%), by Consumption Analysis 2025 & 2033
- Figure 42: Middle East & Africa Autonomous Underwater Vehicles Revenue (undefined), by Import Market Analysis (Value & Volume) 2025 & 2033
- Figure 43: Middle East & Africa Autonomous Underwater Vehicles Revenue Share (%), by Import Market Analysis (Value & Volume) 2025 & 2033
- Figure 44: Middle East & Africa Autonomous Underwater Vehicles Revenue (undefined), by Export Market Analysis (Value & Volume) 2025 & 2033
- Figure 45: Middle East & Africa Autonomous Underwater Vehicles Revenue Share (%), by Export Market Analysis (Value & Volume) 2025 & 2033
- Figure 46: Middle East & Africa Autonomous Underwater Vehicles Revenue (undefined), by Price Trend Analysis 2025 & 2033
- Figure 47: Middle East & Africa Autonomous Underwater Vehicles Revenue Share (%), by Price Trend Analysis 2025 & 2033
- Figure 48: Middle East & Africa Autonomous Underwater Vehicles Revenue (undefined), by Country 2025 & 2033
- Figure 49: Middle East & Africa Autonomous Underwater Vehicles Revenue Share (%), by Country 2025 & 2033
- Figure 50: Asia Pacific Autonomous Underwater Vehicles Revenue (undefined), by Production Analysis 2025 & 2033
- Figure 51: Asia Pacific Autonomous Underwater Vehicles Revenue Share (%), by Production Analysis 2025 & 2033
- Figure 52: Asia Pacific Autonomous Underwater Vehicles Revenue (undefined), by Consumption Analysis 2025 & 2033
- Figure 53: Asia Pacific Autonomous Underwater Vehicles Revenue Share (%), by Consumption Analysis 2025 & 2033
- Figure 54: Asia Pacific Autonomous Underwater Vehicles Revenue (undefined), by Import Market Analysis (Value & Volume) 2025 & 2033
- Figure 55: Asia Pacific Autonomous Underwater Vehicles Revenue Share (%), by Import Market Analysis (Value & Volume) 2025 & 2033
- Figure 56: Asia Pacific Autonomous Underwater Vehicles Revenue (undefined), by Export Market Analysis (Value & Volume) 2025 & 2033
- Figure 57: Asia Pacific Autonomous Underwater Vehicles Revenue Share (%), by Export Market Analysis (Value & Volume) 2025 & 2033
- Figure 58: Asia Pacific Autonomous Underwater Vehicles Revenue (undefined), by Price Trend Analysis 2025 & 2033
- Figure 59: Asia Pacific Autonomous Underwater Vehicles Revenue Share (%), by Price Trend Analysis 2025 & 2033
- Figure 60: Asia Pacific Autonomous Underwater Vehicles Revenue (undefined), by Country 2025 & 2033
- Figure 61: Asia Pacific Autonomous Underwater Vehicles Revenue Share (%), by Country 2025 & 2033
List of Tables
- Table 1: Global Autonomous Underwater Vehicles Revenue undefined Forecast, by Production Analysis 2020 & 2033
- Table 2: Global Autonomous Underwater Vehicles Revenue undefined Forecast, by Consumption Analysis 2020 & 2033
- Table 3: Global Autonomous Underwater Vehicles Revenue undefined Forecast, by Import Market Analysis (Value & Volume) 2020 & 2033
- Table 4: Global Autonomous Underwater Vehicles Revenue undefined Forecast, by Export Market Analysis (Value & Volume) 2020 & 2033
- Table 5: Global Autonomous Underwater Vehicles Revenue undefined Forecast, by Price Trend Analysis 2020 & 2033
- Table 6: Global Autonomous Underwater Vehicles Revenue undefined Forecast, by Region 2020 & 2033
- Table 7: Global Autonomous Underwater Vehicles Revenue undefined Forecast, by Production Analysis 2020 & 2033
- Table 8: Global Autonomous Underwater Vehicles Revenue undefined Forecast, by Consumption Analysis 2020 & 2033
- Table 9: Global Autonomous Underwater Vehicles Revenue undefined Forecast, by Import Market Analysis (Value & Volume) 2020 & 2033
- Table 10: Global Autonomous Underwater Vehicles Revenue undefined Forecast, by Export Market Analysis (Value & Volume) 2020 & 2033
- Table 11: Global Autonomous Underwater Vehicles Revenue undefined Forecast, by Price Trend Analysis 2020 & 2033
- Table 12: Global Autonomous Underwater Vehicles Revenue undefined Forecast, by Country 2020 & 2033
- Table 13: United States Autonomous Underwater Vehicles Revenue (undefined) Forecast, by Application 2020 & 2033
- Table 14: Canada Autonomous Underwater Vehicles Revenue (undefined) Forecast, by Application 2020 & 2033
- Table 15: Mexico Autonomous Underwater Vehicles Revenue (undefined) Forecast, by Application 2020 & 2033
- Table 16: Global Autonomous Underwater Vehicles Revenue undefined Forecast, by Production Analysis 2020 & 2033
- Table 17: Global Autonomous Underwater Vehicles Revenue undefined Forecast, by Consumption Analysis 2020 & 2033
- Table 18: Global Autonomous Underwater Vehicles Revenue undefined Forecast, by Import Market Analysis (Value & Volume) 2020 & 2033
- Table 19: Global Autonomous Underwater Vehicles Revenue undefined Forecast, by Export Market Analysis (Value & Volume) 2020 & 2033
- Table 20: Global Autonomous Underwater Vehicles Revenue undefined Forecast, by Price Trend Analysis 2020 & 2033
- Table 21: Global Autonomous Underwater Vehicles Revenue undefined Forecast, by Country 2020 & 2033
- Table 22: Brazil Autonomous Underwater Vehicles Revenue (undefined) Forecast, by Application 2020 & 2033
- Table 23: Argentina Autonomous Underwater Vehicles Revenue (undefined) Forecast, by Application 2020 & 2033
- Table 24: Rest of South America Autonomous Underwater Vehicles Revenue (undefined) Forecast, by Application 2020 & 2033
- Table 25: Global Autonomous Underwater Vehicles Revenue undefined Forecast, by Production Analysis 2020 & 2033
- Table 26: Global Autonomous Underwater Vehicles Revenue undefined Forecast, by Consumption Analysis 2020 & 2033
- Table 27: Global Autonomous Underwater Vehicles Revenue undefined Forecast, by Import Market Analysis (Value & Volume) 2020 & 2033
- Table 28: Global Autonomous Underwater Vehicles Revenue undefined Forecast, by Export Market Analysis (Value & Volume) 2020 & 2033
- Table 29: Global Autonomous Underwater Vehicles Revenue undefined Forecast, by Price Trend Analysis 2020 & 2033
- Table 30: Global Autonomous Underwater Vehicles Revenue undefined Forecast, by Country 2020 & 2033
- Table 31: United Kingdom Autonomous Underwater Vehicles Revenue (undefined) Forecast, by Application 2020 & 2033
- Table 32: Germany Autonomous Underwater Vehicles Revenue (undefined) Forecast, by Application 2020 & 2033
- Table 33: France Autonomous Underwater Vehicles Revenue (undefined) Forecast, by Application 2020 & 2033
- Table 34: Italy Autonomous Underwater Vehicles Revenue (undefined) Forecast, by Application 2020 & 2033
- Table 35: Spain Autonomous Underwater Vehicles Revenue (undefined) Forecast, by Application 2020 & 2033
- Table 36: Russia Autonomous Underwater Vehicles Revenue (undefined) Forecast, by Application 2020 & 2033
- Table 37: Benelux Autonomous Underwater Vehicles Revenue (undefined) Forecast, by Application 2020 & 2033
- Table 38: Nordics Autonomous Underwater Vehicles Revenue (undefined) Forecast, by Application 2020 & 2033
- Table 39: Rest of Europe Autonomous Underwater Vehicles Revenue (undefined) Forecast, by Application 2020 & 2033
- Table 40: Global Autonomous Underwater Vehicles Revenue undefined Forecast, by Production Analysis 2020 & 2033
- Table 41: Global Autonomous Underwater Vehicles Revenue undefined Forecast, by Consumption Analysis 2020 & 2033
- Table 42: Global Autonomous Underwater Vehicles Revenue undefined Forecast, by Import Market Analysis (Value & Volume) 2020 & 2033
- Table 43: Global Autonomous Underwater Vehicles Revenue undefined Forecast, by Export Market Analysis (Value & Volume) 2020 & 2033
- Table 44: Global Autonomous Underwater Vehicles Revenue undefined Forecast, by Price Trend Analysis 2020 & 2033
- Table 45: Global Autonomous Underwater Vehicles Revenue undefined Forecast, by Country 2020 & 2033
- Table 46: Turkey Autonomous Underwater Vehicles Revenue (undefined) Forecast, by Application 2020 & 2033
- Table 47: Israel Autonomous Underwater Vehicles Revenue (undefined) Forecast, by Application 2020 & 2033
- Table 48: GCC Autonomous Underwater Vehicles Revenue (undefined) Forecast, by Application 2020 & 2033
- Table 49: North Africa Autonomous Underwater Vehicles Revenue (undefined) Forecast, by Application 2020 & 2033
- Table 50: South Africa Autonomous Underwater Vehicles Revenue (undefined) Forecast, by Application 2020 & 2033
- Table 51: Rest of Middle East & Africa Autonomous Underwater Vehicles Revenue (undefined) Forecast, by Application 2020 & 2033
- Table 52: Global Autonomous Underwater Vehicles Revenue undefined Forecast, by Production Analysis 2020 & 2033
- Table 53: Global Autonomous Underwater Vehicles Revenue undefined Forecast, by Consumption Analysis 2020 & 2033
- Table 54: Global Autonomous Underwater Vehicles Revenue undefined Forecast, by Import Market Analysis (Value & Volume) 2020 & 2033
- Table 55: Global Autonomous Underwater Vehicles Revenue undefined Forecast, by Export Market Analysis (Value & Volume) 2020 & 2033
- Table 56: Global Autonomous Underwater Vehicles Revenue undefined Forecast, by Price Trend Analysis 2020 & 2033
- Table 57: Global Autonomous Underwater Vehicles Revenue undefined Forecast, by Country 2020 & 2033
- Table 58: China Autonomous Underwater Vehicles Revenue (undefined) Forecast, by Application 2020 & 2033
- Table 59: India Autonomous Underwater Vehicles Revenue (undefined) Forecast, by Application 2020 & 2033
- Table 60: Japan Autonomous Underwater Vehicles Revenue (undefined) Forecast, by Application 2020 & 2033
- Table 61: South Korea Autonomous Underwater Vehicles Revenue (undefined) Forecast, by Application 2020 & 2033
- Table 62: ASEAN Autonomous Underwater Vehicles Revenue (undefined) Forecast, by Application 2020 & 2033
- Table 63: Oceania Autonomous Underwater Vehicles Revenue (undefined) Forecast, by Application 2020 & 2033
- Table 64: Rest of Asia Pacific Autonomous Underwater Vehicles Revenue (undefined) Forecast, by Application 2020 & 2033
Frequently Asked Questions
1. What is the projected Compound Annual Growth Rate (CAGR) of the Autonomous Underwater Vehicles?
The projected CAGR is approximately 8.2%.
2. Which companies are prominent players in the Autonomous Underwater Vehicles?
Key companies in the market include L3Harris Technologies Inc, General Dynamics Corporation, Lockheed Martin Corporation, Kongsberg Gruppen ASA, Exail Technologies S, SAAB AB, BAE Systems plc, Teledyne Technologies Inc, The Boeing Company.
3. What are the main segments of the Autonomous Underwater Vehicles?
The market segments include Production Analysis, Consumption Analysis, Import Market Analysis (Value & Volume), Export Market Analysis (Value & Volume), Price Trend Analysis.
4. Can you provide details about the market size?
The market size is estimated to be USD XXX N/A as of 2022.
5. What are some drivers contributing to market growth?
Increase in Internet of Things (IoT) and Autonomous Systems; Rise in Demand for Military and Defense Satellite Communication Solutions.
6. What are the notable trends driving market growth?
Military & Defense will a Hold Significant Market Share.
7. Are there any restraints impacting market growth?
Cybersecurity Threats to Satellite Communication; Interference in Transmission of Data.
8. Can you provide examples of recent developments in the market?
February 2024: Kongsberg was awarded a contract with the Defense Innovation Unit (DIU) to rapidly deliver HUGIN Autonomous Underwater Vehicle (AUV) capabilities for the US military.
9. What pricing options are available for accessing the report?
Pricing options include single-user, multi-user, and enterprise licenses priced at USD 4750, USD 5250, and USD 8750 respectively.
10. Is the market size provided in terms of value or volume?
The market size is provided in terms of value, measured in N/A.
11. Are there any specific market keywords associated with the report?
Yes, the market keyword associated with the report is "Autonomous Underwater Vehicles," which aids in identifying and referencing the specific market segment covered.
12. How do I determine which pricing option suits my needs best?
The pricing options vary based on user requirements and access needs. Individual users may opt for single-user licenses, while businesses requiring broader access may choose multi-user or enterprise licenses for cost-effective access to the report.
13. Are there any additional resources or data provided in the Autonomous Underwater Vehicles report?
While the report offers comprehensive insights, it's advisable to review the specific contents or supplementary materials provided to ascertain if additional resources or data are available.
14. How can I stay updated on further developments or reports in the Autonomous Underwater Vehicles?
To stay informed about further developments, trends, and reports in the Autonomous Underwater Vehicles, consider subscribing to industry newsletters, following relevant companies and organizations, or regularly checking reputable industry news sources and publications.
Methodology
Step 1 - Identification of Relevant Samples Size from Population Database


Step 2 - Approaches for Defining Global Market Size (Value, Volume* & Price*)

Note*: In applicable scenarios
Step 3 - Data Sources
Primary Research
- Web Analytics
- Survey Reports
- Research Institute
- Latest Research Reports
- Opinion Leaders
Secondary Research
- Annual Reports
- White Paper
- Latest Press Release
- Industry Association
- Paid Database
- Investor Presentations

Step 4 - Data Triangulation
Involves using different sources of information in order to increase the validity of a study
These sources are likely to be stakeholders in a program - participants, other researchers, program staff, other community members, and so on.
Then we put all data in single framework & apply various statistical tools to find out the dynamic on the market.
During the analysis stage, feedback from the stakeholder groups would be compared to determine areas of agreement as well as areas of divergence