
Key Insights
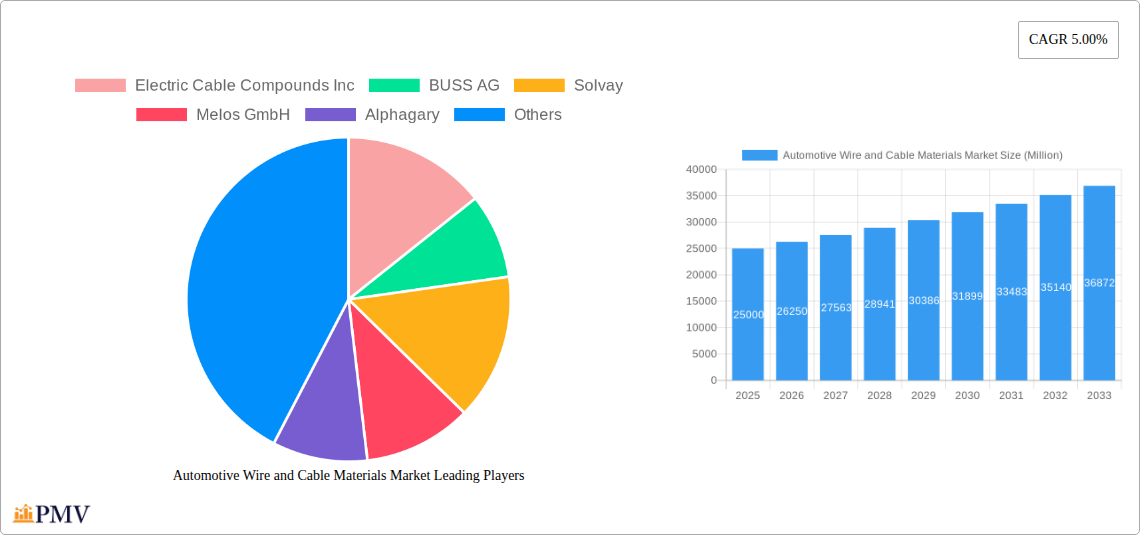
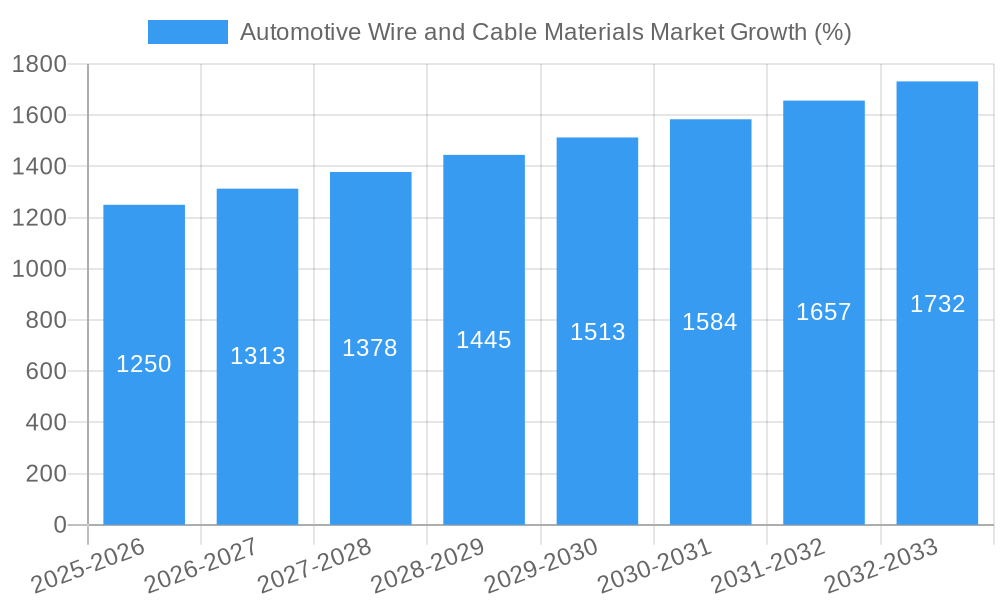
The Automotive Wire and Cable Materials market is experiencing robust growth, driven by the increasing electrification of vehicles and the expanding adoption of advanced driver-assistance systems (ADAS). The market's Compound Annual Growth Rate (CAGR) of 5.00% from 2019 to 2024 indicates a steady upward trajectory, projected to continue through 2033. Key drivers include the rising demand for lightweight vehicles, improving fuel efficiency standards, and the integration of complex electronic systems in modern automobiles. The shift towards electric vehicles (EVs) is a particularly significant factor, as EVs require significantly more wiring compared to internal combustion engine (ICE) vehicles. Growth is further fueled by technological advancements in materials science, leading to the development of high-performance cables with enhanced durability, flexibility, and thermal resistance. While the market faces challenges such as fluctuating raw material prices and stringent regulatory compliance requirements, the long-term outlook remains positive, supported by continuous innovation and the sustained growth of the automotive industry.
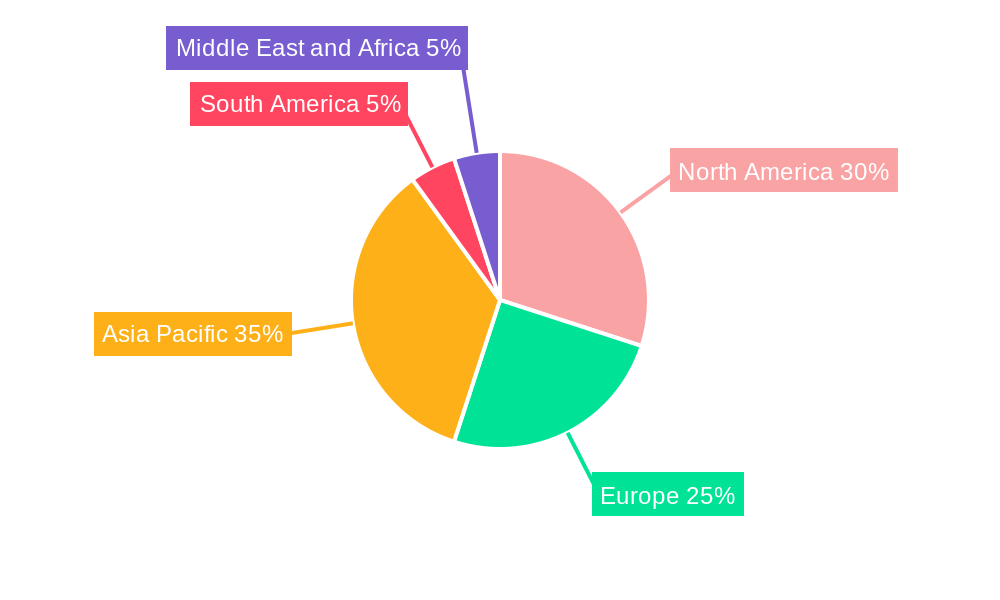
Segmentation analysis reveals a diversified market landscape. Fiber optic cables are gaining traction due to their high bandwidth capacity, suitable for data-intensive applications in modern vehicles. Polyvinyl Chloride (PVC) remains a dominant polymer type due to its cost-effectiveness, but the adoption of other materials like Thermoplastic Elastomer (TPE) and Thermoplastic Polyurethane (TPU) is increasing due to their superior properties, such as improved flexibility and resistance to harsh environmental conditions. The automotive sector holds a significant share of the end-user industry, followed by the construction and electrical & electronics sectors. Key players such as Electric Cable Compounds Inc, Solvay, and Teknor Apex are actively investing in research and development to improve product offerings and expand their market presence. Regional analysis suggests that the Asia Pacific region, especially China and India, is expected to witness significant growth due to rapid automotive production expansion in these markets. North America and Europe remain key markets, driven by the high adoption of advanced vehicle technologies.
Automotive Wire and Cable Materials Market: A Comprehensive Market Research Report (2019-2033)
This comprehensive report provides an in-depth analysis of the Automotive Wire and Cable Materials market, offering valuable insights into market dynamics, competitive landscape, and future growth opportunities. The study period covers 2019-2033, with 2025 as the base and estimated year, and a forecast period of 2025-2033. The report segments the market by product type (Fiber Optic Cable, Coaxial Cable, Others), polymer type (Polyvinyl Chloride (PVC), Thermoplastic Elastomer (TPE), Thermoplastic Polyurethane (TPU), Thermoplastic Olefin (TPO), Others), and end-user industry (Automotive, Construction, Electrical and Electronics, Health Care, Power, Telecommunication, Others). Key players analyzed include Electric Cable Compounds Inc, BUSS AG, Solvay, Melos GmbH, Alphagary, Cabot Corporation, Relicab Cable Manufacturing Limited, PVCL, Trelleborg, Chemceed, Teknor Apex, and SCG Chemicals Co Ltd. This report is essential for industry professionals, investors, and anyone seeking a comprehensive understanding of this dynamic market.
Automotive Wire and Cable Materials Market Market Structure & Competitive Dynamics
The Automotive Wire and Cable Materials market exhibits a moderately consolidated structure, with several key players holding significant market share. The market concentration is influenced by factors such as technological advancements, economies of scale, and the ability to meet stringent automotive industry standards. Innovation ecosystems play a crucial role, driving the development of advanced materials with improved performance characteristics and enhanced durability. Stringent regulatory frameworks, particularly concerning safety and environmental compliance, shape the industry landscape and influence material selection. Product substitution, primarily driven by the adoption of lighter and more efficient materials, is an ongoing trend. End-user trends, particularly the shift towards electric and autonomous vehicles, significantly impact demand for specific wire and cable materials. M&A activities have been moderate in recent years, with deal values averaging approximately xx Million annually. Key players are strategically pursuing partnerships and acquisitions to enhance their product portfolios, expand geographical reach, and strengthen their competitive positions. Market share data reveals that the top five players collectively hold approximately xx% of the market, with Solvay and Teknor Apex being major players.
Automotive Wire and Cable Materials Market Industry Trends & Insights
The Automotive Wire and Cable Materials market is experiencing robust growth, driven by several key factors. The increasing demand for electric vehicles (EVs) is a primary driver, fueling the need for specialized materials capable of handling high voltage and current. The rising adoption of advanced driver-assistance systems (ADAS) and autonomous driving technologies is also contributing to market expansion. Technological disruptions, such as the development of lightweight and high-performance materials, are reshaping the industry. Consumer preferences for fuel-efficient and environmentally friendly vehicles are driving demand for materials with reduced environmental impact. Intense competition among manufacturers is fostering innovation and driving down costs. The market is projected to register a Compound Annual Growth Rate (CAGR) of xx% during the forecast period (2025-2033), with significant penetration in the electric vehicle segment. Market penetration rates for specific polymer types, such as TPE and TPU, are expected to increase significantly due to their superior properties.
Dominant Markets & Segments in Automotive Wire and Cable Materials Market
Leading Region: Asia Pacific dominates the Automotive Wire and Cable Materials market due to the rapid growth of the automotive industry in countries like China and India. High vehicle production volumes, coupled with supportive government policies, are key drivers.
Leading Country: China emerges as the leading country in the market, driven by its massive automotive production base and increasing domestic demand for vehicles.
Dominant Product Segment: The coaxial cable segment holds a significant market share, primarily due to its wide application in automotive electronics and communication systems.
Dominant Polymer Type: PVC remains the dominant polymer type due to its cost-effectiveness and established manufacturing infrastructure. However, the demand for TPE and TPU is rapidly growing due to their superior flexibility and durability.
Dominant End-User Industry: The automotive sector accounts for the largest share of the market, with the increasing electrification and automation of vehicles significantly boosting demand.
Key drivers for regional dominance include favorable economic policies, investments in infrastructure development, and a strong focus on technological advancement. The dominance of specific segments reflects factors such as material properties, cost considerations, and application requirements.
Automotive Wire and Cable Materials Market Product Innovations
Recent years have witnessed significant innovations in automotive wire and cable materials, driven by the need for lighter, more durable, and environmentally friendly solutions. The introduction of halogen-free and flame-retardant materials addresses safety concerns. Advancements in polymer technology are leading to the development of materials with improved electrical properties, thermal stability, and resistance to chemicals and abrasion. These innovations cater to the increasing complexity and performance demands of modern automotive systems, offering competitive advantages to manufacturers who adopt these advanced materials.
Report Segmentation & Scope
The report provides detailed segmentation by product type (Fiber Optic Cable, Coaxial Cable, Others), each demonstrating unique growth projections and competitive dynamics. The Polymer Type segment (PVC, TPE, TPU, TPO, Others) is analyzed similarly, with projected market sizes reflecting the adoption rates and material properties. Similarly, each end-user industry segment (Automotive, Construction, Electrical and Electronics, Health Care, Power, Telecommunication, Others) is thoroughly investigated, revealing different growth trajectories and competitive intensities. Market sizes and growth rates vary across segments, reflecting the diverse applications and industry-specific trends.
Key Drivers of Automotive Wire and Cable Materials Market Growth
The growth of the Automotive Wire and Cable Materials market is propelled by several key factors. The rapid expansion of the global automotive industry, especially the surge in electric vehicle production, is a primary driver. Technological advancements in automotive electronics and the increasing integration of sophisticated systems demand specialized wire and cable materials with enhanced performance characteristics. Government regulations emphasizing vehicle safety and environmental sustainability further stimulate the market.
Challenges in the Automotive Wire and Cable Materials Market Sector
The Automotive Wire and Cable Materials market faces several challenges. Fluctuations in raw material prices and supply chain disruptions can significantly impact production costs and profitability. Stringent industry regulations regarding material safety and environmental compliance increase the complexity and cost of manufacturing. Intense competition among manufacturers necessitates continuous innovation and cost optimization to maintain market share. These factors pose significant challenges and impact the market's growth trajectory.
Leading Players in the Automotive Wire and Cable Materials Market Market
- Electric Cable Compounds Inc
- BUSS AG
- Solvay
- Melos GmbH
- Alphagary
- Cabot Corporation
- Relicab Cable Manufacturing Limited
- PVCL
- Trelleborg
- Chemceed
- Teknor Apex
- SCG Chemicals Co Ltd
Key Developments in Automotive Wire and Cable Materials Market Sector
- January 2023: Solvay launched a new generation of TPE compounds for automotive applications.
- March 2022: Teknor Apex announced a significant investment in its manufacturing facility to expand its capacity for automotive wire and cable materials.
- June 2021: A strategic partnership was formed between BUSS AG and a major automotive manufacturer to develop customized wire and cable solutions. (Specific details omitted for confidentiality).
Strategic Automotive Wire and Cable Materials Market Market Outlook
The future of the Automotive Wire and Cable Materials market appears promising, driven by the continued growth of the automotive industry and technological advancements in vehicle electrification and automation. Opportunities exist for manufacturers to develop innovative, sustainable materials that meet the evolving demands of the market. Strategic partnerships and collaborations will be crucial for players seeking to expand their market reach and enhance their competitive positions. Focus on research and development will be essential to stay ahead in this dynamic market.
Automotive Wire and Cable Materials Market Segmentation
-
1. Product
- 1.1. Fiber Optic Cable
- 1.2. Coaxial Cable
- 1.3. Others
-
2. Polymer Type
- 2.1. Polyvinyl Chloride (PVC)
- 2.2. Thermoplastic Elastomer (TPE)
- 2.3. Thermoplastic Polyurethane (TPU)
- 2.4. Thermoplastic Olefin (TPO)
- 2.5. Others
-
3. End User Industry
- 3.1. Automotive
- 3.2. Construction
- 3.3. Electrical and Electronics
- 3.4. Health Care
- 3.5. Power
- 3.6. Telecommunication
- 3.7. Others
Automotive Wire and Cable Materials Market Segmentation By Geography
-
1. Asia Pacific
- 1.1. China
- 1.2. India
- 1.3. Japan
- 1.4. South Korea
- 1.5. Rest of Asia Pacific
-
2. North America
- 2.1. United States
- 2.2. Canada
- 2.3. Mexico
-
3. Europe
- 3.1. Germany
- 3.2. United Kingdom
- 3.3. France
- 3.4. Italy
- 3.5. Rest of Europe
-
4. South America
- 4.1. Brazil
- 4.2. Argentina
- 4.3. Rest of South America
-
5. Middle East and Africa
- 5.1. Saudi Arabia
- 5.2. South Africa
- 5.3. Rest of Middle East and Africa
Automotive Wire and Cable Materials Market REPORT HIGHLIGHTS
| Aspects | Details |
|---|---|
| Study Period | 2019-2033 |
| Base Year | 2024 |
| Estimated Year | 2025 |
| Forecast Period | 2025-2033 |
| Historical Period | 2019-2024 |
| Growth Rate | CAGR of 5.00% from 2019-2033 |
| Segmentation |
|
Table of Contents
- 1. Introduction
- 1.1. Research Scope
- 1.2. Market Segmentation
- 1.3. Research Methodology
- 1.4. Definitions and Assumptions
- 2. Executive Summary
- 2.1. Introduction
- 3. Market Dynamics
- 3.1. Introduction
- 3.2. Market Drivers
- 3.2.1. ; Growing Demand from Power Generation and Transmission Segment; Rising Construction Industry
- 3.3. Market Restrains
- 3.3.1. ; Health Hazard related to Wire and Cable Compounds; Other Restraints
- 3.4. Market Trends
- 3.4.1. Power Industry to Dominate the Market
- 4. Market Factor Analysis
- 4.1. Porters Five Forces
- 4.2. Supply/Value Chain
- 4.3. PESTEL analysis
- 4.4. Market Entropy
- 4.5. Patent/Trademark Analysis
- 5. Global Automotive Wire and Cable Materials Market Analysis, Insights and Forecast, 2019-2031
- 5.1. Market Analysis, Insights and Forecast - by Product
- 5.1.1. Fiber Optic Cable
- 5.1.2. Coaxial Cable
- 5.1.3. Others
- 5.2. Market Analysis, Insights and Forecast - by Polymer Type
- 5.2.1. Polyvinyl Chloride (PVC)
- 5.2.2. Thermoplastic Elastomer (TPE)
- 5.2.3. Thermoplastic Polyurethane (TPU)
- 5.2.4. Thermoplastic Olefin (TPO)
- 5.2.5. Others
- 5.3. Market Analysis, Insights and Forecast - by End User Industry
- 5.3.1. Automotive
- 5.3.2. Construction
- 5.3.3. Electrical and Electronics
- 5.3.4. Health Care
- 5.3.5. Power
- 5.3.6. Telecommunication
- 5.3.7. Others
- 5.4. Market Analysis, Insights and Forecast - by Region
- 5.4.1. Asia Pacific
- 5.4.2. North America
- 5.4.3. Europe
- 5.4.4. South America
- 5.4.5. Middle East and Africa
- 5.1. Market Analysis, Insights and Forecast - by Product
- 6. Asia Pacific Automotive Wire and Cable Materials Market Analysis, Insights and Forecast, 2019-2031
- 6.1. Market Analysis, Insights and Forecast - by Product
- 6.1.1. Fiber Optic Cable
- 6.1.2. Coaxial Cable
- 6.1.3. Others
- 6.2. Market Analysis, Insights and Forecast - by Polymer Type
- 6.2.1. Polyvinyl Chloride (PVC)
- 6.2.2. Thermoplastic Elastomer (TPE)
- 6.2.3. Thermoplastic Polyurethane (TPU)
- 6.2.4. Thermoplastic Olefin (TPO)
- 6.2.5. Others
- 6.3. Market Analysis, Insights and Forecast - by End User Industry
- 6.3.1. Automotive
- 6.3.2. Construction
- 6.3.3. Electrical and Electronics
- 6.3.4. Health Care
- 6.3.5. Power
- 6.3.6. Telecommunication
- 6.3.7. Others
- 6.1. Market Analysis, Insights and Forecast - by Product
- 7. North America Automotive Wire and Cable Materials Market Analysis, Insights and Forecast, 2019-2031
- 7.1. Market Analysis, Insights and Forecast - by Product
- 7.1.1. Fiber Optic Cable
- 7.1.2. Coaxial Cable
- 7.1.3. Others
- 7.2. Market Analysis, Insights and Forecast - by Polymer Type
- 7.2.1. Polyvinyl Chloride (PVC)
- 7.2.2. Thermoplastic Elastomer (TPE)
- 7.2.3. Thermoplastic Polyurethane (TPU)
- 7.2.4. Thermoplastic Olefin (TPO)
- 7.2.5. Others
- 7.3. Market Analysis, Insights and Forecast - by End User Industry
- 7.3.1. Automotive
- 7.3.2. Construction
- 7.3.3. Electrical and Electronics
- 7.3.4. Health Care
- 7.3.5. Power
- 7.3.6. Telecommunication
- 7.3.7. Others
- 7.1. Market Analysis, Insights and Forecast - by Product
- 8. Europe Automotive Wire and Cable Materials Market Analysis, Insights and Forecast, 2019-2031
- 8.1. Market Analysis, Insights and Forecast - by Product
- 8.1.1. Fiber Optic Cable
- 8.1.2. Coaxial Cable
- 8.1.3. Others
- 8.2. Market Analysis, Insights and Forecast - by Polymer Type
- 8.2.1. Polyvinyl Chloride (PVC)
- 8.2.2. Thermoplastic Elastomer (TPE)
- 8.2.3. Thermoplastic Polyurethane (TPU)
- 8.2.4. Thermoplastic Olefin (TPO)
- 8.2.5. Others
- 8.3. Market Analysis, Insights and Forecast - by End User Industry
- 8.3.1. Automotive
- 8.3.2. Construction
- 8.3.3. Electrical and Electronics
- 8.3.4. Health Care
- 8.3.5. Power
- 8.3.6. Telecommunication
- 8.3.7. Others
- 8.1. Market Analysis, Insights and Forecast - by Product
- 9. South America Automotive Wire and Cable Materials Market Analysis, Insights and Forecast, 2019-2031
- 9.1. Market Analysis, Insights and Forecast - by Product
- 9.1.1. Fiber Optic Cable
- 9.1.2. Coaxial Cable
- 9.1.3. Others
- 9.2. Market Analysis, Insights and Forecast - by Polymer Type
- 9.2.1. Polyvinyl Chloride (PVC)
- 9.2.2. Thermoplastic Elastomer (TPE)
- 9.2.3. Thermoplastic Polyurethane (TPU)
- 9.2.4. Thermoplastic Olefin (TPO)
- 9.2.5. Others
- 9.3. Market Analysis, Insights and Forecast - by End User Industry
- 9.3.1. Automotive
- 9.3.2. Construction
- 9.3.3. Electrical and Electronics
- 9.3.4. Health Care
- 9.3.5. Power
- 9.3.6. Telecommunication
- 9.3.7. Others
- 9.1. Market Analysis, Insights and Forecast - by Product
- 10. Middle East and Africa Automotive Wire and Cable Materials Market Analysis, Insights and Forecast, 2019-2031
- 10.1. Market Analysis, Insights and Forecast - by Product
- 10.1.1. Fiber Optic Cable
- 10.1.2. Coaxial Cable
- 10.1.3. Others
- 10.2. Market Analysis, Insights and Forecast - by Polymer Type
- 10.2.1. Polyvinyl Chloride (PVC)
- 10.2.2. Thermoplastic Elastomer (TPE)
- 10.2.3. Thermoplastic Polyurethane (TPU)
- 10.2.4. Thermoplastic Olefin (TPO)
- 10.2.5. Others
- 10.3. Market Analysis, Insights and Forecast - by End User Industry
- 10.3.1. Automotive
- 10.3.2. Construction
- 10.3.3. Electrical and Electronics
- 10.3.4. Health Care
- 10.3.5. Power
- 10.3.6. Telecommunication
- 10.3.7. Others
- 10.1. Market Analysis, Insights and Forecast - by Product
- 11. Asia Pacific Automotive Wire and Cable Materials Market Analysis, Insights and Forecast, 2019-2031
- 11.1. Market Analysis, Insights and Forecast - By Country/Sub-region
- 11.1.1 China
- 11.1.2 India
- 11.1.3 Japan
- 11.1.4 South Korea
- 11.1.5 Rest of Asia Pacific
- 12. North America Automotive Wire and Cable Materials Market Analysis, Insights and Forecast, 2019-2031
- 12.1. Market Analysis, Insights and Forecast - By Country/Sub-region
- 12.1.1 United States
- 12.1.2 Canada
- 12.1.3 Mexico
- 13. Europe Automotive Wire and Cable Materials Market Analysis, Insights and Forecast, 2019-2031
- 13.1. Market Analysis, Insights and Forecast - By Country/Sub-region
- 13.1.1 Germany
- 13.1.2 United Kingdom
- 13.1.3 France
- 13.1.4 Italy
- 13.1.5 Rest of Europe
- 14. South America Automotive Wire and Cable Materials Market Analysis, Insights and Forecast, 2019-2031
- 14.1. Market Analysis, Insights and Forecast - By Country/Sub-region
- 14.1.1 Brazil
- 14.1.2 Argentina
- 14.1.3 Rest of South America
- 15. Middle East and Africa Automotive Wire and Cable Materials Market Analysis, Insights and Forecast, 2019-2031
- 15.1. Market Analysis, Insights and Forecast - By Country/Sub-region
- 15.1.1 Saudi Arabia
- 15.1.2 South Africa
- 15.1.3 Rest of Middle East and Africa
- 16. Competitive Analysis
- 16.1. Global Market Share Analysis 2024
- 16.2. Company Profiles
- 16.2.1 Electric Cable Compounds Inc
- 16.2.1.1. Overview
- 16.2.1.2. Products
- 16.2.1.3. SWOT Analysis
- 16.2.1.4. Recent Developments
- 16.2.1.5. Financials (Based on Availability)
- 16.2.2 BUSS AG
- 16.2.2.1. Overview
- 16.2.2.2. Products
- 16.2.2.3. SWOT Analysis
- 16.2.2.4. Recent Developments
- 16.2.2.5. Financials (Based on Availability)
- 16.2.3 Solvay
- 16.2.3.1. Overview
- 16.2.3.2. Products
- 16.2.3.3. SWOT Analysis
- 16.2.3.4. Recent Developments
- 16.2.3.5. Financials (Based on Availability)
- 16.2.4 Melos GmbH
- 16.2.4.1. Overview
- 16.2.4.2. Products
- 16.2.4.3. SWOT Analysis
- 16.2.4.4. Recent Developments
- 16.2.4.5. Financials (Based on Availability)
- 16.2.5 Alphagary
- 16.2.5.1. Overview
- 16.2.5.2. Products
- 16.2.5.3. SWOT Analysis
- 16.2.5.4. Recent Developments
- 16.2.5.5. Financials (Based on Availability)
- 16.2.6 Cabot Corporation
- 16.2.6.1. Overview
- 16.2.6.2. Products
- 16.2.6.3. SWOT Analysis
- 16.2.6.4. Recent Developments
- 16.2.6.5. Financials (Based on Availability)
- 16.2.7 Relicab Cable Manufacturing Limited
- 16.2.7.1. Overview
- 16.2.7.2. Products
- 16.2.7.3. SWOT Analysis
- 16.2.7.4. Recent Developments
- 16.2.7.5. Financials (Based on Availability)
- 16.2.8 PVCL
- 16.2.8.1. Overview
- 16.2.8.2. Products
- 16.2.8.3. SWOT Analysis
- 16.2.8.4. Recent Developments
- 16.2.8.5. Financials (Based on Availability)
- 16.2.9 Trelleborg
- 16.2.9.1. Overview
- 16.2.9.2. Products
- 16.2.9.3. SWOT Analysis
- 16.2.9.4. Recent Developments
- 16.2.9.5. Financials (Based on Availability)
- 16.2.10 Chemceed
- 16.2.10.1. Overview
- 16.2.10.2. Products
- 16.2.10.3. SWOT Analysis
- 16.2.10.4. Recent Developments
- 16.2.10.5. Financials (Based on Availability)
- 16.2.11 Teknor Apex
- 16.2.11.1. Overview
- 16.2.11.2. Products
- 16.2.11.3. SWOT Analysis
- 16.2.11.4. Recent Developments
- 16.2.11.5. Financials (Based on Availability)
- 16.2.12 SCG Chemicals Co Ltd
- 16.2.12.1. Overview
- 16.2.12.2. Products
- 16.2.12.3. SWOT Analysis
- 16.2.12.4. Recent Developments
- 16.2.12.5. Financials (Based on Availability)
- 16.2.1 Electric Cable Compounds Inc
List of Figures
- Figure 1: Global Automotive Wire and Cable Materials Market Revenue Breakdown (Million, %) by Region 2024 & 2032
- Figure 2: Global Automotive Wire and Cable Materials Market Volume Breakdown (K Tons, %) by Region 2024 & 2032
- Figure 3: Asia Pacific Automotive Wire and Cable Materials Market Revenue (Million), by Country 2024 & 2032
- Figure 4: Asia Pacific Automotive Wire and Cable Materials Market Volume (K Tons), by Country 2024 & 2032
- Figure 5: Asia Pacific Automotive Wire and Cable Materials Market Revenue Share (%), by Country 2024 & 2032
- Figure 6: Asia Pacific Automotive Wire and Cable Materials Market Volume Share (%), by Country 2024 & 2032
- Figure 7: North America Automotive Wire and Cable Materials Market Revenue (Million), by Country 2024 & 2032
- Figure 8: North America Automotive Wire and Cable Materials Market Volume (K Tons), by Country 2024 & 2032
- Figure 9: North America Automotive Wire and Cable Materials Market Revenue Share (%), by Country 2024 & 2032
- Figure 10: North America Automotive Wire and Cable Materials Market Volume Share (%), by Country 2024 & 2032
- Figure 11: Europe Automotive Wire and Cable Materials Market Revenue (Million), by Country 2024 & 2032
- Figure 12: Europe Automotive Wire and Cable Materials Market Volume (K Tons), by Country 2024 & 2032
- Figure 13: Europe Automotive Wire and Cable Materials Market Revenue Share (%), by Country 2024 & 2032
- Figure 14: Europe Automotive Wire and Cable Materials Market Volume Share (%), by Country 2024 & 2032
- Figure 15: South America Automotive Wire and Cable Materials Market Revenue (Million), by Country 2024 & 2032
- Figure 16: South America Automotive Wire and Cable Materials Market Volume (K Tons), by Country 2024 & 2032
- Figure 17: South America Automotive Wire and Cable Materials Market Revenue Share (%), by Country 2024 & 2032
- Figure 18: South America Automotive Wire and Cable Materials Market Volume Share (%), by Country 2024 & 2032
- Figure 19: Middle East and Africa Automotive Wire and Cable Materials Market Revenue (Million), by Country 2024 & 2032
- Figure 20: Middle East and Africa Automotive Wire and Cable Materials Market Volume (K Tons), by Country 2024 & 2032
- Figure 21: Middle East and Africa Automotive Wire and Cable Materials Market Revenue Share (%), by Country 2024 & 2032
- Figure 22: Middle East and Africa Automotive Wire and Cable Materials Market Volume Share (%), by Country 2024 & 2032
- Figure 23: Asia Pacific Automotive Wire and Cable Materials Market Revenue (Million), by Product 2024 & 2032
- Figure 24: Asia Pacific Automotive Wire and Cable Materials Market Volume (K Tons), by Product 2024 & 2032
- Figure 25: Asia Pacific Automotive Wire and Cable Materials Market Revenue Share (%), by Product 2024 & 2032
- Figure 26: Asia Pacific Automotive Wire and Cable Materials Market Volume Share (%), by Product 2024 & 2032
- Figure 27: Asia Pacific Automotive Wire and Cable Materials Market Revenue (Million), by Polymer Type 2024 & 2032
- Figure 28: Asia Pacific Automotive Wire and Cable Materials Market Volume (K Tons), by Polymer Type 2024 & 2032
- Figure 29: Asia Pacific Automotive Wire and Cable Materials Market Revenue Share (%), by Polymer Type 2024 & 2032
- Figure 30: Asia Pacific Automotive Wire and Cable Materials Market Volume Share (%), by Polymer Type 2024 & 2032
- Figure 31: Asia Pacific Automotive Wire and Cable Materials Market Revenue (Million), by End User Industry 2024 & 2032
- Figure 32: Asia Pacific Automotive Wire and Cable Materials Market Volume (K Tons), by End User Industry 2024 & 2032
- Figure 33: Asia Pacific Automotive Wire and Cable Materials Market Revenue Share (%), by End User Industry 2024 & 2032
- Figure 34: Asia Pacific Automotive Wire and Cable Materials Market Volume Share (%), by End User Industry 2024 & 2032
- Figure 35: Asia Pacific Automotive Wire and Cable Materials Market Revenue (Million), by Country 2024 & 2032
- Figure 36: Asia Pacific Automotive Wire and Cable Materials Market Volume (K Tons), by Country 2024 & 2032
- Figure 37: Asia Pacific Automotive Wire and Cable Materials Market Revenue Share (%), by Country 2024 & 2032
- Figure 38: Asia Pacific Automotive Wire and Cable Materials Market Volume Share (%), by Country 2024 & 2032
- Figure 39: North America Automotive Wire and Cable Materials Market Revenue (Million), by Product 2024 & 2032
- Figure 40: North America Automotive Wire and Cable Materials Market Volume (K Tons), by Product 2024 & 2032
- Figure 41: North America Automotive Wire and Cable Materials Market Revenue Share (%), by Product 2024 & 2032
- Figure 42: North America Automotive Wire and Cable Materials Market Volume Share (%), by Product 2024 & 2032
- Figure 43: North America Automotive Wire and Cable Materials Market Revenue (Million), by Polymer Type 2024 & 2032
- Figure 44: North America Automotive Wire and Cable Materials Market Volume (K Tons), by Polymer Type 2024 & 2032
- Figure 45: North America Automotive Wire and Cable Materials Market Revenue Share (%), by Polymer Type 2024 & 2032
- Figure 46: North America Automotive Wire and Cable Materials Market Volume Share (%), by Polymer Type 2024 & 2032
- Figure 47: North America Automotive Wire and Cable Materials Market Revenue (Million), by End User Industry 2024 & 2032
- Figure 48: North America Automotive Wire and Cable Materials Market Volume (K Tons), by End User Industry 2024 & 2032
- Figure 49: North America Automotive Wire and Cable Materials Market Revenue Share (%), by End User Industry 2024 & 2032
- Figure 50: North America Automotive Wire and Cable Materials Market Volume Share (%), by End User Industry 2024 & 2032
- Figure 51: North America Automotive Wire and Cable Materials Market Revenue (Million), by Country 2024 & 2032
- Figure 52: North America Automotive Wire and Cable Materials Market Volume (K Tons), by Country 2024 & 2032
- Figure 53: North America Automotive Wire and Cable Materials Market Revenue Share (%), by Country 2024 & 2032
- Figure 54: North America Automotive Wire and Cable Materials Market Volume Share (%), by Country 2024 & 2032
- Figure 55: Europe Automotive Wire and Cable Materials Market Revenue (Million), by Product 2024 & 2032
- Figure 56: Europe Automotive Wire and Cable Materials Market Volume (K Tons), by Product 2024 & 2032
- Figure 57: Europe Automotive Wire and Cable Materials Market Revenue Share (%), by Product 2024 & 2032
- Figure 58: Europe Automotive Wire and Cable Materials Market Volume Share (%), by Product 2024 & 2032
- Figure 59: Europe Automotive Wire and Cable Materials Market Revenue (Million), by Polymer Type 2024 & 2032
- Figure 60: Europe Automotive Wire and Cable Materials Market Volume (K Tons), by Polymer Type 2024 & 2032
- Figure 61: Europe Automotive Wire and Cable Materials Market Revenue Share (%), by Polymer Type 2024 & 2032
- Figure 62: Europe Automotive Wire and Cable Materials Market Volume Share (%), by Polymer Type 2024 & 2032
- Figure 63: Europe Automotive Wire and Cable Materials Market Revenue (Million), by End User Industry 2024 & 2032
- Figure 64: Europe Automotive Wire and Cable Materials Market Volume (K Tons), by End User Industry 2024 & 2032
- Figure 65: Europe Automotive Wire and Cable Materials Market Revenue Share (%), by End User Industry 2024 & 2032
- Figure 66: Europe Automotive Wire and Cable Materials Market Volume Share (%), by End User Industry 2024 & 2032
- Figure 67: Europe Automotive Wire and Cable Materials Market Revenue (Million), by Country 2024 & 2032
- Figure 68: Europe Automotive Wire and Cable Materials Market Volume (K Tons), by Country 2024 & 2032
- Figure 69: Europe Automotive Wire and Cable Materials Market Revenue Share (%), by Country 2024 & 2032
- Figure 70: Europe Automotive Wire and Cable Materials Market Volume Share (%), by Country 2024 & 2032
- Figure 71: South America Automotive Wire and Cable Materials Market Revenue (Million), by Product 2024 & 2032
- Figure 72: South America Automotive Wire and Cable Materials Market Volume (K Tons), by Product 2024 & 2032
- Figure 73: South America Automotive Wire and Cable Materials Market Revenue Share (%), by Product 2024 & 2032
- Figure 74: South America Automotive Wire and Cable Materials Market Volume Share (%), by Product 2024 & 2032
- Figure 75: South America Automotive Wire and Cable Materials Market Revenue (Million), by Polymer Type 2024 & 2032
- Figure 76: South America Automotive Wire and Cable Materials Market Volume (K Tons), by Polymer Type 2024 & 2032
- Figure 77: South America Automotive Wire and Cable Materials Market Revenue Share (%), by Polymer Type 2024 & 2032
- Figure 78: South America Automotive Wire and Cable Materials Market Volume Share (%), by Polymer Type 2024 & 2032
- Figure 79: South America Automotive Wire and Cable Materials Market Revenue (Million), by End User Industry 2024 & 2032
- Figure 80: South America Automotive Wire and Cable Materials Market Volume (K Tons), by End User Industry 2024 & 2032
- Figure 81: South America Automotive Wire and Cable Materials Market Revenue Share (%), by End User Industry 2024 & 2032
- Figure 82: South America Automotive Wire and Cable Materials Market Volume Share (%), by End User Industry 2024 & 2032
- Figure 83: South America Automotive Wire and Cable Materials Market Revenue (Million), by Country 2024 & 2032
- Figure 84: South America Automotive Wire and Cable Materials Market Volume (K Tons), by Country 2024 & 2032
- Figure 85: South America Automotive Wire and Cable Materials Market Revenue Share (%), by Country 2024 & 2032
- Figure 86: South America Automotive Wire and Cable Materials Market Volume Share (%), by Country 2024 & 2032
- Figure 87: Middle East and Africa Automotive Wire and Cable Materials Market Revenue (Million), by Product 2024 & 2032
- Figure 88: Middle East and Africa Automotive Wire and Cable Materials Market Volume (K Tons), by Product 2024 & 2032
- Figure 89: Middle East and Africa Automotive Wire and Cable Materials Market Revenue Share (%), by Product 2024 & 2032
- Figure 90: Middle East and Africa Automotive Wire and Cable Materials Market Volume Share (%), by Product 2024 & 2032
- Figure 91: Middle East and Africa Automotive Wire and Cable Materials Market Revenue (Million), by Polymer Type 2024 & 2032
- Figure 92: Middle East and Africa Automotive Wire and Cable Materials Market Volume (K Tons), by Polymer Type 2024 & 2032
- Figure 93: Middle East and Africa Automotive Wire and Cable Materials Market Revenue Share (%), by Polymer Type 2024 & 2032
- Figure 94: Middle East and Africa Automotive Wire and Cable Materials Market Volume Share (%), by Polymer Type 2024 & 2032
- Figure 95: Middle East and Africa Automotive Wire and Cable Materials Market Revenue (Million), by End User Industry 2024 & 2032
- Figure 96: Middle East and Africa Automotive Wire and Cable Materials Market Volume (K Tons), by End User Industry 2024 & 2032
- Figure 97: Middle East and Africa Automotive Wire and Cable Materials Market Revenue Share (%), by End User Industry 2024 & 2032
- Figure 98: Middle East and Africa Automotive Wire and Cable Materials Market Volume Share (%), by End User Industry 2024 & 2032
- Figure 99: Middle East and Africa Automotive Wire and Cable Materials Market Revenue (Million), by Country 2024 & 2032
- Figure 100: Middle East and Africa Automotive Wire and Cable Materials Market Volume (K Tons), by Country 2024 & 2032
- Figure 101: Middle East and Africa Automotive Wire and Cable Materials Market Revenue Share (%), by Country 2024 & 2032
- Figure 102: Middle East and Africa Automotive Wire and Cable Materials Market Volume Share (%), by Country 2024 & 2032
List of Tables
- Table 1: Global Automotive Wire and Cable Materials Market Revenue Million Forecast, by Region 2019 & 2032
- Table 2: Global Automotive Wire and Cable Materials Market Volume K Tons Forecast, by Region 2019 & 2032
- Table 3: Global Automotive Wire and Cable Materials Market Revenue Million Forecast, by Product 2019 & 2032
- Table 4: Global Automotive Wire and Cable Materials Market Volume K Tons Forecast, by Product 2019 & 2032
- Table 5: Global Automotive Wire and Cable Materials Market Revenue Million Forecast, by Polymer Type 2019 & 2032
- Table 6: Global Automotive Wire and Cable Materials Market Volume K Tons Forecast, by Polymer Type 2019 & 2032
- Table 7: Global Automotive Wire and Cable Materials Market Revenue Million Forecast, by End User Industry 2019 & 2032
- Table 8: Global Automotive Wire and Cable Materials Market Volume K Tons Forecast, by End User Industry 2019 & 2032
- Table 9: Global Automotive Wire and Cable Materials Market Revenue Million Forecast, by Region 2019 & 2032
- Table 10: Global Automotive Wire and Cable Materials Market Volume K Tons Forecast, by Region 2019 & 2032
- Table 11: Global Automotive Wire and Cable Materials Market Revenue Million Forecast, by Country 2019 & 2032
- Table 12: Global Automotive Wire and Cable Materials Market Volume K Tons Forecast, by Country 2019 & 2032
- Table 13: China Automotive Wire and Cable Materials Market Revenue (Million) Forecast, by Application 2019 & 2032
- Table 14: China Automotive Wire and Cable Materials Market Volume (K Tons) Forecast, by Application 2019 & 2032
- Table 15: India Automotive Wire and Cable Materials Market Revenue (Million) Forecast, by Application 2019 & 2032
- Table 16: India Automotive Wire and Cable Materials Market Volume (K Tons) Forecast, by Application 2019 & 2032
- Table 17: Japan Automotive Wire and Cable Materials Market Revenue (Million) Forecast, by Application 2019 & 2032
- Table 18: Japan Automotive Wire and Cable Materials Market Volume (K Tons) Forecast, by Application 2019 & 2032
- Table 19: South Korea Automotive Wire and Cable Materials Market Revenue (Million) Forecast, by Application 2019 & 2032
- Table 20: South Korea Automotive Wire and Cable Materials Market Volume (K Tons) Forecast, by Application 2019 & 2032
- Table 21: Rest of Asia Pacific Automotive Wire and Cable Materials Market Revenue (Million) Forecast, by Application 2019 & 2032
- Table 22: Rest of Asia Pacific Automotive Wire and Cable Materials Market Volume (K Tons) Forecast, by Application 2019 & 2032
- Table 23: Global Automotive Wire and Cable Materials Market Revenue Million Forecast, by Country 2019 & 2032
- Table 24: Global Automotive Wire and Cable Materials Market Volume K Tons Forecast, by Country 2019 & 2032
- Table 25: United States Automotive Wire and Cable Materials Market Revenue (Million) Forecast, by Application 2019 & 2032
- Table 26: United States Automotive Wire and Cable Materials Market Volume (K Tons) Forecast, by Application 2019 & 2032
- Table 27: Canada Automotive Wire and Cable Materials Market Revenue (Million) Forecast, by Application 2019 & 2032
- Table 28: Canada Automotive Wire and Cable Materials Market Volume (K Tons) Forecast, by Application 2019 & 2032
- Table 29: Mexico Automotive Wire and Cable Materials Market Revenue (Million) Forecast, by Application 2019 & 2032
- Table 30: Mexico Automotive Wire and Cable Materials Market Volume (K Tons) Forecast, by Application 2019 & 2032
- Table 31: Global Automotive Wire and Cable Materials Market Revenue Million Forecast, by Country 2019 & 2032
- Table 32: Global Automotive Wire and Cable Materials Market Volume K Tons Forecast, by Country 2019 & 2032
- Table 33: Germany Automotive Wire and Cable Materials Market Revenue (Million) Forecast, by Application 2019 & 2032
- Table 34: Germany Automotive Wire and Cable Materials Market Volume (K Tons) Forecast, by Application 2019 & 2032
- Table 35: United Kingdom Automotive Wire and Cable Materials Market Revenue (Million) Forecast, by Application 2019 & 2032
- Table 36: United Kingdom Automotive Wire and Cable Materials Market Volume (K Tons) Forecast, by Application 2019 & 2032
- Table 37: France Automotive Wire and Cable Materials Market Revenue (Million) Forecast, by Application 2019 & 2032
- Table 38: France Automotive Wire and Cable Materials Market Volume (K Tons) Forecast, by Application 2019 & 2032
- Table 39: Italy Automotive Wire and Cable Materials Market Revenue (Million) Forecast, by Application 2019 & 2032
- Table 40: Italy Automotive Wire and Cable Materials Market Volume (K Tons) Forecast, by Application 2019 & 2032
- Table 41: Rest of Europe Automotive Wire and Cable Materials Market Revenue (Million) Forecast, by Application 2019 & 2032
- Table 42: Rest of Europe Automotive Wire and Cable Materials Market Volume (K Tons) Forecast, by Application 2019 & 2032
- Table 43: Global Automotive Wire and Cable Materials Market Revenue Million Forecast, by Country 2019 & 2032
- Table 44: Global Automotive Wire and Cable Materials Market Volume K Tons Forecast, by Country 2019 & 2032
- Table 45: Brazil Automotive Wire and Cable Materials Market Revenue (Million) Forecast, by Application 2019 & 2032
- Table 46: Brazil Automotive Wire and Cable Materials Market Volume (K Tons) Forecast, by Application 2019 & 2032
- Table 47: Argentina Automotive Wire and Cable Materials Market Revenue (Million) Forecast, by Application 2019 & 2032
- Table 48: Argentina Automotive Wire and Cable Materials Market Volume (K Tons) Forecast, by Application 2019 & 2032
- Table 49: Rest of South America Automotive Wire and Cable Materials Market Revenue (Million) Forecast, by Application 2019 & 2032
- Table 50: Rest of South America Automotive Wire and Cable Materials Market Volume (K Tons) Forecast, by Application 2019 & 2032
- Table 51: Global Automotive Wire and Cable Materials Market Revenue Million Forecast, by Country 2019 & 2032
- Table 52: Global Automotive Wire and Cable Materials Market Volume K Tons Forecast, by Country 2019 & 2032
- Table 53: Saudi Arabia Automotive Wire and Cable Materials Market Revenue (Million) Forecast, by Application 2019 & 2032
- Table 54: Saudi Arabia Automotive Wire and Cable Materials Market Volume (K Tons) Forecast, by Application 2019 & 2032
- Table 55: South Africa Automotive Wire and Cable Materials Market Revenue (Million) Forecast, by Application 2019 & 2032
- Table 56: South Africa Automotive Wire and Cable Materials Market Volume (K Tons) Forecast, by Application 2019 & 2032
- Table 57: Rest of Middle East and Africa Automotive Wire and Cable Materials Market Revenue (Million) Forecast, by Application 2019 & 2032
- Table 58: Rest of Middle East and Africa Automotive Wire and Cable Materials Market Volume (K Tons) Forecast, by Application 2019 & 2032
- Table 59: Global Automotive Wire and Cable Materials Market Revenue Million Forecast, by Product 2019 & 2032
- Table 60: Global Automotive Wire and Cable Materials Market Volume K Tons Forecast, by Product 2019 & 2032
- Table 61: Global Automotive Wire and Cable Materials Market Revenue Million Forecast, by Polymer Type 2019 & 2032
- Table 62: Global Automotive Wire and Cable Materials Market Volume K Tons Forecast, by Polymer Type 2019 & 2032
- Table 63: Global Automotive Wire and Cable Materials Market Revenue Million Forecast, by End User Industry 2019 & 2032
- Table 64: Global Automotive Wire and Cable Materials Market Volume K Tons Forecast, by End User Industry 2019 & 2032
- Table 65: Global Automotive Wire and Cable Materials Market Revenue Million Forecast, by Country 2019 & 2032
- Table 66: Global Automotive Wire and Cable Materials Market Volume K Tons Forecast, by Country 2019 & 2032
- Table 67: China Automotive Wire and Cable Materials Market Revenue (Million) Forecast, by Application 2019 & 2032
- Table 68: China Automotive Wire and Cable Materials Market Volume (K Tons) Forecast, by Application 2019 & 2032
- Table 69: India Automotive Wire and Cable Materials Market Revenue (Million) Forecast, by Application 2019 & 2032
- Table 70: India Automotive Wire and Cable Materials Market Volume (K Tons) Forecast, by Application 2019 & 2032
- Table 71: Japan Automotive Wire and Cable Materials Market Revenue (Million) Forecast, by Application 2019 & 2032
- Table 72: Japan Automotive Wire and Cable Materials Market Volume (K Tons) Forecast, by Application 2019 & 2032
- Table 73: South Korea Automotive Wire and Cable Materials Market Revenue (Million) Forecast, by Application 2019 & 2032
- Table 74: South Korea Automotive Wire and Cable Materials Market Volume (K Tons) Forecast, by Application 2019 & 2032
- Table 75: Rest of Asia Pacific Automotive Wire and Cable Materials Market Revenue (Million) Forecast, by Application 2019 & 2032
- Table 76: Rest of Asia Pacific Automotive Wire and Cable Materials Market Volume (K Tons) Forecast, by Application 2019 & 2032
- Table 77: Global Automotive Wire and Cable Materials Market Revenue Million Forecast, by Product 2019 & 2032
- Table 78: Global Automotive Wire and Cable Materials Market Volume K Tons Forecast, by Product 2019 & 2032
- Table 79: Global Automotive Wire and Cable Materials Market Revenue Million Forecast, by Polymer Type 2019 & 2032
- Table 80: Global Automotive Wire and Cable Materials Market Volume K Tons Forecast, by Polymer Type 2019 & 2032
- Table 81: Global Automotive Wire and Cable Materials Market Revenue Million Forecast, by End User Industry 2019 & 2032
- Table 82: Global Automotive Wire and Cable Materials Market Volume K Tons Forecast, by End User Industry 2019 & 2032
- Table 83: Global Automotive Wire and Cable Materials Market Revenue Million Forecast, by Country 2019 & 2032
- Table 84: Global Automotive Wire and Cable Materials Market Volume K Tons Forecast, by Country 2019 & 2032
- Table 85: United States Automotive Wire and Cable Materials Market Revenue (Million) Forecast, by Application 2019 & 2032
- Table 86: United States Automotive Wire and Cable Materials Market Volume (K Tons) Forecast, by Application 2019 & 2032
- Table 87: Canada Automotive Wire and Cable Materials Market Revenue (Million) Forecast, by Application 2019 & 2032
- Table 88: Canada Automotive Wire and Cable Materials Market Volume (K Tons) Forecast, by Application 2019 & 2032
- Table 89: Mexico Automotive Wire and Cable Materials Market Revenue (Million) Forecast, by Application 2019 & 2032
- Table 90: Mexico Automotive Wire and Cable Materials Market Volume (K Tons) Forecast, by Application 2019 & 2032
- Table 91: Global Automotive Wire and Cable Materials Market Revenue Million Forecast, by Product 2019 & 2032
- Table 92: Global Automotive Wire and Cable Materials Market Volume K Tons Forecast, by Product 2019 & 2032
- Table 93: Global Automotive Wire and Cable Materials Market Revenue Million Forecast, by Polymer Type 2019 & 2032
- Table 94: Global Automotive Wire and Cable Materials Market Volume K Tons Forecast, by Polymer Type 2019 & 2032
- Table 95: Global Automotive Wire and Cable Materials Market Revenue Million Forecast, by End User Industry 2019 & 2032
- Table 96: Global Automotive Wire and Cable Materials Market Volume K Tons Forecast, by End User Industry 2019 & 2032
- Table 97: Global Automotive Wire and Cable Materials Market Revenue Million Forecast, by Country 2019 & 2032
- Table 98: Global Automotive Wire and Cable Materials Market Volume K Tons Forecast, by Country 2019 & 2032
- Table 99: Germany Automotive Wire and Cable Materials Market Revenue (Million) Forecast, by Application 2019 & 2032
- Table 100: Germany Automotive Wire and Cable Materials Market Volume (K Tons) Forecast, by Application 2019 & 2032
- Table 101: United Kingdom Automotive Wire and Cable Materials Market Revenue (Million) Forecast, by Application 2019 & 2032
- Table 102: United Kingdom Automotive Wire and Cable Materials Market Volume (K Tons) Forecast, by Application 2019 & 2032
- Table 103: France Automotive Wire and Cable Materials Market Revenue (Million) Forecast, by Application 2019 & 2032
- Table 104: France Automotive Wire and Cable Materials Market Volume (K Tons) Forecast, by Application 2019 & 2032
- Table 105: Italy Automotive Wire and Cable Materials Market Revenue (Million) Forecast, by Application 2019 & 2032
- Table 106: Italy Automotive Wire and Cable Materials Market Volume (K Tons) Forecast, by Application 2019 & 2032
- Table 107: Rest of Europe Automotive Wire and Cable Materials Market Revenue (Million) Forecast, by Application 2019 & 2032
- Table 108: Rest of Europe Automotive Wire and Cable Materials Market Volume (K Tons) Forecast, by Application 2019 & 2032
- Table 109: Global Automotive Wire and Cable Materials Market Revenue Million Forecast, by Product 2019 & 2032
- Table 110: Global Automotive Wire and Cable Materials Market Volume K Tons Forecast, by Product 2019 & 2032
- Table 111: Global Automotive Wire and Cable Materials Market Revenue Million Forecast, by Polymer Type 2019 & 2032
- Table 112: Global Automotive Wire and Cable Materials Market Volume K Tons Forecast, by Polymer Type 2019 & 2032
- Table 113: Global Automotive Wire and Cable Materials Market Revenue Million Forecast, by End User Industry 2019 & 2032
- Table 114: Global Automotive Wire and Cable Materials Market Volume K Tons Forecast, by End User Industry 2019 & 2032
- Table 115: Global Automotive Wire and Cable Materials Market Revenue Million Forecast, by Country 2019 & 2032
- Table 116: Global Automotive Wire and Cable Materials Market Volume K Tons Forecast, by Country 2019 & 2032
- Table 117: Brazil Automotive Wire and Cable Materials Market Revenue (Million) Forecast, by Application 2019 & 2032
- Table 118: Brazil Automotive Wire and Cable Materials Market Volume (K Tons) Forecast, by Application 2019 & 2032
- Table 119: Argentina Automotive Wire and Cable Materials Market Revenue (Million) Forecast, by Application 2019 & 2032
- Table 120: Argentina Automotive Wire and Cable Materials Market Volume (K Tons) Forecast, by Application 2019 & 2032
- Table 121: Rest of South America Automotive Wire and Cable Materials Market Revenue (Million) Forecast, by Application 2019 & 2032
- Table 122: Rest of South America Automotive Wire and Cable Materials Market Volume (K Tons) Forecast, by Application 2019 & 2032
- Table 123: Global Automotive Wire and Cable Materials Market Revenue Million Forecast, by Product 2019 & 2032
- Table 124: Global Automotive Wire and Cable Materials Market Volume K Tons Forecast, by Product 2019 & 2032
- Table 125: Global Automotive Wire and Cable Materials Market Revenue Million Forecast, by Polymer Type 2019 & 2032
- Table 126: Global Automotive Wire and Cable Materials Market Volume K Tons Forecast, by Polymer Type 2019 & 2032
- Table 127: Global Automotive Wire and Cable Materials Market Revenue Million Forecast, by End User Industry 2019 & 2032
- Table 128: Global Automotive Wire and Cable Materials Market Volume K Tons Forecast, by End User Industry 2019 & 2032
- Table 129: Global Automotive Wire and Cable Materials Market Revenue Million Forecast, by Country 2019 & 2032
- Table 130: Global Automotive Wire and Cable Materials Market Volume K Tons Forecast, by Country 2019 & 2032
- Table 131: Saudi Arabia Automotive Wire and Cable Materials Market Revenue (Million) Forecast, by Application 2019 & 2032
- Table 132: Saudi Arabia Automotive Wire and Cable Materials Market Volume (K Tons) Forecast, by Application 2019 & 2032
- Table 133: South Africa Automotive Wire and Cable Materials Market Revenue (Million) Forecast, by Application 2019 & 2032
- Table 134: South Africa Automotive Wire and Cable Materials Market Volume (K Tons) Forecast, by Application 2019 & 2032
- Table 135: Rest of Middle East and Africa Automotive Wire and Cable Materials Market Revenue (Million) Forecast, by Application 2019 & 2032
- Table 136: Rest of Middle East and Africa Automotive Wire and Cable Materials Market Volume (K Tons) Forecast, by Application 2019 & 2032
Frequently Asked Questions
1. What is the projected Compound Annual Growth Rate (CAGR) of the Automotive Wire and Cable Materials Market?
The projected CAGR is approximately 5.00%.
2. Which companies are prominent players in the Automotive Wire and Cable Materials Market?
Key companies in the market include Electric Cable Compounds Inc, BUSS AG, Solvay, Melos GmbH, Alphagary, Cabot Corporation, Relicab Cable Manufacturing Limited, PVCL, Trelleborg, Chemceed, Teknor Apex, SCG Chemicals Co Ltd.
3. What are the main segments of the Automotive Wire and Cable Materials Market?
The market segments include Product, Polymer Type, End User Industry.
4. Can you provide details about the market size?
The market size is estimated to be USD XX Million as of 2022.
5. What are some drivers contributing to market growth?
; Growing Demand from Power Generation and Transmission Segment; Rising Construction Industry.
6. What are the notable trends driving market growth?
Power Industry to Dominate the Market.
7. Are there any restraints impacting market growth?
; Health Hazard related to Wire and Cable Compounds; Other Restraints.
8. Can you provide examples of recent developments in the market?
N/A
9. What pricing options are available for accessing the report?
Pricing options include single-user, multi-user, and enterprise licenses priced at USD 4750, USD 5250, and USD 8750 respectively.
10. Is the market size provided in terms of value or volume?
The market size is provided in terms of value, measured in Million and volume, measured in K Tons.
11. Are there any specific market keywords associated with the report?
Yes, the market keyword associated with the report is "Automotive Wire and Cable Materials Market," which aids in identifying and referencing the specific market segment covered.
12. How do I determine which pricing option suits my needs best?
The pricing options vary based on user requirements and access needs. Individual users may opt for single-user licenses, while businesses requiring broader access may choose multi-user or enterprise licenses for cost-effective access to the report.
13. Are there any additional resources or data provided in the Automotive Wire and Cable Materials Market report?
While the report offers comprehensive insights, it's advisable to review the specific contents or supplementary materials provided to ascertain if additional resources or data are available.
14. How can I stay updated on further developments or reports in the Automotive Wire and Cable Materials Market?
To stay informed about further developments, trends, and reports in the Automotive Wire and Cable Materials Market, consider subscribing to industry newsletters, following relevant companies and organizations, or regularly checking reputable industry news sources and publications.
Methodology
Step 1 - Identification of Relevant Samples Size from Population Database


Step 2 - Approaches for Defining Global Market Size (Value, Volume* & Price*)

Note*: In applicable scenarios
Step 3 - Data Sources
Primary Research
- Web Analytics
- Survey Reports
- Research Institute
- Latest Research Reports
- Opinion Leaders
Secondary Research
- Annual Reports
- White Paper
- Latest Press Release
- Industry Association
- Paid Database
- Investor Presentations

Step 4 - Data Triangulation
Involves using different sources of information in order to increase the validity of a study
These sources are likely to be stakeholders in a program - participants, other researchers, program staff, other community members, and so on.
Then we put all data in single framework & apply various statistical tools to find out the dynamic on the market.
During the analysis stage, feedback from the stakeholder groups would be compared to determine areas of agreement as well as areas of divergence


