

Key Insights
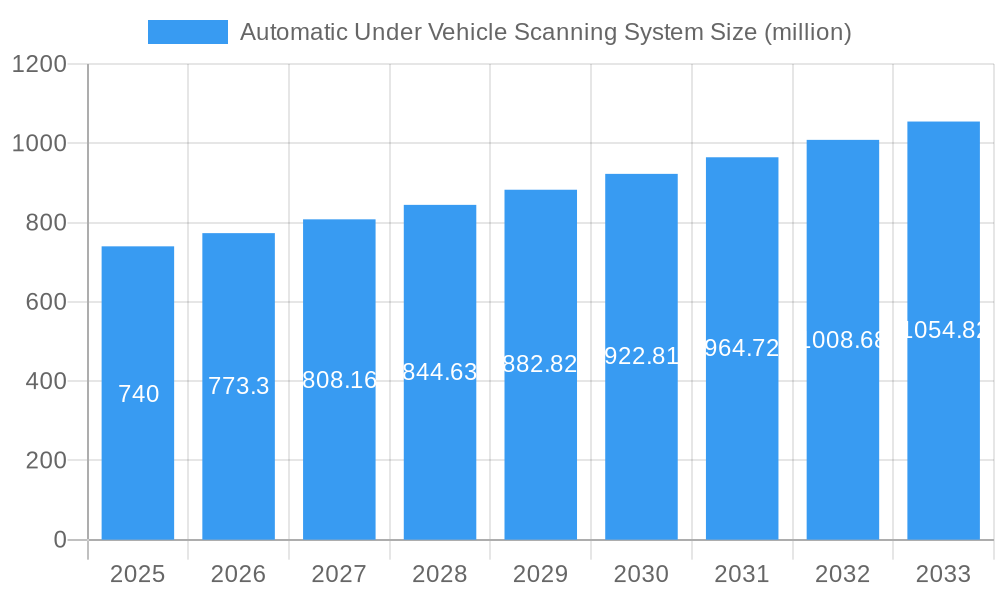
The global Automatic Under Vehicle Scanning System (AUVS) market, valued at $740 million in 2025, is projected to experience robust growth, driven by increasing security concerns across various sectors. The 4.5% CAGR indicates a steady expansion through 2033, fueled by rising adoption in government agencies, transportation hubs (airports, stations), and highway checkpoints. The fixed AUVS segment currently dominates the market due to its higher deployment in secure facilities, offering consistent surveillance and data logging capabilities. However, the mobile AUVS segment is experiencing faster growth, propelled by its enhanced flexibility for deployment in diverse locations and its suitability for temporary security needs or events. Key growth drivers include stringent government regulations mandating enhanced security measures, rising terrorist threats, and the need for efficient border control and contraband detection. Technological advancements, such as improved image processing and AI-powered threat detection, further contribute to market expansion. This is particularly true in regions like North America and Europe, which have a strong focus on security infrastructure and advanced technology adoption.
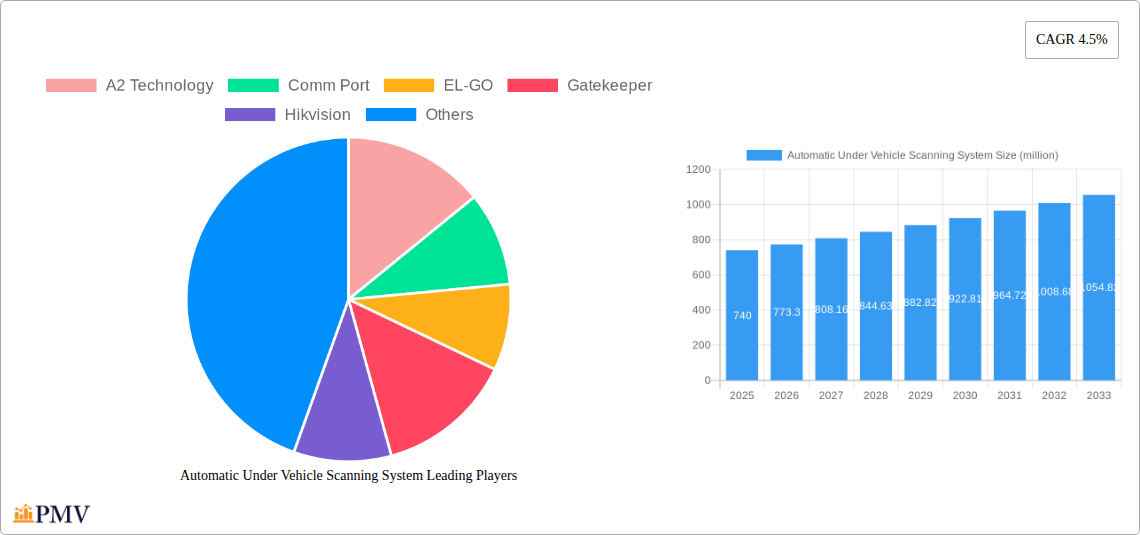
Automatic Under Vehicle Scanning System Market Size (In Million)
Despite the positive outlook, certain restraints exist. High initial investment costs for AUVS systems can be a deterrent for smaller organizations or developing nations. Furthermore, the need for skilled personnel to operate and maintain these sophisticated systems poses a challenge. However, ongoing technological advancements are leading to more user-friendly systems and reduced maintenance needs, gradually mitigating this constraint. The market is segmented by application (government agencies, stations, airports, highways, checkpoints, others) and type (fixed, mobile), with significant opportunities emerging in emerging markets in Asia-Pacific and the Middle East & Africa, driven by infrastructural development and growing security awareness. The competitive landscape features a mix of established players like Hikvision and newer entrants, each vying for market share with specialized offerings and technological advancements.
Automatic Under Vehicle Scanning System Company Market Share
Automatic Under Vehicle Scanning System Market Report: 2019-2033
This comprehensive report provides a detailed analysis of the global Automatic Under Vehicle Scanning System market, offering invaluable insights for stakeholders across the industry. The study period spans from 2019 to 2033, with 2025 serving as the base and estimated year. The forecast period covers 2025-2033, while the historical period encompasses 2019-2024. The report explores market size, segmentation, competitive landscape, and future growth potential, providing crucial data to inform strategic decision-making. The market is valued at $XX million in 2025 and is projected to reach $XX million by 2033, exhibiting a CAGR of XX%.
Automatic Under Vehicle Scanning System Market Structure & Competitive Dynamics
The global Automatic Under Vehicle Scanning System market exhibits a moderately concentrated structure, with several key players vying for market share. The market's competitive dynamics are shaped by factors such as technological innovation, regulatory compliance, and strategic mergers and acquisitions (M&A). In 2024, the top five players—Hikvision, SECOM, ZKTeco Co, Ulgen, and A2 Technology—held a combined market share of approximately 45%, indicating a degree of market consolidation. However, the market also features numerous smaller players, contributing to competitive intensity. Recent M&A activity has been relatively subdued, with only a few significant deals totaling approximately $XX million in value during the period 2021-2024. The regulatory environment significantly influences market growth, with stringent safety and security standards driving demand for advanced systems. Product substitution is minimal, given the specialized nature of under-vehicle scanning technology, while end-user trends point towards increasing adoption by government agencies and critical infrastructure sites. Innovation ecosystems are growing with the emergence of AI-powered scanning technologies, enhancing detection capabilities.
- Market Concentration: Moderately concentrated, with top 5 players holding 45% market share in 2024.
- M&A Activity: Low activity (2021-2024), total deal value approximately $XX million.
- Regulatory Framework: Stringent standards driving demand for sophisticated systems.
- Product Substitutes: Minimal viable substitutes.
- End-User Trends: Increasing adoption by government and critical infrastructure.
Automatic Under Vehicle Scanning System Industry Trends & Insights
The Automatic Under Vehicle Scanning System market is experiencing robust growth, driven by escalating security concerns worldwide. The increasing prevalence of terrorist attacks and organized crime has fueled demand for advanced security solutions, including under-vehicle scanners. Technological advancements, such as the integration of artificial intelligence (AI) and improved image processing capabilities, have enhanced the accuracy and efficiency of these systems. The market penetration rate for under-vehicle scanning systems in government agencies and critical infrastructure locations remains relatively low but is expected to increase significantly over the forecast period. Consumer preferences trend towards systems with advanced features, such as automated threat detection and real-time alerts. This trend is reinforced by the development of cloud-based platforms that enable remote monitoring and data analysis. The market is characterized by intense competition, with established players and new entrants continually striving to enhance their product offerings and expand their market reach. The market's compound annual growth rate (CAGR) is projected to be XX% during the forecast period, driven by these factors. Furthermore, growing awareness of cybersecurity threats is accelerating investment in advanced security systems.
Dominant Markets & Segments in Automatic Under Vehicle Scanning System
The Government Agencies segment (including stations, airports, etc.) represents the largest market share within the Automatic Under Vehicle Scanning System market. The high concentration of security-sensitive locations within this segment drives significant demand. This is further augmented by substantial government investments in security infrastructure worldwide. Geographically, North America and Europe currently dominate the market, driven by stringent security regulations and a high concentration of critical infrastructure. However, the Asia-Pacific region is projected to experience the fastest growth during the forecast period, fueled by rapid urbanization and increasing investments in security infrastructure.
- Key Drivers for Government Agencies Segment:
- Heightened security concerns post-9/11 and subsequent global terrorist activities.
- Significant government funding allocated to infrastructure security upgrades.
- Stringent regulatory mandates for security screening at critical facilities.
- Key Drivers for Highway Segment:
- Increased need for security checkpoints on major highways for improved threat detection.
- Growing adoption of integrated traffic management systems for better security and efficiency.
- Key Drivers for Fixed Systems:
- Cost-effectiveness for high-volume applications in fixed locations.
- Enhanced security provided by a permanent installation.
- Key Drivers for Mobile Systems:
- Flexibility and adaptability for various locations and events.
- Suitable for temporary deployments at dynamic locations.
Automatic Under Vehicle Scanning System Product Innovations
Recent innovations in Automatic Under Vehicle Scanning Systems have focused on enhancing detection capabilities, improving image clarity, and integrating advanced analytics. The incorporation of AI and machine learning algorithms significantly improves threat identification accuracy. Miniaturization of components has led to more compact and portable systems. Cloud-based data management offers remote monitoring and improved data analysis. These advancements have broadened the applicability of these systems, creating new market opportunities in diverse sectors, including border control and high-security facilities.
Report Segmentation & Scope
This report segments the Automatic Under Vehicle Scanning System market by application (Government Agencies, Stations, Airports, Highway, Checkpoint, Others) and type (Fixed, Mobile). Each segment's market size, growth projections, and competitive dynamics are detailed within the report. The Government Agencies segment includes various sub-segments like airports, military bases, and government buildings, each with its own specific security requirements and corresponding market characteristics. The Highway segment accounts for the demand from security checkpoints along major roads, while the Checkpoint segment covers various uses in access control applications. The 'Others' segment encompasses diverse applications like parking garages and commercial facilities. The fixed type systems constitute the largest segment, driven by their cost-effectiveness for high-volume scanning applications. Mobile systems, although a smaller segment, show significant growth potential owing to their flexibility and suitability for temporary deployments.
Key Drivers of Automatic Under Vehicle Scanning System Growth
Several factors contribute to the market's growth. Increased government spending on security infrastructure, particularly in response to rising global threats, is a major driver. Technological advancements, including AI and improved image processing, enhance accuracy and efficiency. The rising demand for enhanced security measures in critical infrastructure sectors further fuels the market's expansion. Stringent regulations and standards governing security protocols in various industries add to the impetus.
Challenges in the Automatic Under Vehicle Scanning System Sector
The market faces several challenges. High initial investment costs can be a barrier for smaller organizations. The complexity of the technology and the need for skilled personnel for installation and maintenance add to cost and operational challenges. Concerns regarding data privacy and security must be addressed to assure widespread adoption. Finally, the need for constant upgrades to maintain effectiveness in the face of evolving threats represents a continuous cost.
Key Developments in Automatic Under Vehicle Scanning System Sector
- 2022 Q4: Hikvision launched its next-generation AI-powered under-vehicle scanning system.
- 2023 Q1: SECOM partnered with a leading AI company to enhance its system's threat detection capabilities.
- 2023 Q2: A2 Technology acquired a smaller competitor, expanding its market share. (Additional developments are expected, but specific information is not available at this time, please refer to future market updates).
Strategic Automatic Under Vehicle Scanning System Market Outlook
The Automatic Under Vehicle Scanning System market is poised for significant growth, driven by technological innovations and heightened security concerns. Strategic opportunities exist for companies to develop advanced systems with enhanced threat detection capabilities, user-friendly interfaces, and cost-effective solutions. The integration of AI and big data analytics can further enhance the value proposition of these systems, attracting broader adoption across various sectors. Expanding into emerging markets, focusing on partnerships, and proactively addressing data privacy concerns will be crucial for success.
Automatic Under Vehicle Scanning System Segmentation
-
1. Application
- 1.1. Government Agencies
- 1.2. Stations, Airports, etc
- 1.3. Highway
- 1.4. Checkpoint
- 1.5. Others
-
2. Type
- 2.1. Fixed
- 2.2. Mobile
Automatic Under Vehicle Scanning System Segmentation By Geography
-
1. North America
- 1.1. United States
- 1.2. Canada
- 1.3. Mexico
-
2. South America
- 2.1. Brazil
- 2.2. Argentina
- 2.3. Rest of South America
-
3. Europe
- 3.1. United Kingdom
- 3.2. Germany
- 3.3. France
- 3.4. Italy
- 3.5. Spain
- 3.6. Russia
- 3.7. Benelux
- 3.8. Nordics
- 3.9. Rest of Europe
-
4. Middle East & Africa
- 4.1. Turkey
- 4.2. Israel
- 4.3. GCC
- 4.4. North Africa
- 4.5. South Africa
- 4.6. Rest of Middle East & Africa
-
5. Asia Pacific
- 5.1. China
- 5.2. India
- 5.3. Japan
- 5.4. South Korea
- 5.5. ASEAN
- 5.6. Oceania
- 5.7. Rest of Asia Pacific
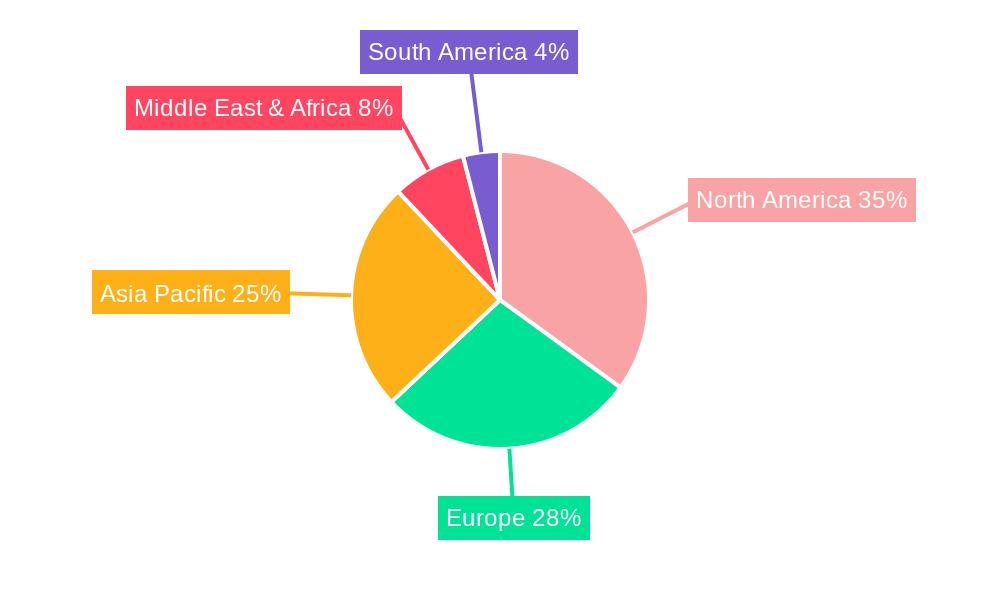
Automatic Under Vehicle Scanning System Regional Market Share
Geographic Coverage of Automatic Under Vehicle Scanning System
Automatic Under Vehicle Scanning System REPORT HIGHLIGHTS
| Aspects | Details |
|---|---|
| Study Period | 2020-2034 |
| Base Year | 2025 |
| Estimated Year | 2026 |
| Forecast Period | 2026-2034 |
| Historical Period | 2020-2025 |
| Growth Rate | CAGR of 4.5% from 2020-2034 |
| Segmentation |
|
Table of Contents
- 1. Introduction
- 1.1. Research Scope
- 1.2. Market Segmentation
- 1.3. Research Objective
- 1.4. Definitions and Assumptions
- 2. Executive Summary
- 2.1. Market Snapshot
- 3. Market Dynamics
- 3.1. Market Drivers
- 3.2. Market Restrains
- 3.3. Market Trends
- 3.4. Market Opportunities
- 4. Market Factor Analysis
- 4.1. Porters Five Forces
- 4.1.1. Bargaining Power of Suppliers
- 4.1.2. Bargaining Power of Buyers
- 4.1.3. Threat of New Entrants
- 4.1.4. Threat of Substitutes
- 4.1.5. Competitive Rivalry
- 4.2. PESTEL analysis
- 4.3. BCG Analysis
- 4.3.1. Stars (High Growth, High Market Share)
- 4.3.2. Cash Cows (Low Growth, High Market Share)
- 4.3.3. Question Mark (High Growth, Low Market Share)
- 4.3.4. Dogs (Low Growth, Low Market Share)
- 4.4. Ansoff Matrix Analysis
- 4.5. Supply Chain Analysis
- 4.6. Regulatory Landscape
- 4.7. Current Market Potential and Opportunity Assessment (TAM–SAM–SOM Framework)
- 4.8. PMV Analyst Note
- 4.1. Porters Five Forces
- 5. Market Analysis, Insights and Forecast 2021-2033
- 5.1. Market Analysis, Insights and Forecast - by Application
- 5.1.1. Government Agencies
- 5.1.2. Stations, Airports, etc
- 5.1.3. Highway
- 5.1.4. Checkpoint
- 5.1.5. Others
- 5.2. Market Analysis, Insights and Forecast - by Type
- 5.2.1. Fixed
- 5.2.2. Mobile
- 5.3. Market Analysis, Insights and Forecast - by Region
- 5.3.1. North America
- 5.3.2. South America
- 5.3.3. Europe
- 5.3.4. Middle East & Africa
- 5.3.5. Asia Pacific
- 5.1. Market Analysis, Insights and Forecast - by Application
- 6. Global Automatic Under Vehicle Scanning System Analysis, Insights and Forecast, 2021-2033
- 6.1. Market Analysis, Insights and Forecast - by Application
- 6.1.1. Government Agencies
- 6.1.2. Stations, Airports, etc
- 6.1.3. Highway
- 6.1.4. Checkpoint
- 6.1.5. Others
- 6.2. Market Analysis, Insights and Forecast - by Type
- 6.2.1. Fixed
- 6.2.2. Mobile
- 6.1. Market Analysis, Insights and Forecast - by Application
- 7. North America Automatic Under Vehicle Scanning System Analysis, Insights and Forecast, 2020-2032
- 7.1. Market Analysis, Insights and Forecast - by Application
- 7.1.1. Government Agencies
- 7.1.2. Stations, Airports, etc
- 7.1.3. Highway
- 7.1.4. Checkpoint
- 7.1.5. Others
- 7.2. Market Analysis, Insights and Forecast - by Type
- 7.2.1. Fixed
- 7.2.2. Mobile
- 7.1. Market Analysis, Insights and Forecast - by Application
- 8. South America Automatic Under Vehicle Scanning System Analysis, Insights and Forecast, 2020-2032
- 8.1. Market Analysis, Insights and Forecast - by Application
- 8.1.1. Government Agencies
- 8.1.2. Stations, Airports, etc
- 8.1.3. Highway
- 8.1.4. Checkpoint
- 8.1.5. Others
- 8.2. Market Analysis, Insights and Forecast - by Type
- 8.2.1. Fixed
- 8.2.2. Mobile
- 8.1. Market Analysis, Insights and Forecast - by Application
- 9. Europe Automatic Under Vehicle Scanning System Analysis, Insights and Forecast, 2020-2032
- 9.1. Market Analysis, Insights and Forecast - by Application
- 9.1.1. Government Agencies
- 9.1.2. Stations, Airports, etc
- 9.1.3. Highway
- 9.1.4. Checkpoint
- 9.1.5. Others
- 9.2. Market Analysis, Insights and Forecast - by Type
- 9.2.1. Fixed
- 9.2.2. Mobile
- 9.1. Market Analysis, Insights and Forecast - by Application
- 10. Middle East & Africa Automatic Under Vehicle Scanning System Analysis, Insights and Forecast, 2020-2032
- 10.1. Market Analysis, Insights and Forecast - by Application
- 10.1.1. Government Agencies
- 10.1.2. Stations, Airports, etc
- 10.1.3. Highway
- 10.1.4. Checkpoint
- 10.1.5. Others
- 10.2. Market Analysis, Insights and Forecast - by Type
- 10.2.1. Fixed
- 10.2.2. Mobile
- 10.1. Market Analysis, Insights and Forecast - by Application
- 11. Asia Pacific Automatic Under Vehicle Scanning System Analysis, Insights and Forecast, 2020-2032
- 11.1. Market Analysis, Insights and Forecast - by Application
- 11.1.1. Government Agencies
- 11.1.2. Stations, Airports, etc
- 11.1.3. Highway
- 11.1.4. Checkpoint
- 11.1.5. Others
- 11.2. Market Analysis, Insights and Forecast - by Type
- 11.2.1. Fixed
- 11.2.2. Mobile
- 11.1. Market Analysis, Insights and Forecast - by Application
- 12. Competitive Analysis
- 12.1. Company Profiles
- 12.1.1 A2 Technology
- 12.1.1.1. Company Overview
- 12.1.1.2. Products
- 12.1.1.3. Company Financials
- 12.1.1.4. SWOT Analysis
- 12.1.2 Comm Port
- 12.1.2.1. Company Overview
- 12.1.2.2. Products
- 12.1.2.3. Company Financials
- 12.1.2.4. SWOT Analysis
- 12.1.3 EL-GO
- 12.1.3.1. Company Overview
- 12.1.3.2. Products
- 12.1.3.3. Company Financials
- 12.1.3.4. SWOT Analysis
- 12.1.4 Gatekeeper
- 12.1.4.1. Company Overview
- 12.1.4.2. Products
- 12.1.4.3. Company Financials
- 12.1.4.4. SWOT Analysis
- 12.1.5 Hikvision
- 12.1.5.1. Company Overview
- 12.1.5.2. Products
- 12.1.5.3. Company Financials
- 12.1.5.4. SWOT Analysis
- 12.1.6 Matrix Security
- 12.1.6.1. Company Overview
- 12.1.6.2. Products
- 12.1.6.3. Company Financials
- 12.1.6.4. SWOT Analysis
- 12.1.7 SafeAgle
- 12.1.7.1. Company Overview
- 12.1.7.2. Products
- 12.1.7.3. Company Financials
- 12.1.7.4. SWOT Analysis
- 12.1.8 SECOM
- 12.1.8.1. Company Overview
- 12.1.8.2. Products
- 12.1.8.3. Company Financials
- 12.1.8.4. SWOT Analysis
- 12.1.9 SecuScan
- 12.1.9.1. Company Overview
- 12.1.9.2. Products
- 12.1.9.3. Company Financials
- 12.1.9.4. SWOT Analysis
- 12.1.10 Ulgen
- 12.1.10.1. Company Overview
- 12.1.10.2. Products
- 12.1.10.3. Company Financials
- 12.1.10.4. SWOT Analysis
- 12.1.11 UVIScan
- 12.1.11.1. Company Overview
- 12.1.11.2. Products
- 12.1.11.3. Company Financials
- 12.1.11.4. SWOT Analysis
- 12.1.12 Vehant
- 12.1.12.1. Company Overview
- 12.1.12.2. Products
- 12.1.12.3. Company Financials
- 12.1.12.4. SWOT Analysis
- 12.1.13 Westminster
- 12.1.13.1. Company Overview
- 12.1.13.2. Products
- 12.1.13.3. Company Financials
- 12.1.13.4. SWOT Analysis
- 12.1.14 ZKTeco Co
- 12.1.14.1. Company Overview
- 12.1.14.2. Products
- 12.1.14.3. Company Financials
- 12.1.14.4. SWOT Analysis
- 12.1.15 ZOAN GAOKE
- 12.1.15.1. Company Overview
- 12.1.15.2. Products
- 12.1.15.3. Company Financials
- 12.1.15.4. SWOT Analysis
- 12.1.16 Advanced Detection Technology
- 12.1.16.1. Company Overview
- 12.1.16.2. Products
- 12.1.16.3. Company Financials
- 12.1.16.4. SWOT Analysis
- 12.1.17 Nestor Technologies
- 12.1.17.1. Company Overview
- 12.1.17.2. Products
- 12.1.17.3. Company Financials
- 12.1.17.4. SWOT Analysis
- 12.1.1 A2 Technology
- 12.2. Market Entropy
- 12.2.1 Company's Key Areas Served
- 12.2.2 Recent Developments
- 12.3. Company Market Share Analysis 2025
- 12.3.1 Top 5 Companies Market Share Analysis
- 12.3.2 Top 3 Companies Market Share Analysis
- 12.4. List of Potential Customers
- 13. Research Methodology
List of Figures
- Figure 1: Global Automatic Under Vehicle Scanning System Revenue Breakdown (million, %) by Region 2025 & 2033
- Figure 2: North America Automatic Under Vehicle Scanning System Revenue (million), by Application 2025 & 2033
- Figure 3: North America Automatic Under Vehicle Scanning System Revenue Share (%), by Application 2025 & 2033
- Figure 4: North America Automatic Under Vehicle Scanning System Revenue (million), by Type 2025 & 2033
- Figure 5: North America Automatic Under Vehicle Scanning System Revenue Share (%), by Type 2025 & 2033
- Figure 6: North America Automatic Under Vehicle Scanning System Revenue (million), by Country 2025 & 2033
- Figure 7: North America Automatic Under Vehicle Scanning System Revenue Share (%), by Country 2025 & 2033
- Figure 8: South America Automatic Under Vehicle Scanning System Revenue (million), by Application 2025 & 2033
- Figure 9: South America Automatic Under Vehicle Scanning System Revenue Share (%), by Application 2025 & 2033
- Figure 10: South America Automatic Under Vehicle Scanning System Revenue (million), by Type 2025 & 2033
- Figure 11: South America Automatic Under Vehicle Scanning System Revenue Share (%), by Type 2025 & 2033
- Figure 12: South America Automatic Under Vehicle Scanning System Revenue (million), by Country 2025 & 2033
- Figure 13: South America Automatic Under Vehicle Scanning System Revenue Share (%), by Country 2025 & 2033
- Figure 14: Europe Automatic Under Vehicle Scanning System Revenue (million), by Application 2025 & 2033
- Figure 15: Europe Automatic Under Vehicle Scanning System Revenue Share (%), by Application 2025 & 2033
- Figure 16: Europe Automatic Under Vehicle Scanning System Revenue (million), by Type 2025 & 2033
- Figure 17: Europe Automatic Under Vehicle Scanning System Revenue Share (%), by Type 2025 & 2033
- Figure 18: Europe Automatic Under Vehicle Scanning System Revenue (million), by Country 2025 & 2033
- Figure 19: Europe Automatic Under Vehicle Scanning System Revenue Share (%), by Country 2025 & 2033
- Figure 20: Middle East & Africa Automatic Under Vehicle Scanning System Revenue (million), by Application 2025 & 2033
- Figure 21: Middle East & Africa Automatic Under Vehicle Scanning System Revenue Share (%), by Application 2025 & 2033
- Figure 22: Middle East & Africa Automatic Under Vehicle Scanning System Revenue (million), by Type 2025 & 2033
- Figure 23: Middle East & Africa Automatic Under Vehicle Scanning System Revenue Share (%), by Type 2025 & 2033
- Figure 24: Middle East & Africa Automatic Under Vehicle Scanning System Revenue (million), by Country 2025 & 2033
- Figure 25: Middle East & Africa Automatic Under Vehicle Scanning System Revenue Share (%), by Country 2025 & 2033
- Figure 26: Asia Pacific Automatic Under Vehicle Scanning System Revenue (million), by Application 2025 & 2033
- Figure 27: Asia Pacific Automatic Under Vehicle Scanning System Revenue Share (%), by Application 2025 & 2033
- Figure 28: Asia Pacific Automatic Under Vehicle Scanning System Revenue (million), by Type 2025 & 2033
- Figure 29: Asia Pacific Automatic Under Vehicle Scanning System Revenue Share (%), by Type 2025 & 2033
- Figure 30: Asia Pacific Automatic Under Vehicle Scanning System Revenue (million), by Country 2025 & 2033
- Figure 31: Asia Pacific Automatic Under Vehicle Scanning System Revenue Share (%), by Country 2025 & 2033
List of Tables
- Table 1: Global Automatic Under Vehicle Scanning System Revenue million Forecast, by Application 2020 & 2033
- Table 2: Global Automatic Under Vehicle Scanning System Revenue million Forecast, by Type 2020 & 2033
- Table 3: Global Automatic Under Vehicle Scanning System Revenue million Forecast, by Region 2020 & 2033
- Table 4: Global Automatic Under Vehicle Scanning System Revenue million Forecast, by Application 2020 & 2033
- Table 5: Global Automatic Under Vehicle Scanning System Revenue million Forecast, by Type 2020 & 2033
- Table 6: Global Automatic Under Vehicle Scanning System Revenue million Forecast, by Country 2020 & 2033
- Table 7: United States Automatic Under Vehicle Scanning System Revenue (million) Forecast, by Application 2020 & 2033
- Table 8: Canada Automatic Under Vehicle Scanning System Revenue (million) Forecast, by Application 2020 & 2033
- Table 9: Mexico Automatic Under Vehicle Scanning System Revenue (million) Forecast, by Application 2020 & 2033
- Table 10: Global Automatic Under Vehicle Scanning System Revenue million Forecast, by Application 2020 & 2033
- Table 11: Global Automatic Under Vehicle Scanning System Revenue million Forecast, by Type 2020 & 2033
- Table 12: Global Automatic Under Vehicle Scanning System Revenue million Forecast, by Country 2020 & 2033
- Table 13: Brazil Automatic Under Vehicle Scanning System Revenue (million) Forecast, by Application 2020 & 2033
- Table 14: Argentina Automatic Under Vehicle Scanning System Revenue (million) Forecast, by Application 2020 & 2033
- Table 15: Rest of South America Automatic Under Vehicle Scanning System Revenue (million) Forecast, by Application 2020 & 2033
- Table 16: Global Automatic Under Vehicle Scanning System Revenue million Forecast, by Application 2020 & 2033
- Table 17: Global Automatic Under Vehicle Scanning System Revenue million Forecast, by Type 2020 & 2033
- Table 18: Global Automatic Under Vehicle Scanning System Revenue million Forecast, by Country 2020 & 2033
- Table 19: United Kingdom Automatic Under Vehicle Scanning System Revenue (million) Forecast, by Application 2020 & 2033
- Table 20: Germany Automatic Under Vehicle Scanning System Revenue (million) Forecast, by Application 2020 & 2033
- Table 21: France Automatic Under Vehicle Scanning System Revenue (million) Forecast, by Application 2020 & 2033
- Table 22: Italy Automatic Under Vehicle Scanning System Revenue (million) Forecast, by Application 2020 & 2033
- Table 23: Spain Automatic Under Vehicle Scanning System Revenue (million) Forecast, by Application 2020 & 2033
- Table 24: Russia Automatic Under Vehicle Scanning System Revenue (million) Forecast, by Application 2020 & 2033
- Table 25: Benelux Automatic Under Vehicle Scanning System Revenue (million) Forecast, by Application 2020 & 2033
- Table 26: Nordics Automatic Under Vehicle Scanning System Revenue (million) Forecast, by Application 2020 & 2033
- Table 27: Rest of Europe Automatic Under Vehicle Scanning System Revenue (million) Forecast, by Application 2020 & 2033
- Table 28: Global Automatic Under Vehicle Scanning System Revenue million Forecast, by Application 2020 & 2033
- Table 29: Global Automatic Under Vehicle Scanning System Revenue million Forecast, by Type 2020 & 2033
- Table 30: Global Automatic Under Vehicle Scanning System Revenue million Forecast, by Country 2020 & 2033
- Table 31: Turkey Automatic Under Vehicle Scanning System Revenue (million) Forecast, by Application 2020 & 2033
- Table 32: Israel Automatic Under Vehicle Scanning System Revenue (million) Forecast, by Application 2020 & 2033
- Table 33: GCC Automatic Under Vehicle Scanning System Revenue (million) Forecast, by Application 2020 & 2033
- Table 34: North Africa Automatic Under Vehicle Scanning System Revenue (million) Forecast, by Application 2020 & 2033
- Table 35: South Africa Automatic Under Vehicle Scanning System Revenue (million) Forecast, by Application 2020 & 2033
- Table 36: Rest of Middle East & Africa Automatic Under Vehicle Scanning System Revenue (million) Forecast, by Application 2020 & 2033
- Table 37: Global Automatic Under Vehicle Scanning System Revenue million Forecast, by Application 2020 & 2033
- Table 38: Global Automatic Under Vehicle Scanning System Revenue million Forecast, by Type 2020 & 2033
- Table 39: Global Automatic Under Vehicle Scanning System Revenue million Forecast, by Country 2020 & 2033
- Table 40: China Automatic Under Vehicle Scanning System Revenue (million) Forecast, by Application 2020 & 2033
- Table 41: India Automatic Under Vehicle Scanning System Revenue (million) Forecast, by Application 2020 & 2033
- Table 42: Japan Automatic Under Vehicle Scanning System Revenue (million) Forecast, by Application 2020 & 2033
- Table 43: South Korea Automatic Under Vehicle Scanning System Revenue (million) Forecast, by Application 2020 & 2033
- Table 44: ASEAN Automatic Under Vehicle Scanning System Revenue (million) Forecast, by Application 2020 & 2033
- Table 45: Oceania Automatic Under Vehicle Scanning System Revenue (million) Forecast, by Application 2020 & 2033
- Table 46: Rest of Asia Pacific Automatic Under Vehicle Scanning System Revenue (million) Forecast, by Application 2020 & 2033
Frequently Asked Questions
1. What is the projected Compound Annual Growth Rate (CAGR) of the Automatic Under Vehicle Scanning System?
The projected CAGR is approximately 4.5%.
2. Which companies are prominent players in the Automatic Under Vehicle Scanning System?
Key companies in the market include A2 Technology, Comm Port, EL-GO, Gatekeeper, Hikvision, Matrix Security, SafeAgle, SECOM, SecuScan, Ulgen, UVIScan, Vehant, Westminster, ZKTeco Co, ZOAN GAOKE, Advanced Detection Technology, Nestor Technologies.
3. What are the main segments of the Automatic Under Vehicle Scanning System?
The market segments include Application, Type.
4. Can you provide details about the market size?
The market size is estimated to be USD 740 million as of 2022.
5. What are some drivers contributing to market growth?
N/A
6. What are the notable trends driving market growth?
N/A
7. Are there any restraints impacting market growth?
N/A
8. Can you provide examples of recent developments in the market?
N/A
9. What pricing options are available for accessing the report?
Pricing options include single-user, multi-user, and enterprise licenses priced at USD 4250.00, USD 6375.00, and USD 8500.00 respectively.
10. Is the market size provided in terms of value or volume?
The market size is provided in terms of value, measured in million.
11. Are there any specific market keywords associated with the report?
Yes, the market keyword associated with the report is "Automatic Under Vehicle Scanning System," which aids in identifying and referencing the specific market segment covered.
12. How do I determine which pricing option suits my needs best?
The pricing options vary based on user requirements and access needs. Individual users may opt for single-user licenses, while businesses requiring broader access may choose multi-user or enterprise licenses for cost-effective access to the report.
13. Are there any additional resources or data provided in the Automatic Under Vehicle Scanning System report?
While the report offers comprehensive insights, it's advisable to review the specific contents or supplementary materials provided to ascertain if additional resources or data are available.
14. How can I stay updated on further developments or reports in the Automatic Under Vehicle Scanning System?
To stay informed about further developments, trends, and reports in the Automatic Under Vehicle Scanning System, consider subscribing to industry newsletters, following relevant companies and organizations, or regularly checking reputable industry news sources and publications.
Methodology
Step 1 - Identification of Relevant Samples Size from Population Database


Step 2 - Approaches for Defining Global Market Size (Value, Volume* & Price*)

Note*: In applicable scenarios
Step 3 - Data Sources
Primary Research
- Web Analytics
- Survey Reports
- Research Institute
- Latest Research Reports
- Opinion Leaders
Secondary Research
- Annual Reports
- White Paper
- Latest Press Release
- Industry Association
- Paid Database
- Investor Presentations

Step 4 - Data Triangulation
Involves using different sources of information in order to increase the validity of a study
These sources are likely to be stakeholders in a program - participants, other researchers, program staff, other community members, and so on.
Then we put all data in single framework & apply various statistical tools to find out the dynamic on the market.
During the analysis stage, feedback from the stakeholder groups would be compared to determine areas of agreement as well as areas of divergence