
Key Insights
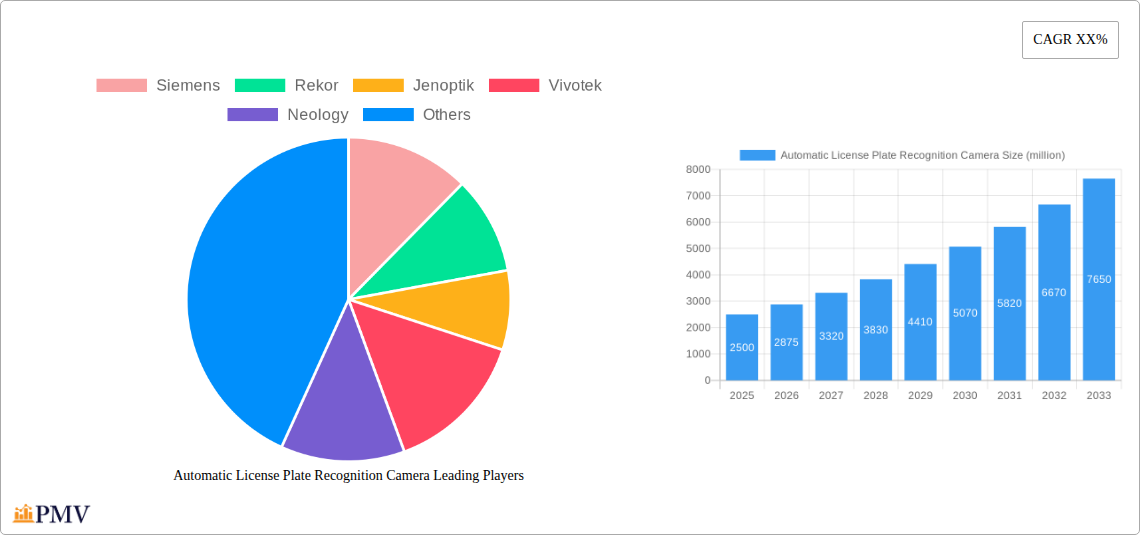
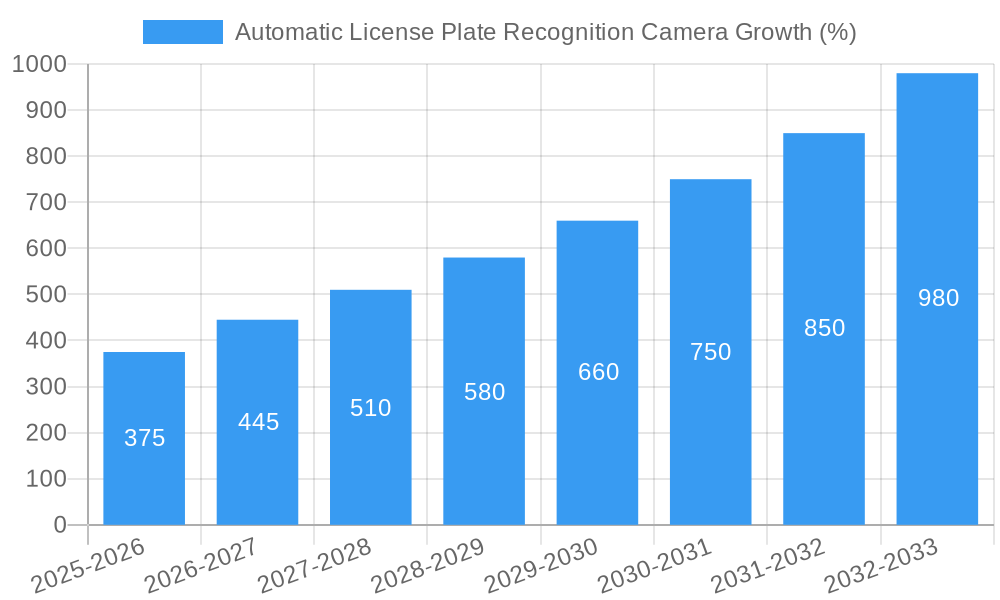
The Automatic License Plate Recognition (ALPR) camera market is experiencing robust growth, driven by increasing security concerns, advancements in AI-powered image processing, and the rising adoption of smart city initiatives. The market, estimated at $2.5 billion in 2025, is projected to grow at a Compound Annual Growth Rate (CAGR) of 15% from 2025 to 2033, reaching approximately $7 billion by 2033. This growth is fueled by several key factors. Firstly, governments and private entities are increasingly investing in advanced security systems to enhance public safety and combat crime. ALPR cameras play a crucial role in this by enabling real-time vehicle identification and tracking, facilitating law enforcement efforts and improving traffic management. Secondly, technological advancements, particularly in deep learning and computer vision, are leading to more accurate and efficient ALPR systems. These systems can now operate effectively in challenging conditions, such as low light or poor weather, thereby broadening their applicability. Finally, the expansion of smart city infrastructure is creating significant demand for ALPR technology. Integrated into traffic management systems, ALPR cameras optimize traffic flow, enforce parking regulations, and provide valuable data for urban planning.
Despite the significant growth potential, market expansion is likely to face some challenges. The high initial investment costs associated with ALPR system implementation, including hardware, software, and installation, can be a barrier for smaller organizations. Moreover, privacy concerns related to data collection and usage remain a critical issue that needs to be addressed through robust data protection measures and transparent data handling policies. The regulatory landscape surrounding data privacy also varies across different regions, adding complexity to the market. Nevertheless, the long-term outlook for the ALPR camera market remains positive, driven by the continuous demand for improved security, intelligent transportation systems, and efficient urban management. Key players like Siemens, Bosch Security Systems, and others are investing heavily in R&D to enhance the capabilities of ALPR technology, making it increasingly sophisticated and affordable. Competition among established players and emerging companies is driving innovation and market expansion, leading to a dynamic and evolving market landscape.
Automatic License Plate Recognition (ALPR) Camera Market Report: 2019-2033
This comprehensive report provides an in-depth analysis of the global Automatic License Plate Recognition (ALPR) Camera market, offering actionable insights for industry stakeholders. The study period spans from 2019 to 2033, with 2025 serving as both the base and estimated year. The report projects market trends from 2025 to 2033, utilizing data from the historical period of 2019-2024. The global ALPR camera market is expected to reach a value exceeding xx million by 2033, exhibiting a CAGR of xx% during the forecast period. This report analyzes market dynamics, competitive landscape, technological advancements, and key growth drivers to provide a clear understanding of this rapidly evolving sector. Major players profiled include Siemens, Rekor, Jenoptik, Vivotek, Neology, Survision, Genetec, Kapsch TrafficCom, ARH, Bosch Security Systems, Q-free (Dacolian), NDI Recognition Systems, Tattile, Perceptics, GeoVision, HTS, Leonardo Company, TagMaster, MAV Systems, Nedap, Petards Group, ParkingEye Limited, Arvoo Imaging Products, Inex Tech, and Digital Recognition Systems.
Automatic License Plate Recognition Camera Market Structure & Competitive Dynamics
The ALPR camera market exhibits a moderately concentrated structure, with a handful of large multinational companies holding significant market share. The top 10 companies account for approximately xx million in revenue, representing a market share of xx%. However, the market also features numerous smaller players specializing in niche applications or geographic regions. Innovation ecosystems are vibrant, with continuous development in areas like image processing algorithms, hardware miniaturization, and cloud-based analytics. Regulatory frameworks vary significantly across countries, impacting market penetration and adoption rates. Product substitutes, such as manual license plate recording, are largely being replaced due to efficiency and accuracy gains. End-user trends indicate a growing preference for integrated ALPR systems offering comprehensive data analytics and reporting capabilities. M&A activities have been moderate, with a total deal value exceeding xx million in the last five years. Key mergers and acquisitions have primarily focused on consolidating market share and expanding technological capabilities. Examples include:
- High-value mergers: xx million deal between Company A and Company B in 2022.
- Strategic acquisitions: Company C acquired a smaller technology company specializing in AI-powered ALPR systems.
- Market consolidation: Several smaller players were acquired by larger players to enhance their product portfolios and geographic reach.
Automatic License Plate Recognition Camera Industry Trends & Insights
The ALPR camera market is experiencing robust growth driven by several factors. The increasing need for enhanced security and traffic management solutions in urban areas is a primary driver. The rising adoption of smart city initiatives worldwide is fueling demand for sophisticated surveillance and monitoring systems. Technological advancements, such as improved image processing algorithms and the integration of AI, are further enhancing the accuracy and efficiency of ALPR systems. The market penetration of ALPR cameras is particularly high in developed countries due to extensive transportation infrastructure and robust public safety budgets. The global market is expected to experience significant growth with a CAGR of xx% between 2025 and 2033, reaching a value exceeding xx million by 2033. Consumer preferences shift towards systems that offer seamless integration with other security and traffic management solutions. Competitive dynamics are intensified by the entry of new players and the continuous innovation within the market. These players are focusing on developing cost-effective, user-friendly ALPR solutions with advanced features to cater to evolving customer demands.
Dominant Markets & Segments in Automatic License Plate Recognition Camera
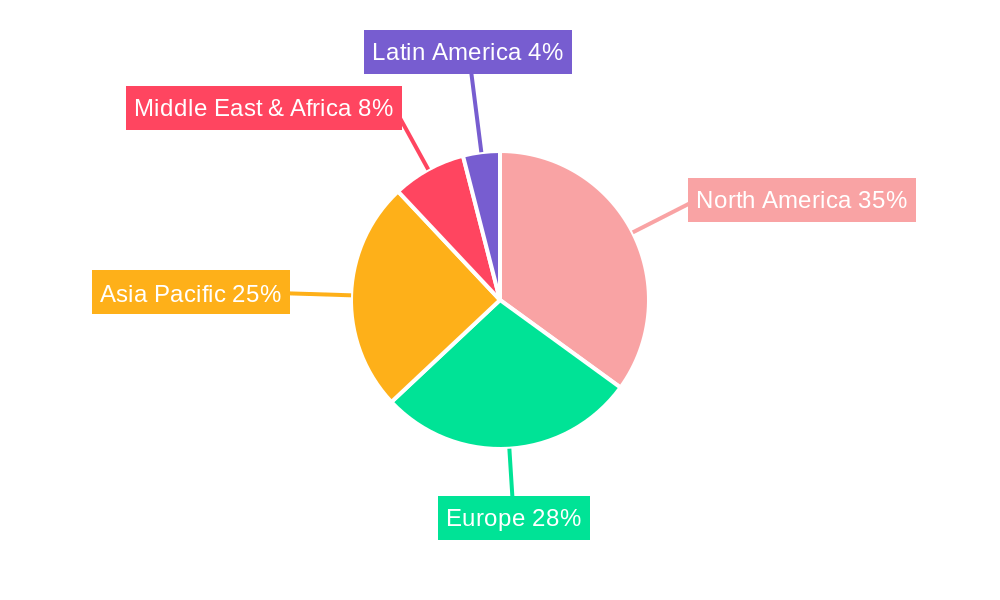
The North American region dominates the global ALPR camera market, accounting for an estimated xx% market share in 2025. This dominance is attributed to the following:
- Robust infrastructure: Extensive highway systems and well-developed urban areas provide ample deployment opportunities.
- High security concerns: Growing concerns about crime and terrorism drive investment in security solutions.
- Favorable regulatory environment: Supportive government policies and funding initiatives accelerate market adoption.
- Technological advancement: North America boasts a strong technological base, promoting innovation in ALPR technology.
This market segment also includes substantial growth in Europe and Asia-Pacific regions, driven by similar factors such as expanding urban infrastructure, increasing security threats, and government investments in smart city technologies. The segment related to law enforcement applications holds a significant market share, followed by parking management and traffic monitoring.
Automatic License Plate Recognition Camera Product Innovations
Recent product innovations focus on improving image processing algorithms using AI and deep learning to enhance accuracy and speed, especially in challenging conditions (low light, poor weather). The integration of cloud-based analytics provides powerful data visualization and reporting capabilities. Miniaturization of hardware allows for seamless integration into various environments. Many new ALPR systems offer advanced features such as license plate recognition across multiple lanes, real-time alerts, and integration with other security systems. This enhanced functionality allows improved operational efficiency and provides more effective surveillance.
Report Segmentation & Scope
The report segments the ALPR camera market based on several parameters:
By Product Type: Fixed ALPR cameras, Mobile ALPR cameras, Handheld ALPR cameras. Each segment shows varying growth rates driven by the specific applications and user demands. Fixed cameras dominate in terms of market share due to their widespread use in security systems, while mobile ALPR systems are increasingly adopted for enforcement and patrol applications.
By Application: Law Enforcement, Traffic Management, Parking Management, Border Control, Access Control. The law enforcement segment holds the largest market share due to the high demand for improved crime prevention and investigation tools.
By Geography: North America, Europe, Asia-Pacific, Middle East & Africa, South America.
Key Drivers of Automatic License Plate Recognition Camera Growth
The ALPR camera market growth is primarily fueled by several factors:
- Increased security concerns: Rising crime rates and terrorism threats drive demand for enhanced security systems.
- Smart city initiatives: Government investments in smart city infrastructure create opportunities for ALPR deployment.
- Technological advancements: Improvements in image processing and AI boost ALPR system accuracy and efficiency.
- Stringent traffic management regulations: Government regulations concerning traffic violations are driving ALPR adoption for efficient enforcement.
Challenges in the Automatic License Plate Recognition Camera Sector
Challenges hindering market growth include:
- High initial investment costs: The setup of ALPR systems can require significant upfront investment, limiting adoption by smaller organizations.
- Data privacy concerns: Concerns around data privacy and the potential misuse of ALPR data need to be addressed through robust data security measures and clear regulatory frameworks.
- Accuracy limitations in challenging conditions: ALPR systems can struggle with accuracy in poor weather conditions or low-light environments, requiring continuous improvements in image processing technology.
Leading Players in the Automatic License Plate Recognition Camera Market
- Siemens
- Rekor
- Jenoptik
- Vivotek
- Neology
- Survision
- Genetec
- Kapsch TrafficCom
- ARH
- Bosch Security Systems
- Q-free (Dacolian)
- NDI Recognition Systems
- Tattile
- Perceptics
- GeoVision
- HTS
- Leonardo Company
- TagMaster
- MAV Systems
- Nedap
- Petards Group
- ParkingEye Limited
- Arvoo Imaging Products
- Inex Tech
- Digital Recognition Systems
Key Developments in Automatic License Plate Recognition Camera Sector
- January 2023: Company X launched a new ALPR camera with advanced AI capabilities.
- April 2022: Company Y acquired Company Z, expanding its product portfolio and market reach.
- October 2021: New regulations regarding data privacy were implemented in Country A, influencing the adoption of ALPR systems.
- Further key developments will be included in the full report.
Strategic Automatic License Plate Recognition Camera Market Outlook
The ALPR camera market presents significant growth potential driven by continuous technological advancements and the rising demand for intelligent transportation and security solutions. Strategic opportunities exist for companies that can innovate in areas such as AI-powered image processing, cloud-based analytics, and seamless system integration. Focus on addressing data privacy concerns and developing cost-effective solutions will be key to unlocking market growth. The integration of ALPR technology with other smart city infrastructure will play a crucial role in the continued expansion of this market.
Automatic License Plate Recognition Camera Segmentation
-
1. Application
- 1.1. Traffic Management& Law Enforcement
- 1.2. Electronic Toll Collection
- 1.3. Car Park Management
- 1.4. Others
-
2. Types
- 2.1. Mobile Type
- 2.2. Fixed Type
- 2.3. Portable Type
Automatic License Plate Recognition Camera Segmentation By Geography
-
1. North America
- 1.1. United States
- 1.2. Canada
- 1.3. Mexico
-
2. South America
- 2.1. Brazil
- 2.2. Argentina
- 2.3. Rest of South America
-
3. Europe
- 3.1. United Kingdom
- 3.2. Germany
- 3.3. France
- 3.4. Italy
- 3.5. Spain
- 3.6. Russia
- 3.7. Benelux
- 3.8. Nordics
- 3.9. Rest of Europe
-
4. Middle East & Africa
- 4.1. Turkey
- 4.2. Israel
- 4.3. GCC
- 4.4. North Africa
- 4.5. South Africa
- 4.6. Rest of Middle East & Africa
-
5. Asia Pacific
- 5.1. China
- 5.2. India
- 5.3. Japan
- 5.4. South Korea
- 5.5. ASEAN
- 5.6. Oceania
- 5.7. Rest of Asia Pacific
Automatic License Plate Recognition Camera REPORT HIGHLIGHTS
| Aspects | Details |
|---|---|
| Study Period | 2019-2033 |
| Base Year | 2024 |
| Estimated Year | 2025 |
| Forecast Period | 2025-2033 |
| Historical Period | 2019-2024 |
| Growth Rate | CAGR of XX% from 2019-2033 |
| Segmentation |
|
Table of Contents
- 1. Introduction
- 1.1. Research Scope
- 1.2. Market Segmentation
- 1.3. Research Methodology
- 1.4. Definitions and Assumptions
- 2. Executive Summary
- 2.1. Introduction
- 3. Market Dynamics
- 3.1. Introduction
- 3.2. Market Drivers
- 3.3. Market Restrains
- 3.4. Market Trends
- 4. Market Factor Analysis
- 4.1. Porters Five Forces
- 4.2. Supply/Value Chain
- 4.3. PESTEL analysis
- 4.4. Market Entropy
- 4.5. Patent/Trademark Analysis
- 5. Global Automatic License Plate Recognition Camera Analysis, Insights and Forecast, 2019-2031
- 5.1. Market Analysis, Insights and Forecast - by Application
- 5.1.1. Traffic Management& Law Enforcement
- 5.1.2. Electronic Toll Collection
- 5.1.3. Car Park Management
- 5.1.4. Others
- 5.2. Market Analysis, Insights and Forecast - by Types
- 5.2.1. Mobile Type
- 5.2.2. Fixed Type
- 5.2.3. Portable Type
- 5.3. Market Analysis, Insights and Forecast - by Region
- 5.3.1. North America
- 5.3.2. South America
- 5.3.3. Europe
- 5.3.4. Middle East & Africa
- 5.3.5. Asia Pacific
- 5.1. Market Analysis, Insights and Forecast - by Application
- 6. North America Automatic License Plate Recognition Camera Analysis, Insights and Forecast, 2019-2031
- 6.1. Market Analysis, Insights and Forecast - by Application
- 6.1.1. Traffic Management& Law Enforcement
- 6.1.2. Electronic Toll Collection
- 6.1.3. Car Park Management
- 6.1.4. Others
- 6.2. Market Analysis, Insights and Forecast - by Types
- 6.2.1. Mobile Type
- 6.2.2. Fixed Type
- 6.2.3. Portable Type
- 6.1. Market Analysis, Insights and Forecast - by Application
- 7. South America Automatic License Plate Recognition Camera Analysis, Insights and Forecast, 2019-2031
- 7.1. Market Analysis, Insights and Forecast - by Application
- 7.1.1. Traffic Management& Law Enforcement
- 7.1.2. Electronic Toll Collection
- 7.1.3. Car Park Management
- 7.1.4. Others
- 7.2. Market Analysis, Insights and Forecast - by Types
- 7.2.1. Mobile Type
- 7.2.2. Fixed Type
- 7.2.3. Portable Type
- 7.1. Market Analysis, Insights and Forecast - by Application
- 8. Europe Automatic License Plate Recognition Camera Analysis, Insights and Forecast, 2019-2031
- 8.1. Market Analysis, Insights and Forecast - by Application
- 8.1.1. Traffic Management& Law Enforcement
- 8.1.2. Electronic Toll Collection
- 8.1.3. Car Park Management
- 8.1.4. Others
- 8.2. Market Analysis, Insights and Forecast - by Types
- 8.2.1. Mobile Type
- 8.2.2. Fixed Type
- 8.2.3. Portable Type
- 8.1. Market Analysis, Insights and Forecast - by Application
- 9. Middle East & Africa Automatic License Plate Recognition Camera Analysis, Insights and Forecast, 2019-2031
- 9.1. Market Analysis, Insights and Forecast - by Application
- 9.1.1. Traffic Management& Law Enforcement
- 9.1.2. Electronic Toll Collection
- 9.1.3. Car Park Management
- 9.1.4. Others
- 9.2. Market Analysis, Insights and Forecast - by Types
- 9.2.1. Mobile Type
- 9.2.2. Fixed Type
- 9.2.3. Portable Type
- 9.1. Market Analysis, Insights and Forecast - by Application
- 10. Asia Pacific Automatic License Plate Recognition Camera Analysis, Insights and Forecast, 2019-2031
- 10.1. Market Analysis, Insights and Forecast - by Application
- 10.1.1. Traffic Management& Law Enforcement
- 10.1.2. Electronic Toll Collection
- 10.1.3. Car Park Management
- 10.1.4. Others
- 10.2. Market Analysis, Insights and Forecast - by Types
- 10.2.1. Mobile Type
- 10.2.2. Fixed Type
- 10.2.3. Portable Type
- 10.1. Market Analysis, Insights and Forecast - by Application
- 11. Competitive Analysis
- 11.1. Global Market Share Analysis 2024
- 11.2. Company Profiles
- 11.2.1 Siemens
- 11.2.1.1. Overview
- 11.2.1.2. Products
- 11.2.1.3. SWOT Analysis
- 11.2.1.4. Recent Developments
- 11.2.1.5. Financials (Based on Availability)
- 11.2.2 Rekor
- 11.2.2.1. Overview
- 11.2.2.2. Products
- 11.2.2.3. SWOT Analysis
- 11.2.2.4. Recent Developments
- 11.2.2.5. Financials (Based on Availability)
- 11.2.3 Jenoptik
- 11.2.3.1. Overview
- 11.2.3.2. Products
- 11.2.3.3. SWOT Analysis
- 11.2.3.4. Recent Developments
- 11.2.3.5. Financials (Based on Availability)
- 11.2.4 Vivotek
- 11.2.4.1. Overview
- 11.2.4.2. Products
- 11.2.4.3. SWOT Analysis
- 11.2.4.4. Recent Developments
- 11.2.4.5. Financials (Based on Availability)
- 11.2.5 Neology
- 11.2.5.1. Overview
- 11.2.5.2. Products
- 11.2.5.3. SWOT Analysis
- 11.2.5.4. Recent Developments
- 11.2.5.5. Financials (Based on Availability)
- 11.2.6 Survision
- 11.2.6.1. Overview
- 11.2.6.2. Products
- 11.2.6.3. SWOT Analysis
- 11.2.6.4. Recent Developments
- 11.2.6.5. Financials (Based on Availability)
- 11.2.7 Genetec
- 11.2.7.1. Overview
- 11.2.7.2. Products
- 11.2.7.3. SWOT Analysis
- 11.2.7.4. Recent Developments
- 11.2.7.5. Financials (Based on Availability)
- 11.2.8 Kapsch TrafficCom
- 11.2.8.1. Overview
- 11.2.8.2. Products
- 11.2.8.3. SWOT Analysis
- 11.2.8.4. Recent Developments
- 11.2.8.5. Financials (Based on Availability)
- 11.2.9 ARH
- 11.2.9.1. Overview
- 11.2.9.2. Products
- 11.2.9.3. SWOT Analysis
- 11.2.9.4. Recent Developments
- 11.2.9.5. Financials (Based on Availability)
- 11.2.10 Bosch Security Systems
- 11.2.10.1. Overview
- 11.2.10.2. Products
- 11.2.10.3. SWOT Analysis
- 11.2.10.4. Recent Developments
- 11.2.10.5. Financials (Based on Availability)
- 11.2.11 Q-free (Dacolian)
- 11.2.11.1. Overview
- 11.2.11.2. Products
- 11.2.11.3. SWOT Analysis
- 11.2.11.4. Recent Developments
- 11.2.11.5. Financials (Based on Availability)
- 11.2.12 NDI Recognition Systems
- 11.2.12.1. Overview
- 11.2.12.2. Products
- 11.2.12.3. SWOT Analysis
- 11.2.12.4. Recent Developments
- 11.2.12.5. Financials (Based on Availability)
- 11.2.13 Tattile
- 11.2.13.1. Overview
- 11.2.13.2. Products
- 11.2.13.3. SWOT Analysis
- 11.2.13.4. Recent Developments
- 11.2.13.5. Financials (Based on Availability)
- 11.2.14 Perceptics
- 11.2.14.1. Overview
- 11.2.14.2. Products
- 11.2.14.3. SWOT Analysis
- 11.2.14.4. Recent Developments
- 11.2.14.5. Financials (Based on Availability)
- 11.2.15 GeoVision
- 11.2.15.1. Overview
- 11.2.15.2. Products
- 11.2.15.3. SWOT Analysis
- 11.2.15.4. Recent Developments
- 11.2.15.5. Financials (Based on Availability)
- 11.2.16 HTS
- 11.2.16.1. Overview
- 11.2.16.2. Products
- 11.2.16.3. SWOT Analysis
- 11.2.16.4. Recent Developments
- 11.2.16.5. Financials (Based on Availability)
- 11.2.17 Leonardo Company
- 11.2.17.1. Overview
- 11.2.17.2. Products
- 11.2.17.3. SWOT Analysis
- 11.2.17.4. Recent Developments
- 11.2.17.5. Financials (Based on Availability)
- 11.2.18 TagMaster
- 11.2.18.1. Overview
- 11.2.18.2. Products
- 11.2.18.3. SWOT Analysis
- 11.2.18.4. Recent Developments
- 11.2.18.5. Financials (Based on Availability)
- 11.2.19 MAV Systems
- 11.2.19.1. Overview
- 11.2.19.2. Products
- 11.2.19.3. SWOT Analysis
- 11.2.19.4. Recent Developments
- 11.2.19.5. Financials (Based on Availability)
- 11.2.20 Nedap
- 11.2.20.1. Overview
- 11.2.20.2. Products
- 11.2.20.3. SWOT Analysis
- 11.2.20.4. Recent Developments
- 11.2.20.5. Financials (Based on Availability)
- 11.2.21 Petards Group
- 11.2.21.1. Overview
- 11.2.21.2. Products
- 11.2.21.3. SWOT Analysis
- 11.2.21.4. Recent Developments
- 11.2.21.5. Financials (Based on Availability)
- 11.2.22 ParkingEye Limited
- 11.2.22.1. Overview
- 11.2.22.2. Products
- 11.2.22.3. SWOT Analysis
- 11.2.22.4. Recent Developments
- 11.2.22.5. Financials (Based on Availability)
- 11.2.23 Arvoo Imaging Products
- 11.2.23.1. Overview
- 11.2.23.2. Products
- 11.2.23.3. SWOT Analysis
- 11.2.23.4. Recent Developments
- 11.2.23.5. Financials (Based on Availability)
- 11.2.24 Inex Tech
- 11.2.24.1. Overview
- 11.2.24.2. Products
- 11.2.24.3. SWOT Analysis
- 11.2.24.4. Recent Developments
- 11.2.24.5. Financials (Based on Availability)
- 11.2.25 Digital Recognition Systems
- 11.2.25.1. Overview
- 11.2.25.2. Products
- 11.2.25.3. SWOT Analysis
- 11.2.25.4. Recent Developments
- 11.2.25.5. Financials (Based on Availability)
- 11.2.1 Siemens
List of Figures
- Figure 1: Global Automatic License Plate Recognition Camera Revenue Breakdown (million, %) by Region 2024 & 2032
- Figure 2: Global Automatic License Plate Recognition Camera Volume Breakdown (K, %) by Region 2024 & 2032
- Figure 3: North America Automatic License Plate Recognition Camera Revenue (million), by Application 2024 & 2032
- Figure 4: North America Automatic License Plate Recognition Camera Volume (K), by Application 2024 & 2032
- Figure 5: North America Automatic License Plate Recognition Camera Revenue Share (%), by Application 2024 & 2032
- Figure 6: North America Automatic License Plate Recognition Camera Volume Share (%), by Application 2024 & 2032
- Figure 7: North America Automatic License Plate Recognition Camera Revenue (million), by Types 2024 & 2032
- Figure 8: North America Automatic License Plate Recognition Camera Volume (K), by Types 2024 & 2032
- Figure 9: North America Automatic License Plate Recognition Camera Revenue Share (%), by Types 2024 & 2032
- Figure 10: North America Automatic License Plate Recognition Camera Volume Share (%), by Types 2024 & 2032
- Figure 11: North America Automatic License Plate Recognition Camera Revenue (million), by Country 2024 & 2032
- Figure 12: North America Automatic License Plate Recognition Camera Volume (K), by Country 2024 & 2032
- Figure 13: North America Automatic License Plate Recognition Camera Revenue Share (%), by Country 2024 & 2032
- Figure 14: North America Automatic License Plate Recognition Camera Volume Share (%), by Country 2024 & 2032
- Figure 15: South America Automatic License Plate Recognition Camera Revenue (million), by Application 2024 & 2032
- Figure 16: South America Automatic License Plate Recognition Camera Volume (K), by Application 2024 & 2032
- Figure 17: South America Automatic License Plate Recognition Camera Revenue Share (%), by Application 2024 & 2032
- Figure 18: South America Automatic License Plate Recognition Camera Volume Share (%), by Application 2024 & 2032
- Figure 19: South America Automatic License Plate Recognition Camera Revenue (million), by Types 2024 & 2032
- Figure 20: South America Automatic License Plate Recognition Camera Volume (K), by Types 2024 & 2032
- Figure 21: South America Automatic License Plate Recognition Camera Revenue Share (%), by Types 2024 & 2032
- Figure 22: South America Automatic License Plate Recognition Camera Volume Share (%), by Types 2024 & 2032
- Figure 23: South America Automatic License Plate Recognition Camera Revenue (million), by Country 2024 & 2032
- Figure 24: South America Automatic License Plate Recognition Camera Volume (K), by Country 2024 & 2032
- Figure 25: South America Automatic License Plate Recognition Camera Revenue Share (%), by Country 2024 & 2032
- Figure 26: South America Automatic License Plate Recognition Camera Volume Share (%), by Country 2024 & 2032
- Figure 27: Europe Automatic License Plate Recognition Camera Revenue (million), by Application 2024 & 2032
- Figure 28: Europe Automatic License Plate Recognition Camera Volume (K), by Application 2024 & 2032
- Figure 29: Europe Automatic License Plate Recognition Camera Revenue Share (%), by Application 2024 & 2032
- Figure 30: Europe Automatic License Plate Recognition Camera Volume Share (%), by Application 2024 & 2032
- Figure 31: Europe Automatic License Plate Recognition Camera Revenue (million), by Types 2024 & 2032
- Figure 32: Europe Automatic License Plate Recognition Camera Volume (K), by Types 2024 & 2032
- Figure 33: Europe Automatic License Plate Recognition Camera Revenue Share (%), by Types 2024 & 2032
- Figure 34: Europe Automatic License Plate Recognition Camera Volume Share (%), by Types 2024 & 2032
- Figure 35: Europe Automatic License Plate Recognition Camera Revenue (million), by Country 2024 & 2032
- Figure 36: Europe Automatic License Plate Recognition Camera Volume (K), by Country 2024 & 2032
- Figure 37: Europe Automatic License Plate Recognition Camera Revenue Share (%), by Country 2024 & 2032
- Figure 38: Europe Automatic License Plate Recognition Camera Volume Share (%), by Country 2024 & 2032
- Figure 39: Middle East & Africa Automatic License Plate Recognition Camera Revenue (million), by Application 2024 & 2032
- Figure 40: Middle East & Africa Automatic License Plate Recognition Camera Volume (K), by Application 2024 & 2032
- Figure 41: Middle East & Africa Automatic License Plate Recognition Camera Revenue Share (%), by Application 2024 & 2032
- Figure 42: Middle East & Africa Automatic License Plate Recognition Camera Volume Share (%), by Application 2024 & 2032
- Figure 43: Middle East & Africa Automatic License Plate Recognition Camera Revenue (million), by Types 2024 & 2032
- Figure 44: Middle East & Africa Automatic License Plate Recognition Camera Volume (K), by Types 2024 & 2032
- Figure 45: Middle East & Africa Automatic License Plate Recognition Camera Revenue Share (%), by Types 2024 & 2032
- Figure 46: Middle East & Africa Automatic License Plate Recognition Camera Volume Share (%), by Types 2024 & 2032
- Figure 47: Middle East & Africa Automatic License Plate Recognition Camera Revenue (million), by Country 2024 & 2032
- Figure 48: Middle East & Africa Automatic License Plate Recognition Camera Volume (K), by Country 2024 & 2032
- Figure 49: Middle East & Africa Automatic License Plate Recognition Camera Revenue Share (%), by Country 2024 & 2032
- Figure 50: Middle East & Africa Automatic License Plate Recognition Camera Volume Share (%), by Country 2024 & 2032
- Figure 51: Asia Pacific Automatic License Plate Recognition Camera Revenue (million), by Application 2024 & 2032
- Figure 52: Asia Pacific Automatic License Plate Recognition Camera Volume (K), by Application 2024 & 2032
- Figure 53: Asia Pacific Automatic License Plate Recognition Camera Revenue Share (%), by Application 2024 & 2032
- Figure 54: Asia Pacific Automatic License Plate Recognition Camera Volume Share (%), by Application 2024 & 2032
- Figure 55: Asia Pacific Automatic License Plate Recognition Camera Revenue (million), by Types 2024 & 2032
- Figure 56: Asia Pacific Automatic License Plate Recognition Camera Volume (K), by Types 2024 & 2032
- Figure 57: Asia Pacific Automatic License Plate Recognition Camera Revenue Share (%), by Types 2024 & 2032
- Figure 58: Asia Pacific Automatic License Plate Recognition Camera Volume Share (%), by Types 2024 & 2032
- Figure 59: Asia Pacific Automatic License Plate Recognition Camera Revenue (million), by Country 2024 & 2032
- Figure 60: Asia Pacific Automatic License Plate Recognition Camera Volume (K), by Country 2024 & 2032
- Figure 61: Asia Pacific Automatic License Plate Recognition Camera Revenue Share (%), by Country 2024 & 2032
- Figure 62: Asia Pacific Automatic License Plate Recognition Camera Volume Share (%), by Country 2024 & 2032
List of Tables
- Table 1: Global Automatic License Plate Recognition Camera Revenue million Forecast, by Region 2019 & 2032
- Table 2: Global Automatic License Plate Recognition Camera Volume K Forecast, by Region 2019 & 2032
- Table 3: Global Automatic License Plate Recognition Camera Revenue million Forecast, by Application 2019 & 2032
- Table 4: Global Automatic License Plate Recognition Camera Volume K Forecast, by Application 2019 & 2032
- Table 5: Global Automatic License Plate Recognition Camera Revenue million Forecast, by Types 2019 & 2032
- Table 6: Global Automatic License Plate Recognition Camera Volume K Forecast, by Types 2019 & 2032
- Table 7: Global Automatic License Plate Recognition Camera Revenue million Forecast, by Region 2019 & 2032
- Table 8: Global Automatic License Plate Recognition Camera Volume K Forecast, by Region 2019 & 2032
- Table 9: Global Automatic License Plate Recognition Camera Revenue million Forecast, by Application 2019 & 2032
- Table 10: Global Automatic License Plate Recognition Camera Volume K Forecast, by Application 2019 & 2032
- Table 11: Global Automatic License Plate Recognition Camera Revenue million Forecast, by Types 2019 & 2032
- Table 12: Global Automatic License Plate Recognition Camera Volume K Forecast, by Types 2019 & 2032
- Table 13: Global Automatic License Plate Recognition Camera Revenue million Forecast, by Country 2019 & 2032
- Table 14: Global Automatic License Plate Recognition Camera Volume K Forecast, by Country 2019 & 2032
- Table 15: United States Automatic License Plate Recognition Camera Revenue (million) Forecast, by Application 2019 & 2032
- Table 16: United States Automatic License Plate Recognition Camera Volume (K) Forecast, by Application 2019 & 2032
- Table 17: Canada Automatic License Plate Recognition Camera Revenue (million) Forecast, by Application 2019 & 2032
- Table 18: Canada Automatic License Plate Recognition Camera Volume (K) Forecast, by Application 2019 & 2032
- Table 19: Mexico Automatic License Plate Recognition Camera Revenue (million) Forecast, by Application 2019 & 2032
- Table 20: Mexico Automatic License Plate Recognition Camera Volume (K) Forecast, by Application 2019 & 2032
- Table 21: Global Automatic License Plate Recognition Camera Revenue million Forecast, by Application 2019 & 2032
- Table 22: Global Automatic License Plate Recognition Camera Volume K Forecast, by Application 2019 & 2032
- Table 23: Global Automatic License Plate Recognition Camera Revenue million Forecast, by Types 2019 & 2032
- Table 24: Global Automatic License Plate Recognition Camera Volume K Forecast, by Types 2019 & 2032
- Table 25: Global Automatic License Plate Recognition Camera Revenue million Forecast, by Country 2019 & 2032
- Table 26: Global Automatic License Plate Recognition Camera Volume K Forecast, by Country 2019 & 2032
- Table 27: Brazil Automatic License Plate Recognition Camera Revenue (million) Forecast, by Application 2019 & 2032
- Table 28: Brazil Automatic License Plate Recognition Camera Volume (K) Forecast, by Application 2019 & 2032
- Table 29: Argentina Automatic License Plate Recognition Camera Revenue (million) Forecast, by Application 2019 & 2032
- Table 30: Argentina Automatic License Plate Recognition Camera Volume (K) Forecast, by Application 2019 & 2032
- Table 31: Rest of South America Automatic License Plate Recognition Camera Revenue (million) Forecast, by Application 2019 & 2032
- Table 32: Rest of South America Automatic License Plate Recognition Camera Volume (K) Forecast, by Application 2019 & 2032
- Table 33: Global Automatic License Plate Recognition Camera Revenue million Forecast, by Application 2019 & 2032
- Table 34: Global Automatic License Plate Recognition Camera Volume K Forecast, by Application 2019 & 2032
- Table 35: Global Automatic License Plate Recognition Camera Revenue million Forecast, by Types 2019 & 2032
- Table 36: Global Automatic License Plate Recognition Camera Volume K Forecast, by Types 2019 & 2032
- Table 37: Global Automatic License Plate Recognition Camera Revenue million Forecast, by Country 2019 & 2032
- Table 38: Global Automatic License Plate Recognition Camera Volume K Forecast, by Country 2019 & 2032
- Table 39: United Kingdom Automatic License Plate Recognition Camera Revenue (million) Forecast, by Application 2019 & 2032
- Table 40: United Kingdom Automatic License Plate Recognition Camera Volume (K) Forecast, by Application 2019 & 2032
- Table 41: Germany Automatic License Plate Recognition Camera Revenue (million) Forecast, by Application 2019 & 2032
- Table 42: Germany Automatic License Plate Recognition Camera Volume (K) Forecast, by Application 2019 & 2032
- Table 43: France Automatic License Plate Recognition Camera Revenue (million) Forecast, by Application 2019 & 2032
- Table 44: France Automatic License Plate Recognition Camera Volume (K) Forecast, by Application 2019 & 2032
- Table 45: Italy Automatic License Plate Recognition Camera Revenue (million) Forecast, by Application 2019 & 2032
- Table 46: Italy Automatic License Plate Recognition Camera Volume (K) Forecast, by Application 2019 & 2032
- Table 47: Spain Automatic License Plate Recognition Camera Revenue (million) Forecast, by Application 2019 & 2032
- Table 48: Spain Automatic License Plate Recognition Camera Volume (K) Forecast, by Application 2019 & 2032
- Table 49: Russia Automatic License Plate Recognition Camera Revenue (million) Forecast, by Application 2019 & 2032
- Table 50: Russia Automatic License Plate Recognition Camera Volume (K) Forecast, by Application 2019 & 2032
- Table 51: Benelux Automatic License Plate Recognition Camera Revenue (million) Forecast, by Application 2019 & 2032
- Table 52: Benelux Automatic License Plate Recognition Camera Volume (K) Forecast, by Application 2019 & 2032
- Table 53: Nordics Automatic License Plate Recognition Camera Revenue (million) Forecast, by Application 2019 & 2032
- Table 54: Nordics Automatic License Plate Recognition Camera Volume (K) Forecast, by Application 2019 & 2032
- Table 55: Rest of Europe Automatic License Plate Recognition Camera Revenue (million) Forecast, by Application 2019 & 2032
- Table 56: Rest of Europe Automatic License Plate Recognition Camera Volume (K) Forecast, by Application 2019 & 2032
- Table 57: Global Automatic License Plate Recognition Camera Revenue million Forecast, by Application 2019 & 2032
- Table 58: Global Automatic License Plate Recognition Camera Volume K Forecast, by Application 2019 & 2032
- Table 59: Global Automatic License Plate Recognition Camera Revenue million Forecast, by Types 2019 & 2032
- Table 60: Global Automatic License Plate Recognition Camera Volume K Forecast, by Types 2019 & 2032
- Table 61: Global Automatic License Plate Recognition Camera Revenue million Forecast, by Country 2019 & 2032
- Table 62: Global Automatic License Plate Recognition Camera Volume K Forecast, by Country 2019 & 2032
- Table 63: Turkey Automatic License Plate Recognition Camera Revenue (million) Forecast, by Application 2019 & 2032
- Table 64: Turkey Automatic License Plate Recognition Camera Volume (K) Forecast, by Application 2019 & 2032
- Table 65: Israel Automatic License Plate Recognition Camera Revenue (million) Forecast, by Application 2019 & 2032
- Table 66: Israel Automatic License Plate Recognition Camera Volume (K) Forecast, by Application 2019 & 2032
- Table 67: GCC Automatic License Plate Recognition Camera Revenue (million) Forecast, by Application 2019 & 2032
- Table 68: GCC Automatic License Plate Recognition Camera Volume (K) Forecast, by Application 2019 & 2032
- Table 69: North Africa Automatic License Plate Recognition Camera Revenue (million) Forecast, by Application 2019 & 2032
- Table 70: North Africa Automatic License Plate Recognition Camera Volume (K) Forecast, by Application 2019 & 2032
- Table 71: South Africa Automatic License Plate Recognition Camera Revenue (million) Forecast, by Application 2019 & 2032
- Table 72: South Africa Automatic License Plate Recognition Camera Volume (K) Forecast, by Application 2019 & 2032
- Table 73: Rest of Middle East & Africa Automatic License Plate Recognition Camera Revenue (million) Forecast, by Application 2019 & 2032
- Table 74: Rest of Middle East & Africa Automatic License Plate Recognition Camera Volume (K) Forecast, by Application 2019 & 2032
- Table 75: Global Automatic License Plate Recognition Camera Revenue million Forecast, by Application 2019 & 2032
- Table 76: Global Automatic License Plate Recognition Camera Volume K Forecast, by Application 2019 & 2032
- Table 77: Global Automatic License Plate Recognition Camera Revenue million Forecast, by Types 2019 & 2032
- Table 78: Global Automatic License Plate Recognition Camera Volume K Forecast, by Types 2019 & 2032
- Table 79: Global Automatic License Plate Recognition Camera Revenue million Forecast, by Country 2019 & 2032
- Table 80: Global Automatic License Plate Recognition Camera Volume K Forecast, by Country 2019 & 2032
- Table 81: China Automatic License Plate Recognition Camera Revenue (million) Forecast, by Application 2019 & 2032
- Table 82: China Automatic License Plate Recognition Camera Volume (K) Forecast, by Application 2019 & 2032
- Table 83: India Automatic License Plate Recognition Camera Revenue (million) Forecast, by Application 2019 & 2032
- Table 84: India Automatic License Plate Recognition Camera Volume (K) Forecast, by Application 2019 & 2032
- Table 85: Japan Automatic License Plate Recognition Camera Revenue (million) Forecast, by Application 2019 & 2032
- Table 86: Japan Automatic License Plate Recognition Camera Volume (K) Forecast, by Application 2019 & 2032
- Table 87: South Korea Automatic License Plate Recognition Camera Revenue (million) Forecast, by Application 2019 & 2032
- Table 88: South Korea Automatic License Plate Recognition Camera Volume (K) Forecast, by Application 2019 & 2032
- Table 89: ASEAN Automatic License Plate Recognition Camera Revenue (million) Forecast, by Application 2019 & 2032
- Table 90: ASEAN Automatic License Plate Recognition Camera Volume (K) Forecast, by Application 2019 & 2032
- Table 91: Oceania Automatic License Plate Recognition Camera Revenue (million) Forecast, by Application 2019 & 2032
- Table 92: Oceania Automatic License Plate Recognition Camera Volume (K) Forecast, by Application 2019 & 2032
- Table 93: Rest of Asia Pacific Automatic License Plate Recognition Camera Revenue (million) Forecast, by Application 2019 & 2032
- Table 94: Rest of Asia Pacific Automatic License Plate Recognition Camera Volume (K) Forecast, by Application 2019 & 2032
Frequently Asked Questions
1. What is the projected Compound Annual Growth Rate (CAGR) of the Automatic License Plate Recognition Camera?
The projected CAGR is approximately XX%.
2. Which companies are prominent players in the Automatic License Plate Recognition Camera?
Key companies in the market include Siemens, Rekor, Jenoptik, Vivotek, Neology, Survision, Genetec, Kapsch TrafficCom, ARH, Bosch Security Systems, Q-free (Dacolian), NDI Recognition Systems, Tattile, Perceptics, GeoVision, HTS, Leonardo Company, TagMaster, MAV Systems, Nedap, Petards Group, ParkingEye Limited, Arvoo Imaging Products, Inex Tech, Digital Recognition Systems.
3. What are the main segments of the Automatic License Plate Recognition Camera?
The market segments include Application, Types.
4. Can you provide details about the market size?
The market size is estimated to be USD XXX million as of 2022.
5. What are some drivers contributing to market growth?
N/A
6. What are the notable trends driving market growth?
N/A
7. Are there any restraints impacting market growth?
N/A
8. Can you provide examples of recent developments in the market?
N/A
9. What pricing options are available for accessing the report?
Pricing options include single-user, multi-user, and enterprise licenses priced at USD 3350.00, USD 5025.00, and USD 6700.00 respectively.
10. Is the market size provided in terms of value or volume?
The market size is provided in terms of value, measured in million and volume, measured in K.
11. Are there any specific market keywords associated with the report?
Yes, the market keyword associated with the report is "Automatic License Plate Recognition Camera," which aids in identifying and referencing the specific market segment covered.
12. How do I determine which pricing option suits my needs best?
The pricing options vary based on user requirements and access needs. Individual users may opt for single-user licenses, while businesses requiring broader access may choose multi-user or enterprise licenses for cost-effective access to the report.
13. Are there any additional resources or data provided in the Automatic License Plate Recognition Camera report?
While the report offers comprehensive insights, it's advisable to review the specific contents or supplementary materials provided to ascertain if additional resources or data are available.
14. How can I stay updated on further developments or reports in the Automatic License Plate Recognition Camera?
To stay informed about further developments, trends, and reports in the Automatic License Plate Recognition Camera, consider subscribing to industry newsletters, following relevant companies and organizations, or regularly checking reputable industry news sources and publications.
Methodology
Step 1 - Identification of Relevant Samples Size from Population Database


Step 2 - Approaches for Defining Global Market Size (Value, Volume* & Price*)

Note*: In applicable scenarios
Step 3 - Data Sources
Primary Research
- Web Analytics
- Survey Reports
- Research Institute
- Latest Research Reports
- Opinion Leaders
Secondary Research
- Annual Reports
- White Paper
- Latest Press Release
- Industry Association
- Paid Database
- Investor Presentations

Step 4 - Data Triangulation
Involves using different sources of information in order to increase the validity of a study
These sources are likely to be stakeholders in a program - participants, other researchers, program staff, other community members, and so on.
Then we put all data in single framework & apply various statistical tools to find out the dynamic on the market.
During the analysis stage, feedback from the stakeholder groups would be compared to determine areas of agreement as well as areas of divergence


