
Key Insights
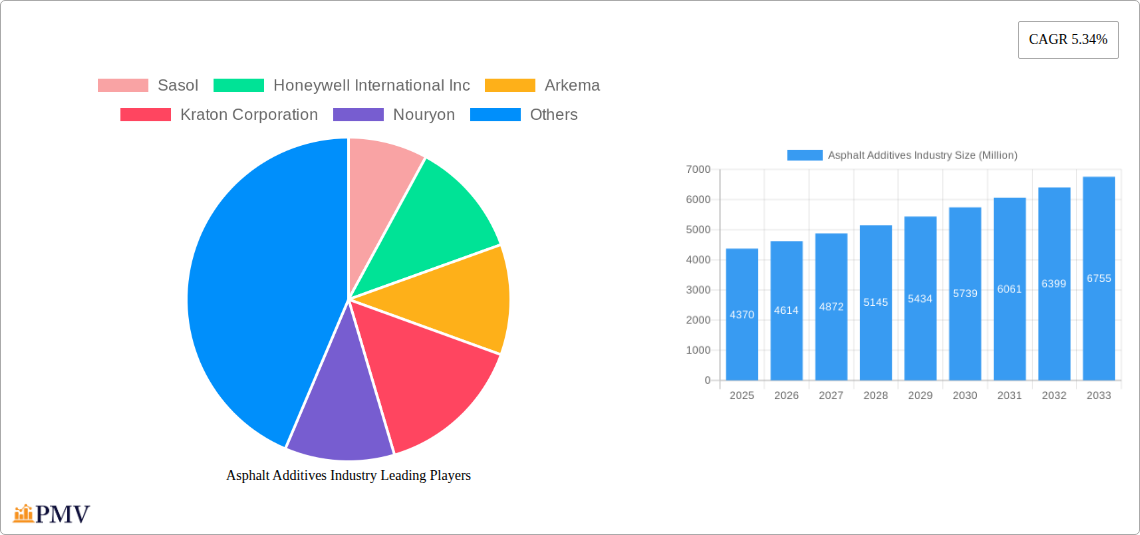
The asphalt additives market, valued at $4.37 billion in 2025, is projected to experience robust growth, driven by the expanding global infrastructure development and increasing demand for high-performance asphalt pavements. A Compound Annual Growth Rate (CAGR) of 5.34% from 2025 to 2033 indicates a significant market expansion, fueled by several key factors. The rising adoption of sustainable construction practices necessitates the use of modified asphalt binders that enhance durability and longevity, leading to increased demand for additives like polymers, fibers, and chemical modifiers. Furthermore, stringent government regulations regarding road safety and environmental concerns are prompting the adoption of advanced asphalt formulations incorporating specialized additives. This includes anti-strip modifiers, improving the adhesion between asphalt and aggregates, and extending the lifespan of roadways. Growth is further stimulated by innovations in additive technology, resulting in improved performance characteristics and cost-effectiveness. The increasing focus on improving the quality and lifespan of roads and pavements across various regions globally also underpins this market growth.
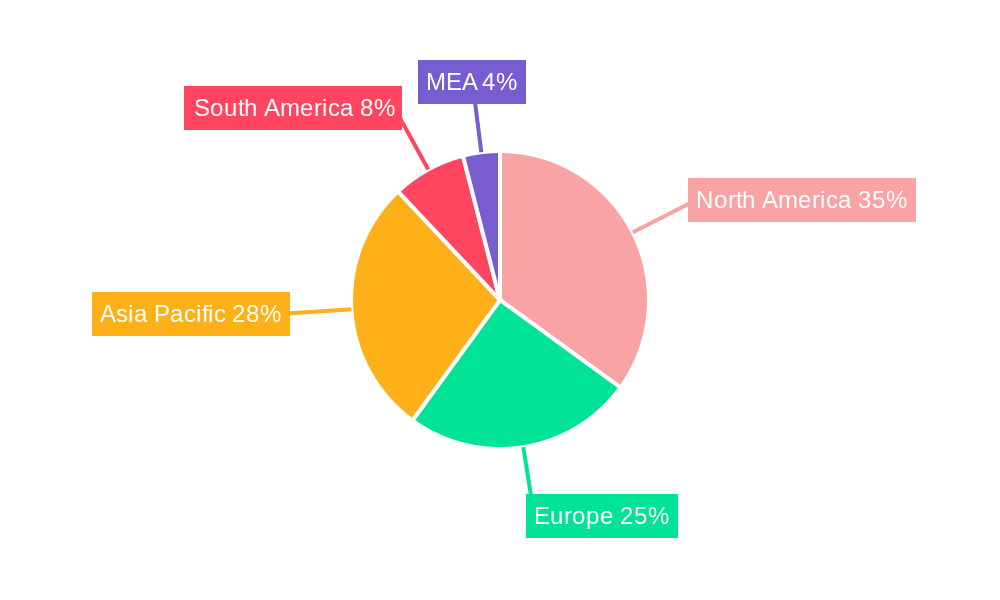
Segmentation within the market reveals significant opportunities across different applications and end-user industries. Paving applications constitute a major segment, followed by roofing and other applications. Among end-user industries, physical and chemical modifiers, fibers, and adhesion improvers are leading segments. The geographic distribution shows substantial market presence in North America, particularly the United States, driven by robust infrastructure spending. The Asia-Pacific region is also experiencing significant growth, fueled by rapid urbanization and infrastructure development in countries like China and India. While the market faces some constraints from fluctuating raw material prices and potential environmental concerns related to specific additives, the overall positive outlook for infrastructure development, coupled with technological advancements, ensures the asphalt additives market's continued growth trajectory over the forecast period.
Asphalt Additives Industry: A Comprehensive Market Report (2019-2033)
This in-depth report provides a comprehensive analysis of the Asphalt Additives industry, offering invaluable insights for stakeholders seeking to navigate this dynamic market. The study period covers 2019-2033, with 2025 as the base and estimated year. The forecast period is 2025-2033, and the historical period is 2019-2024. The report delves into market size, segmentation, competitive dynamics, and future growth prospects, incorporating detailed analysis of key players and emerging trends. The market is expected to reach xx Million by 2033, exhibiting a CAGR of xx% during the forecast period.
Asphalt Additives Industry Market Structure & Competitive Dynamics
The asphalt additives market is characterized by a moderately concentrated structure with several multinational corporations holding significant market share. Key players such as Sasol, Honeywell International Inc, Arkema, Kraton Corporation, Nouryon, Exxon Mobil Corporation, Evonik Industries AG, Cargill, BASF SE, DuPont, Dow, PQ Corporation, ArrMaz Products Inc, Engineered Additives LLC, Kao Corporation, McAsphalt Industries Limited, and Genan Holding A/S compete intensely, driving innovation and influencing pricing strategies. Market share is largely dictated by established brand reputation, technological advancements, and global reach.
- Market Concentration: The top 10 players account for approximately xx% of the global market share in 2025.
- Innovation Ecosystems: Significant investments in R&D are witnessed amongst major players focused on developing sustainable and high-performance additives.
- Regulatory Frameworks: Stringent environmental regulations across many regions are driving the development of eco-friendly additives.
- Product Substitutes: Bio-based alternatives are emerging as substitutes for traditional petroleum-based additives.
- End-User Trends: Growing demand for high-performance pavements and sustainable infrastructure is propelling market growth.
- M&A Activities: The industry has witnessed several mergers and acquisitions in recent years, valued at an estimated xx Million cumulatively, primarily aimed at expanding product portfolios and geographical reach.
Asphalt Additives Industry Trends & Insights
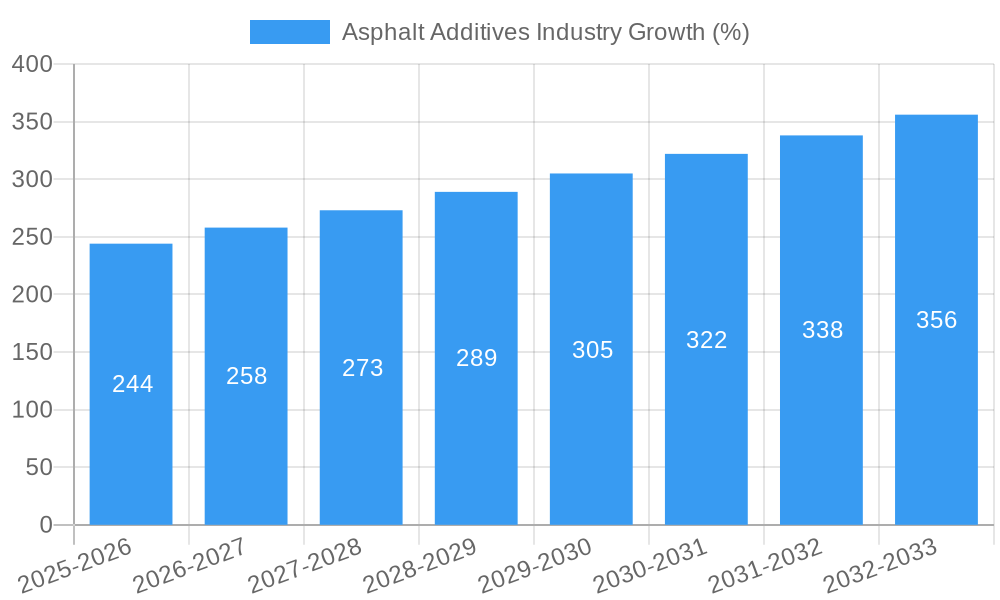
The asphalt additives market is experiencing robust growth, driven by the increasing demand for durable and sustainable infrastructure globally. Significant investments in road and building construction projects, particularly in developing economies, are fueling market expansion. The rising adoption of sustainable construction practices, coupled with stricter environmental regulations, is creating opportunities for eco-friendly additives. Technological advancements are leading to the development of high-performance additives that enhance the durability, longevity, and performance of asphalt pavements. The market's growth is further accelerated by increasing urbanization and rising vehicle traffic. Consumer preferences are shifting towards sustainable and eco-friendly solutions, leading to increased demand for bio-based and recycled asphalt additives. The competitive landscape remains intense, with key players focused on innovation, expansion, and strategic partnerships to strengthen their market position. This leads to a projected CAGR of xx% between 2025 and 2033, with market penetration expected to increase by xx% by 2033.
Dominant Markets & Segments in Asphalt Additives Industry
The paving segment currently dominates the application landscape, accounting for approximately xx% of the total market revenue in 2025, followed by roofing and other applications. Within end-user industries, physical modifiers hold the largest market share, followed by chemical modifiers and fibers. North America and Europe represent the dominant regional markets, driven by robust infrastructure development activities and stringent environmental regulations.
- Key Drivers in North America: Significant investments in infrastructure projects, coupled with stringent environmental regulations.
- Key Drivers in Europe: Government initiatives promoting sustainable construction practices and stringent environmental standards.
- Key Drivers in Asia-Pacific: Rapid urbanization, rising disposable incomes, and growing investments in infrastructure.
- Dominance Analysis: The dominance of paving and physical modifiers is attributed to their widespread use in conventional asphalt applications and their vital role in improving asphalt properties.
Asphalt Additives Industry Product Innovations
Recent innovations in asphalt additives focus on enhancing performance, durability, and sustainability. Key developments include the introduction of bio-based additives, recycled materials, and advanced polymer modifiers. These innovations improve the properties of asphalt pavements, reducing their environmental impact and extending their lifespan. The market is witnessing a trend towards specialized additives tailored to specific applications and environmental conditions, offering competitive advantages to manufacturers.
Report Segmentation & Scope
The report segments the asphalt additives market based on application (Paving, Roofing, Other Applications) and end-user industry (Physical Modifiers, Chemical Modifiers, Fibers, Adhesion Improvers, Extenders, Fillers, Antioxidants, Anti-strip Modifiers, Other End-user Industries). Each segment is analyzed in detail, providing insights into growth projections, market size, and competitive dynamics. For example, the paving segment is expected to witness significant growth driven by rising infrastructure spending, while the roofing segment offers considerable potential due to the growing need for durable roofing materials.
Key Drivers of Asphalt Additives Industry Growth
Several factors contribute to the growth of the asphalt additives market. These include: increasing investments in infrastructure development worldwide, particularly in emerging economies; stringent environmental regulations promoting the use of sustainable additives; technological advancements resulting in the development of high-performance additives; and growing demand for durable and long-lasting asphalt pavements. The shift towards sustainable construction practices is also a major catalyst.
Challenges in the Asphalt Additives Industry Sector
The asphalt additives industry faces several challenges, including fluctuations in raw material prices, stringent environmental regulations impacting production costs, and intense competition from existing and new market entrants. Supply chain disruptions and volatility in crude oil prices also pose considerable risks. Additionally, the industry faces pressure to continuously innovate and develop sustainable and cost-effective solutions.
Leading Players in the Asphalt Additives Industry Market
- Sasol
- Honeywell International Inc
- Arkema
- Kraton Corporation
- Nouryon
- Exxon Mobil Corporation
- Evonik Industries AG
- Cargill
- BASF SE
- DuPont
- Dow
- PQ Corporation
- ArrMaz Products Inc
- Engineered Additives LLC
- Kao Corporation
- McAsphalt Industries Limited
- Genan Holding A/S
Key Developments in Asphalt Additives Industry Sector
- July 2022: The Clinton County Road Commission's successful demonstration project using Biorestor, a soybean oil-based asphalt modifier, showcases the growing adoption of sustainable alternatives and their potential to extend pavement lifespan by up to 40%.
- January 2023: Dow's support for NAPA's "The Road Forward" initiative highlights the industry's commitment to achieving net-zero carbon emissions, driving innovation in sustainable asphalt additives.
Strategic Asphalt Additives Industry Market Outlook
The future of the asphalt additives market appears bright, driven by ongoing infrastructure development globally, the increasing adoption of sustainable construction practices, and continuous technological innovations. Strategic opportunities exist for companies focused on developing eco-friendly, high-performance additives, leveraging digital technologies for supply chain optimization, and expanding into emerging markets. The market presents significant potential for growth and profitability for companies that can adapt to evolving market dynamics and consumer preferences.
Asphalt Additives Industry Segmentation
-
1. Application
- 1.1. Paving
- 1.2. Roofing
- 1.3. Other Applications
-
2. End-user Industry
-
2.1. Physical Modifiers
- 2.1.1. Plastics
- 2.1.2. Rubbers
- 2.1.3. Other Physical Modifiers
- 2.2. Chemical Modifiers
- 2.3. Fibers
- 2.4. Adhesion Improvers
- 2.5. Extenders
- 2.6. Fillers
- 2.7. Antioxidants
- 2.8. Anti-strip Modifiers
- 2.9. Other End-user Industries
-
2.1. Physical Modifiers
Asphalt Additives Industry Segmentation By Geography
-
1. Asia Pacific
- 1.1. China
- 1.2. India
- 1.3. Japan
- 1.4. South Korea
- 1.5. Australia
- 1.6. Rest of Asia Pacific
-
2. North America
- 2.1. United States
- 2.2. Canada
- 2.3. Mexico
-
3. Europe
- 3.1. Germany
- 3.2. United Kingdom
- 3.3. Italy
- 3.4. France
- 3.5. Rest of Europe
-
4. South America
- 4.1. Brazil
- 4.2. Argentina
- 4.3. Colombia
- 4.4. Rest of South America
- 5. Middle East
-
6. Saudi Arabia
- 6.1. South Africa
- 6.2. Qatar
- 6.3. Rest of Middle East
Asphalt Additives Industry REPORT HIGHLIGHTS
| Aspects | Details |
|---|---|
| Study Period | 2019-2033 |
| Base Year | 2024 |
| Estimated Year | 2025 |
| Forecast Period | 2025-2033 |
| Historical Period | 2019-2024 |
| Growth Rate | CAGR of 5.34% from 2019-2033 |
| Segmentation |
|
Table of Contents
- 1. Introduction
- 1.1. Research Scope
- 1.2. Market Segmentation
- 1.3. Research Methodology
- 1.4. Definitions and Assumptions
- 2. Executive Summary
- 2.1. Introduction
- 3. Market Dynamics
- 3.1. Introduction
- 3.2. Market Drivers
- 3.2.1. High Traffic Volume and Heavier Loads; Emphasis on Meeting Super-save Design Specifications; Increased Pavement Work-life and Reduced MRO Cost Advantages
- 3.3. Market Restrains
- 3.3.1. High Initial Cost for Using Modified Asphalt Cement; Occupational Health Hazards Regarding Asphalt
- 3.4. Market Trends
- 3.4.1. Increasing Demand from Paving Application
- 4. Market Factor Analysis
- 4.1. Porters Five Forces
- 4.2. Supply/Value Chain
- 4.3. PESTEL analysis
- 4.4. Market Entropy
- 4.5. Patent/Trademark Analysis
- 5. Global Asphalt Additives Industry Analysis, Insights and Forecast, 2019-2031
- 5.1. Market Analysis, Insights and Forecast - by Application
- 5.1.1. Paving
- 5.1.2. Roofing
- 5.1.3. Other Applications
- 5.2. Market Analysis, Insights and Forecast - by End-user Industry
- 5.2.1. Physical Modifiers
- 5.2.1.1. Plastics
- 5.2.1.2. Rubbers
- 5.2.1.3. Other Physical Modifiers
- 5.2.2. Chemical Modifiers
- 5.2.3. Fibers
- 5.2.4. Adhesion Improvers
- 5.2.5. Extenders
- 5.2.6. Fillers
- 5.2.7. Antioxidants
- 5.2.8. Anti-strip Modifiers
- 5.2.9. Other End-user Industries
- 5.2.1. Physical Modifiers
- 5.3. Market Analysis, Insights and Forecast - by Region
- 5.3.1. Asia Pacific
- 5.3.2. North America
- 5.3.3. Europe
- 5.3.4. South America
- 5.3.5. Middle East
- 5.3.6. Saudi Arabia
- 5.1. Market Analysis, Insights and Forecast - by Application
- 6. Asia Pacific Asphalt Additives Industry Analysis, Insights and Forecast, 2019-2031
- 6.1. Market Analysis, Insights and Forecast - by Application
- 6.1.1. Paving
- 6.1.2. Roofing
- 6.1.3. Other Applications
- 6.2. Market Analysis, Insights and Forecast - by End-user Industry
- 6.2.1. Physical Modifiers
- 6.2.1.1. Plastics
- 6.2.1.2. Rubbers
- 6.2.1.3. Other Physical Modifiers
- 6.2.2. Chemical Modifiers
- 6.2.3. Fibers
- 6.2.4. Adhesion Improvers
- 6.2.5. Extenders
- 6.2.6. Fillers
- 6.2.7. Antioxidants
- 6.2.8. Anti-strip Modifiers
- 6.2.9. Other End-user Industries
- 6.2.1. Physical Modifiers
- 6.1. Market Analysis, Insights and Forecast - by Application
- 7. North America Asphalt Additives Industry Analysis, Insights and Forecast, 2019-2031
- 7.1. Market Analysis, Insights and Forecast - by Application
- 7.1.1. Paving
- 7.1.2. Roofing
- 7.1.3. Other Applications
- 7.2. Market Analysis, Insights and Forecast - by End-user Industry
- 7.2.1. Physical Modifiers
- 7.2.1.1. Plastics
- 7.2.1.2. Rubbers
- 7.2.1.3. Other Physical Modifiers
- 7.2.2. Chemical Modifiers
- 7.2.3. Fibers
- 7.2.4. Adhesion Improvers
- 7.2.5. Extenders
- 7.2.6. Fillers
- 7.2.7. Antioxidants
- 7.2.8. Anti-strip Modifiers
- 7.2.9. Other End-user Industries
- 7.2.1. Physical Modifiers
- 7.1. Market Analysis, Insights and Forecast - by Application
- 8. Europe Asphalt Additives Industry Analysis, Insights and Forecast, 2019-2031
- 8.1. Market Analysis, Insights and Forecast - by Application
- 8.1.1. Paving
- 8.1.2. Roofing
- 8.1.3. Other Applications
- 8.2. Market Analysis, Insights and Forecast - by End-user Industry
- 8.2.1. Physical Modifiers
- 8.2.1.1. Plastics
- 8.2.1.2. Rubbers
- 8.2.1.3. Other Physical Modifiers
- 8.2.2. Chemical Modifiers
- 8.2.3. Fibers
- 8.2.4. Adhesion Improvers
- 8.2.5. Extenders
- 8.2.6. Fillers
- 8.2.7. Antioxidants
- 8.2.8. Anti-strip Modifiers
- 8.2.9. Other End-user Industries
- 8.2.1. Physical Modifiers
- 8.1. Market Analysis, Insights and Forecast - by Application
- 9. South America Asphalt Additives Industry Analysis, Insights and Forecast, 2019-2031
- 9.1. Market Analysis, Insights and Forecast - by Application
- 9.1.1. Paving
- 9.1.2. Roofing
- 9.1.3. Other Applications
- 9.2. Market Analysis, Insights and Forecast - by End-user Industry
- 9.2.1. Physical Modifiers
- 9.2.1.1. Plastics
- 9.2.1.2. Rubbers
- 9.2.1.3. Other Physical Modifiers
- 9.2.2. Chemical Modifiers
- 9.2.3. Fibers
- 9.2.4. Adhesion Improvers
- 9.2.5. Extenders
- 9.2.6. Fillers
- 9.2.7. Antioxidants
- 9.2.8. Anti-strip Modifiers
- 9.2.9. Other End-user Industries
- 9.2.1. Physical Modifiers
- 9.1. Market Analysis, Insights and Forecast - by Application
- 10. Middle East Asphalt Additives Industry Analysis, Insights and Forecast, 2019-2031
- 10.1. Market Analysis, Insights and Forecast - by Application
- 10.1.1. Paving
- 10.1.2. Roofing
- 10.1.3. Other Applications
- 10.2. Market Analysis, Insights and Forecast - by End-user Industry
- 10.2.1. Physical Modifiers
- 10.2.1.1. Plastics
- 10.2.1.2. Rubbers
- 10.2.1.3. Other Physical Modifiers
- 10.2.2. Chemical Modifiers
- 10.2.3. Fibers
- 10.2.4. Adhesion Improvers
- 10.2.5. Extenders
- 10.2.6. Fillers
- 10.2.7. Antioxidants
- 10.2.8. Anti-strip Modifiers
- 10.2.9. Other End-user Industries
- 10.2.1. Physical Modifiers
- 10.1. Market Analysis, Insights and Forecast - by Application
- 11. Saudi Arabia Asphalt Additives Industry Analysis, Insights and Forecast, 2019-2031
- 11.1. Market Analysis, Insights and Forecast - by Application
- 11.1.1. Paving
- 11.1.2. Roofing
- 11.1.3. Other Applications
- 11.2. Market Analysis, Insights and Forecast - by End-user Industry
- 11.2.1. Physical Modifiers
- 11.2.1.1. Plastics
- 11.2.1.2. Rubbers
- 11.2.1.3. Other Physical Modifiers
- 11.2.2. Chemical Modifiers
- 11.2.3. Fibers
- 11.2.4. Adhesion Improvers
- 11.2.5. Extenders
- 11.2.6. Fillers
- 11.2.7. Antioxidants
- 11.2.8. Anti-strip Modifiers
- 11.2.9. Other End-user Industries
- 11.2.1. Physical Modifiers
- 11.1. Market Analysis, Insights and Forecast - by Application
- 12. North America Asphalt Additives Industry Analysis, Insights and Forecast, 2019-2031
- 12.1. Market Analysis, Insights and Forecast - By Country/Sub-region
- 12.1.1 United States
- 12.1.2 Canada
- 12.1.3 Mexico
- 13. North America Asphalt Additives Industry Analysis, Insights and Forecast, 2019-2031
- 13.1. Market Analysis, Insights and Forecast - By Country/Sub-region
- 13.1.1 United States
- 13.1.2 Canada
- 13.1.3 Mexico
- 14. Asia Pacific Asphalt Additives Industry Analysis, Insights and Forecast, 2019-2031
- 14.1. Market Analysis, Insights and Forecast - By Country/Sub-region
- 14.1.1 China
- 14.1.2 Japan
- 14.1.3 India
- 14.1.4 South Korea
- 14.1.5 Taiwan
- 14.1.6 Australia
- 14.1.7 Rest of Asia-Pacific
- 15. South America Asphalt Additives Industry Analysis, Insights and Forecast, 2019-2031
- 15.1. Market Analysis, Insights and Forecast - By Country/Sub-region
- 15.1.1 Brazil
- 15.1.2 Argentina
- 15.1.3 Rest of South America
- 16. MEA Asphalt Additives Industry Analysis, Insights and Forecast, 2019-2031
- 16.1. Market Analysis, Insights and Forecast - By Country/Sub-region
- 16.1.1 Middle East
- 16.1.2 Africa
- 17. Competitive Analysis
- 17.1. Global Market Share Analysis 2024
- 17.2. Company Profiles
- 17.2.1 Sasol
- 17.2.1.1. Overview
- 17.2.1.2. Products
- 17.2.1.3. SWOT Analysis
- 17.2.1.4. Recent Developments
- 17.2.1.5. Financials (Based on Availability)
- 17.2.2 Honeywell International Inc
- 17.2.2.1. Overview
- 17.2.2.2. Products
- 17.2.2.3. SWOT Analysis
- 17.2.2.4. Recent Developments
- 17.2.2.5. Financials (Based on Availability)
- 17.2.3 Arkema
- 17.2.3.1. Overview
- 17.2.3.2. Products
- 17.2.3.3. SWOT Analysis
- 17.2.3.4. Recent Developments
- 17.2.3.5. Financials (Based on Availability)
- 17.2.4 Kraton Corporation
- 17.2.4.1. Overview
- 17.2.4.2. Products
- 17.2.4.3. SWOT Analysis
- 17.2.4.4. Recent Developments
- 17.2.4.5. Financials (Based on Availability)
- 17.2.5 Nouryon
- 17.2.5.1. Overview
- 17.2.5.2. Products
- 17.2.5.3. SWOT Analysis
- 17.2.5.4. Recent Developments
- 17.2.5.5. Financials (Based on Availability)
- 17.2.6 Exxon Mobil Corporation
- 17.2.6.1. Overview
- 17.2.6.2. Products
- 17.2.6.3. SWOT Analysis
- 17.2.6.4. Recent Developments
- 17.2.6.5. Financials (Based on Availability)
- 17.2.7 Evonik Industries AG
- 17.2.7.1. Overview
- 17.2.7.2. Products
- 17.2.7.3. SWOT Analysis
- 17.2.7.4. Recent Developments
- 17.2.7.5. Financials (Based on Availability)
- 17.2.8 Cargill
- 17.2.8.1. Overview
- 17.2.8.2. Products
- 17.2.8.3. SWOT Analysis
- 17.2.8.4. Recent Developments
- 17.2.8.5. Financials (Based on Availability)
- 17.2.9 BASF SE
- 17.2.9.1. Overview
- 17.2.9.2. Products
- 17.2.9.3. SWOT Analysis
- 17.2.9.4. Recent Developments
- 17.2.9.5. Financials (Based on Availability)
- 17.2.10 DuPont
- 17.2.10.1. Overview
- 17.2.10.2. Products
- 17.2.10.3. SWOT Analysis
- 17.2.10.4. Recent Developments
- 17.2.10.5. Financials (Based on Availability)
- 17.2.11 Dow
- 17.2.11.1. Overview
- 17.2.11.2. Products
- 17.2.11.3. SWOT Analysis
- 17.2.11.4. Recent Developments
- 17.2.11.5. Financials (Based on Availability)
- 17.2.12 PQ Corporation
- 17.2.12.1. Overview
- 17.2.12.2. Products
- 17.2.12.3. SWOT Analysis
- 17.2.12.4. Recent Developments
- 17.2.12.5. Financials (Based on Availability)
- 17.2.13 ArrMaz Products Inc
- 17.2.13.1. Overview
- 17.2.13.2. Products
- 17.2.13.3. SWOT Analysis
- 17.2.13.4. Recent Developments
- 17.2.13.5. Financials (Based on Availability)
- 17.2.14 Engineered Additives LLC
- 17.2.14.1. Overview
- 17.2.14.2. Products
- 17.2.14.3. SWOT Analysis
- 17.2.14.4. Recent Developments
- 17.2.14.5. Financials (Based on Availability)
- 17.2.15 Kao Corporation
- 17.2.15.1. Overview
- 17.2.15.2. Products
- 17.2.15.3. SWOT Analysis
- 17.2.15.4. Recent Developments
- 17.2.15.5. Financials (Based on Availability)
- 17.2.16 McAsphalt Industries Limited
- 17.2.16.1. Overview
- 17.2.16.2. Products
- 17.2.16.3. SWOT Analysis
- 17.2.16.4. Recent Developments
- 17.2.16.5. Financials (Based on Availability)
- 17.2.17 Genan Holding A/S
- 17.2.17.1. Overview
- 17.2.17.2. Products
- 17.2.17.3. SWOT Analysis
- 17.2.17.4. Recent Developments
- 17.2.17.5. Financials (Based on Availability)
- 17.2.1 Sasol
List of Figures
- Figure 1: Global Asphalt Additives Industry Revenue Breakdown (Million, %) by Region 2024 & 2032
- Figure 2: Global Asphalt Additives Industry Volume Breakdown (K Tons, %) by Region 2024 & 2032
- Figure 3: North America Asphalt Additives Industry Revenue (Million), by Country 2024 & 2032
- Figure 4: North America Asphalt Additives Industry Volume (K Tons), by Country 2024 & 2032
- Figure 5: North America Asphalt Additives Industry Revenue Share (%), by Country 2024 & 2032
- Figure 6: North America Asphalt Additives Industry Volume Share (%), by Country 2024 & 2032
- Figure 7: North America Asphalt Additives Industry Revenue (Million), by Country 2024 & 2032
- Figure 8: North America Asphalt Additives Industry Volume (K Tons), by Country 2024 & 2032
- Figure 9: North America Asphalt Additives Industry Revenue Share (%), by Country 2024 & 2032
- Figure 10: North America Asphalt Additives Industry Volume Share (%), by Country 2024 & 2032
- Figure 11: Asia Pacific Asphalt Additives Industry Revenue (Million), by Country 2024 & 2032
- Figure 12: Asia Pacific Asphalt Additives Industry Volume (K Tons), by Country 2024 & 2032
- Figure 13: Asia Pacific Asphalt Additives Industry Revenue Share (%), by Country 2024 & 2032
- Figure 14: Asia Pacific Asphalt Additives Industry Volume Share (%), by Country 2024 & 2032
- Figure 15: South America Asphalt Additives Industry Revenue (Million), by Country 2024 & 2032
- Figure 16: South America Asphalt Additives Industry Volume (K Tons), by Country 2024 & 2032
- Figure 17: South America Asphalt Additives Industry Revenue Share (%), by Country 2024 & 2032
- Figure 18: South America Asphalt Additives Industry Volume Share (%), by Country 2024 & 2032
- Figure 19: MEA Asphalt Additives Industry Revenue (Million), by Country 2024 & 2032
- Figure 20: MEA Asphalt Additives Industry Volume (K Tons), by Country 2024 & 2032
- Figure 21: MEA Asphalt Additives Industry Revenue Share (%), by Country 2024 & 2032
- Figure 22: MEA Asphalt Additives Industry Volume Share (%), by Country 2024 & 2032
- Figure 23: Asia Pacific Asphalt Additives Industry Revenue (Million), by Application 2024 & 2032
- Figure 24: Asia Pacific Asphalt Additives Industry Volume (K Tons), by Application 2024 & 2032
- Figure 25: Asia Pacific Asphalt Additives Industry Revenue Share (%), by Application 2024 & 2032
- Figure 26: Asia Pacific Asphalt Additives Industry Volume Share (%), by Application 2024 & 2032
- Figure 27: Asia Pacific Asphalt Additives Industry Revenue (Million), by End-user Industry 2024 & 2032
- Figure 28: Asia Pacific Asphalt Additives Industry Volume (K Tons), by End-user Industry 2024 & 2032
- Figure 29: Asia Pacific Asphalt Additives Industry Revenue Share (%), by End-user Industry 2024 & 2032
- Figure 30: Asia Pacific Asphalt Additives Industry Volume Share (%), by End-user Industry 2024 & 2032
- Figure 31: Asia Pacific Asphalt Additives Industry Revenue (Million), by Country 2024 & 2032
- Figure 32: Asia Pacific Asphalt Additives Industry Volume (K Tons), by Country 2024 & 2032
- Figure 33: Asia Pacific Asphalt Additives Industry Revenue Share (%), by Country 2024 & 2032
- Figure 34: Asia Pacific Asphalt Additives Industry Volume Share (%), by Country 2024 & 2032
- Figure 35: North America Asphalt Additives Industry Revenue (Million), by Application 2024 & 2032
- Figure 36: North America Asphalt Additives Industry Volume (K Tons), by Application 2024 & 2032
- Figure 37: North America Asphalt Additives Industry Revenue Share (%), by Application 2024 & 2032
- Figure 38: North America Asphalt Additives Industry Volume Share (%), by Application 2024 & 2032
- Figure 39: North America Asphalt Additives Industry Revenue (Million), by End-user Industry 2024 & 2032
- Figure 40: North America Asphalt Additives Industry Volume (K Tons), by End-user Industry 2024 & 2032
- Figure 41: North America Asphalt Additives Industry Revenue Share (%), by End-user Industry 2024 & 2032
- Figure 42: North America Asphalt Additives Industry Volume Share (%), by End-user Industry 2024 & 2032
- Figure 43: North America Asphalt Additives Industry Revenue (Million), by Country 2024 & 2032
- Figure 44: North America Asphalt Additives Industry Volume (K Tons), by Country 2024 & 2032
- Figure 45: North America Asphalt Additives Industry Revenue Share (%), by Country 2024 & 2032
- Figure 46: North America Asphalt Additives Industry Volume Share (%), by Country 2024 & 2032
- Figure 47: Europe Asphalt Additives Industry Revenue (Million), by Application 2024 & 2032
- Figure 48: Europe Asphalt Additives Industry Volume (K Tons), by Application 2024 & 2032
- Figure 49: Europe Asphalt Additives Industry Revenue Share (%), by Application 2024 & 2032
- Figure 50: Europe Asphalt Additives Industry Volume Share (%), by Application 2024 & 2032
- Figure 51: Europe Asphalt Additives Industry Revenue (Million), by End-user Industry 2024 & 2032
- Figure 52: Europe Asphalt Additives Industry Volume (K Tons), by End-user Industry 2024 & 2032
- Figure 53: Europe Asphalt Additives Industry Revenue Share (%), by End-user Industry 2024 & 2032
- Figure 54: Europe Asphalt Additives Industry Volume Share (%), by End-user Industry 2024 & 2032
- Figure 55: Europe Asphalt Additives Industry Revenue (Million), by Country 2024 & 2032
- Figure 56: Europe Asphalt Additives Industry Volume (K Tons), by Country 2024 & 2032
- Figure 57: Europe Asphalt Additives Industry Revenue Share (%), by Country 2024 & 2032
- Figure 58: Europe Asphalt Additives Industry Volume Share (%), by Country 2024 & 2032
- Figure 59: South America Asphalt Additives Industry Revenue (Million), by Application 2024 & 2032
- Figure 60: South America Asphalt Additives Industry Volume (K Tons), by Application 2024 & 2032
- Figure 61: South America Asphalt Additives Industry Revenue Share (%), by Application 2024 & 2032
- Figure 62: South America Asphalt Additives Industry Volume Share (%), by Application 2024 & 2032
- Figure 63: South America Asphalt Additives Industry Revenue (Million), by End-user Industry 2024 & 2032
- Figure 64: South America Asphalt Additives Industry Volume (K Tons), by End-user Industry 2024 & 2032
- Figure 65: South America Asphalt Additives Industry Revenue Share (%), by End-user Industry 2024 & 2032
- Figure 66: South America Asphalt Additives Industry Volume Share (%), by End-user Industry 2024 & 2032
- Figure 67: South America Asphalt Additives Industry Revenue (Million), by Country 2024 & 2032
- Figure 68: South America Asphalt Additives Industry Volume (K Tons), by Country 2024 & 2032
- Figure 69: South America Asphalt Additives Industry Revenue Share (%), by Country 2024 & 2032
- Figure 70: South America Asphalt Additives Industry Volume Share (%), by Country 2024 & 2032
- Figure 71: Middle East Asphalt Additives Industry Revenue (Million), by Application 2024 & 2032
- Figure 72: Middle East Asphalt Additives Industry Volume (K Tons), by Application 2024 & 2032
- Figure 73: Middle East Asphalt Additives Industry Revenue Share (%), by Application 2024 & 2032
- Figure 74: Middle East Asphalt Additives Industry Volume Share (%), by Application 2024 & 2032
- Figure 75: Middle East Asphalt Additives Industry Revenue (Million), by End-user Industry 2024 & 2032
- Figure 76: Middle East Asphalt Additives Industry Volume (K Tons), by End-user Industry 2024 & 2032
- Figure 77: Middle East Asphalt Additives Industry Revenue Share (%), by End-user Industry 2024 & 2032
- Figure 78: Middle East Asphalt Additives Industry Volume Share (%), by End-user Industry 2024 & 2032
- Figure 79: Middle East Asphalt Additives Industry Revenue (Million), by Country 2024 & 2032
- Figure 80: Middle East Asphalt Additives Industry Volume (K Tons), by Country 2024 & 2032
- Figure 81: Middle East Asphalt Additives Industry Revenue Share (%), by Country 2024 & 2032
- Figure 82: Middle East Asphalt Additives Industry Volume Share (%), by Country 2024 & 2032
- Figure 83: Saudi Arabia Asphalt Additives Industry Revenue (Million), by Application 2024 & 2032
- Figure 84: Saudi Arabia Asphalt Additives Industry Volume (K Tons), by Application 2024 & 2032
- Figure 85: Saudi Arabia Asphalt Additives Industry Revenue Share (%), by Application 2024 & 2032
- Figure 86: Saudi Arabia Asphalt Additives Industry Volume Share (%), by Application 2024 & 2032
- Figure 87: Saudi Arabia Asphalt Additives Industry Revenue (Million), by End-user Industry 2024 & 2032
- Figure 88: Saudi Arabia Asphalt Additives Industry Volume (K Tons), by End-user Industry 2024 & 2032
- Figure 89: Saudi Arabia Asphalt Additives Industry Revenue Share (%), by End-user Industry 2024 & 2032
- Figure 90: Saudi Arabia Asphalt Additives Industry Volume Share (%), by End-user Industry 2024 & 2032
- Figure 91: Saudi Arabia Asphalt Additives Industry Revenue (Million), by Country 2024 & 2032
- Figure 92: Saudi Arabia Asphalt Additives Industry Volume (K Tons), by Country 2024 & 2032
- Figure 93: Saudi Arabia Asphalt Additives Industry Revenue Share (%), by Country 2024 & 2032
- Figure 94: Saudi Arabia Asphalt Additives Industry Volume Share (%), by Country 2024 & 2032
List of Tables
- Table 1: Global Asphalt Additives Industry Revenue Million Forecast, by Region 2019 & 2032
- Table 2: Global Asphalt Additives Industry Volume K Tons Forecast, by Region 2019 & 2032
- Table 3: Global Asphalt Additives Industry Revenue Million Forecast, by Application 2019 & 2032
- Table 4: Global Asphalt Additives Industry Volume K Tons Forecast, by Application 2019 & 2032
- Table 5: Global Asphalt Additives Industry Revenue Million Forecast, by End-user Industry 2019 & 2032
- Table 6: Global Asphalt Additives Industry Volume K Tons Forecast, by End-user Industry 2019 & 2032
- Table 7: Global Asphalt Additives Industry Revenue Million Forecast, by Region 2019 & 2032
- Table 8: Global Asphalt Additives Industry Volume K Tons Forecast, by Region 2019 & 2032
- Table 9: Global Asphalt Additives Industry Revenue Million Forecast, by Country 2019 & 2032
- Table 10: Global Asphalt Additives Industry Volume K Tons Forecast, by Country 2019 & 2032
- Table 11: United States Asphalt Additives Industry Revenue (Million) Forecast, by Application 2019 & 2032
- Table 12: United States Asphalt Additives Industry Volume (K Tons) Forecast, by Application 2019 & 2032
- Table 13: Canada Asphalt Additives Industry Revenue (Million) Forecast, by Application 2019 & 2032
- Table 14: Canada Asphalt Additives Industry Volume (K Tons) Forecast, by Application 2019 & 2032
- Table 15: Mexico Asphalt Additives Industry Revenue (Million) Forecast, by Application 2019 & 2032
- Table 16: Mexico Asphalt Additives Industry Volume (K Tons) Forecast, by Application 2019 & 2032
- Table 17: Global Asphalt Additives Industry Revenue Million Forecast, by Country 2019 & 2032
- Table 18: Global Asphalt Additives Industry Volume K Tons Forecast, by Country 2019 & 2032
- Table 19: United States Asphalt Additives Industry Revenue (Million) Forecast, by Application 2019 & 2032
- Table 20: United States Asphalt Additives Industry Volume (K Tons) Forecast, by Application 2019 & 2032
- Table 21: Canada Asphalt Additives Industry Revenue (Million) Forecast, by Application 2019 & 2032
- Table 22: Canada Asphalt Additives Industry Volume (K Tons) Forecast, by Application 2019 & 2032
- Table 23: Mexico Asphalt Additives Industry Revenue (Million) Forecast, by Application 2019 & 2032
- Table 24: Mexico Asphalt Additives Industry Volume (K Tons) Forecast, by Application 2019 & 2032
- Table 25: Global Asphalt Additives Industry Revenue Million Forecast, by Country 2019 & 2032
- Table 26: Global Asphalt Additives Industry Volume K Tons Forecast, by Country 2019 & 2032
- Table 27: China Asphalt Additives Industry Revenue (Million) Forecast, by Application 2019 & 2032
- Table 28: China Asphalt Additives Industry Volume (K Tons) Forecast, by Application 2019 & 2032
- Table 29: Japan Asphalt Additives Industry Revenue (Million) Forecast, by Application 2019 & 2032
- Table 30: Japan Asphalt Additives Industry Volume (K Tons) Forecast, by Application 2019 & 2032
- Table 31: India Asphalt Additives Industry Revenue (Million) Forecast, by Application 2019 & 2032
- Table 32: India Asphalt Additives Industry Volume (K Tons) Forecast, by Application 2019 & 2032
- Table 33: South Korea Asphalt Additives Industry Revenue (Million) Forecast, by Application 2019 & 2032
- Table 34: South Korea Asphalt Additives Industry Volume (K Tons) Forecast, by Application 2019 & 2032
- Table 35: Taiwan Asphalt Additives Industry Revenue (Million) Forecast, by Application 2019 & 2032
- Table 36: Taiwan Asphalt Additives Industry Volume (K Tons) Forecast, by Application 2019 & 2032
- Table 37: Australia Asphalt Additives Industry Revenue (Million) Forecast, by Application 2019 & 2032
- Table 38: Australia Asphalt Additives Industry Volume (K Tons) Forecast, by Application 2019 & 2032
- Table 39: Rest of Asia-Pacific Asphalt Additives Industry Revenue (Million) Forecast, by Application 2019 & 2032
- Table 40: Rest of Asia-Pacific Asphalt Additives Industry Volume (K Tons) Forecast, by Application 2019 & 2032
- Table 41: Global Asphalt Additives Industry Revenue Million Forecast, by Country 2019 & 2032
- Table 42: Global Asphalt Additives Industry Volume K Tons Forecast, by Country 2019 & 2032
- Table 43: Brazil Asphalt Additives Industry Revenue (Million) Forecast, by Application 2019 & 2032
- Table 44: Brazil Asphalt Additives Industry Volume (K Tons) Forecast, by Application 2019 & 2032
- Table 45: Argentina Asphalt Additives Industry Revenue (Million) Forecast, by Application 2019 & 2032
- Table 46: Argentina Asphalt Additives Industry Volume (K Tons) Forecast, by Application 2019 & 2032
- Table 47: Rest of South America Asphalt Additives Industry Revenue (Million) Forecast, by Application 2019 & 2032
- Table 48: Rest of South America Asphalt Additives Industry Volume (K Tons) Forecast, by Application 2019 & 2032
- Table 49: Global Asphalt Additives Industry Revenue Million Forecast, by Country 2019 & 2032
- Table 50: Global Asphalt Additives Industry Volume K Tons Forecast, by Country 2019 & 2032
- Table 51: Middle East Asphalt Additives Industry Revenue (Million) Forecast, by Application 2019 & 2032
- Table 52: Middle East Asphalt Additives Industry Volume (K Tons) Forecast, by Application 2019 & 2032
- Table 53: Africa Asphalt Additives Industry Revenue (Million) Forecast, by Application 2019 & 2032
- Table 54: Africa Asphalt Additives Industry Volume (K Tons) Forecast, by Application 2019 & 2032
- Table 55: Global Asphalt Additives Industry Revenue Million Forecast, by Application 2019 & 2032
- Table 56: Global Asphalt Additives Industry Volume K Tons Forecast, by Application 2019 & 2032
- Table 57: Global Asphalt Additives Industry Revenue Million Forecast, by End-user Industry 2019 & 2032
- Table 58: Global Asphalt Additives Industry Volume K Tons Forecast, by End-user Industry 2019 & 2032
- Table 59: Global Asphalt Additives Industry Revenue Million Forecast, by Country 2019 & 2032
- Table 60: Global Asphalt Additives Industry Volume K Tons Forecast, by Country 2019 & 2032
- Table 61: China Asphalt Additives Industry Revenue (Million) Forecast, by Application 2019 & 2032
- Table 62: China Asphalt Additives Industry Volume (K Tons) Forecast, by Application 2019 & 2032
- Table 63: India Asphalt Additives Industry Revenue (Million) Forecast, by Application 2019 & 2032
- Table 64: India Asphalt Additives Industry Volume (K Tons) Forecast, by Application 2019 & 2032
- Table 65: Japan Asphalt Additives Industry Revenue (Million) Forecast, by Application 2019 & 2032
- Table 66: Japan Asphalt Additives Industry Volume (K Tons) Forecast, by Application 2019 & 2032
- Table 67: South Korea Asphalt Additives Industry Revenue (Million) Forecast, by Application 2019 & 2032
- Table 68: South Korea Asphalt Additives Industry Volume (K Tons) Forecast, by Application 2019 & 2032
- Table 69: Australia Asphalt Additives Industry Revenue (Million) Forecast, by Application 2019 & 2032
- Table 70: Australia Asphalt Additives Industry Volume (K Tons) Forecast, by Application 2019 & 2032
- Table 71: Rest of Asia Pacific Asphalt Additives Industry Revenue (Million) Forecast, by Application 2019 & 2032
- Table 72: Rest of Asia Pacific Asphalt Additives Industry Volume (K Tons) Forecast, by Application 2019 & 2032
- Table 73: Global Asphalt Additives Industry Revenue Million Forecast, by Application 2019 & 2032
- Table 74: Global Asphalt Additives Industry Volume K Tons Forecast, by Application 2019 & 2032
- Table 75: Global Asphalt Additives Industry Revenue Million Forecast, by End-user Industry 2019 & 2032
- Table 76: Global Asphalt Additives Industry Volume K Tons Forecast, by End-user Industry 2019 & 2032
- Table 77: Global Asphalt Additives Industry Revenue Million Forecast, by Country 2019 & 2032
- Table 78: Global Asphalt Additives Industry Volume K Tons Forecast, by Country 2019 & 2032
- Table 79: United States Asphalt Additives Industry Revenue (Million) Forecast, by Application 2019 & 2032
- Table 80: United States Asphalt Additives Industry Volume (K Tons) Forecast, by Application 2019 & 2032
- Table 81: Canada Asphalt Additives Industry Revenue (Million) Forecast, by Application 2019 & 2032
- Table 82: Canada Asphalt Additives Industry Volume (K Tons) Forecast, by Application 2019 & 2032
- Table 83: Mexico Asphalt Additives Industry Revenue (Million) Forecast, by Application 2019 & 2032
- Table 84: Mexico Asphalt Additives Industry Volume (K Tons) Forecast, by Application 2019 & 2032
- Table 85: Global Asphalt Additives Industry Revenue Million Forecast, by Application 2019 & 2032
- Table 86: Global Asphalt Additives Industry Volume K Tons Forecast, by Application 2019 & 2032
- Table 87: Global Asphalt Additives Industry Revenue Million Forecast, by End-user Industry 2019 & 2032
- Table 88: Global Asphalt Additives Industry Volume K Tons Forecast, by End-user Industry 2019 & 2032
- Table 89: Global Asphalt Additives Industry Revenue Million Forecast, by Country 2019 & 2032
- Table 90: Global Asphalt Additives Industry Volume K Tons Forecast, by Country 2019 & 2032
- Table 91: Germany Asphalt Additives Industry Revenue (Million) Forecast, by Application 2019 & 2032
- Table 92: Germany Asphalt Additives Industry Volume (K Tons) Forecast, by Application 2019 & 2032
- Table 93: United Kingdom Asphalt Additives Industry Revenue (Million) Forecast, by Application 2019 & 2032
- Table 94: United Kingdom Asphalt Additives Industry Volume (K Tons) Forecast, by Application 2019 & 2032
- Table 95: Italy Asphalt Additives Industry Revenue (Million) Forecast, by Application 2019 & 2032
- Table 96: Italy Asphalt Additives Industry Volume (K Tons) Forecast, by Application 2019 & 2032
- Table 97: France Asphalt Additives Industry Revenue (Million) Forecast, by Application 2019 & 2032
- Table 98: France Asphalt Additives Industry Volume (K Tons) Forecast, by Application 2019 & 2032
- Table 99: Rest of Europe Asphalt Additives Industry Revenue (Million) Forecast, by Application 2019 & 2032
- Table 100: Rest of Europe Asphalt Additives Industry Volume (K Tons) Forecast, by Application 2019 & 2032
- Table 101: Global Asphalt Additives Industry Revenue Million Forecast, by Application 2019 & 2032
- Table 102: Global Asphalt Additives Industry Volume K Tons Forecast, by Application 2019 & 2032
- Table 103: Global Asphalt Additives Industry Revenue Million Forecast, by End-user Industry 2019 & 2032
- Table 104: Global Asphalt Additives Industry Volume K Tons Forecast, by End-user Industry 2019 & 2032
- Table 105: Global Asphalt Additives Industry Revenue Million Forecast, by Country 2019 & 2032
- Table 106: Global Asphalt Additives Industry Volume K Tons Forecast, by Country 2019 & 2032
- Table 107: Brazil Asphalt Additives Industry Revenue (Million) Forecast, by Application 2019 & 2032
- Table 108: Brazil Asphalt Additives Industry Volume (K Tons) Forecast, by Application 2019 & 2032
- Table 109: Argentina Asphalt Additives Industry Revenue (Million) Forecast, by Application 2019 & 2032
- Table 110: Argentina Asphalt Additives Industry Volume (K Tons) Forecast, by Application 2019 & 2032
- Table 111: Colombia Asphalt Additives Industry Revenue (Million) Forecast, by Application 2019 & 2032
- Table 112: Colombia Asphalt Additives Industry Volume (K Tons) Forecast, by Application 2019 & 2032
- Table 113: Rest of South America Asphalt Additives Industry Revenue (Million) Forecast, by Application 2019 & 2032
- Table 114: Rest of South America Asphalt Additives Industry Volume (K Tons) Forecast, by Application 2019 & 2032
- Table 115: Global Asphalt Additives Industry Revenue Million Forecast, by Application 2019 & 2032
- Table 116: Global Asphalt Additives Industry Volume K Tons Forecast, by Application 2019 & 2032
- Table 117: Global Asphalt Additives Industry Revenue Million Forecast, by End-user Industry 2019 & 2032
- Table 118: Global Asphalt Additives Industry Volume K Tons Forecast, by End-user Industry 2019 & 2032
- Table 119: Global Asphalt Additives Industry Revenue Million Forecast, by Country 2019 & 2032
- Table 120: Global Asphalt Additives Industry Volume K Tons Forecast, by Country 2019 & 2032
- Table 121: Global Asphalt Additives Industry Revenue Million Forecast, by Application 2019 & 2032
- Table 122: Global Asphalt Additives Industry Volume K Tons Forecast, by Application 2019 & 2032
- Table 123: Global Asphalt Additives Industry Revenue Million Forecast, by End-user Industry 2019 & 2032
- Table 124: Global Asphalt Additives Industry Volume K Tons Forecast, by End-user Industry 2019 & 2032
- Table 125: Global Asphalt Additives Industry Revenue Million Forecast, by Country 2019 & 2032
- Table 126: Global Asphalt Additives Industry Volume K Tons Forecast, by Country 2019 & 2032
- Table 127: South Africa Asphalt Additives Industry Revenue (Million) Forecast, by Application 2019 & 2032
- Table 128: South Africa Asphalt Additives Industry Volume (K Tons) Forecast, by Application 2019 & 2032
- Table 129: Qatar Asphalt Additives Industry Revenue (Million) Forecast, by Application 2019 & 2032
- Table 130: Qatar Asphalt Additives Industry Volume (K Tons) Forecast, by Application 2019 & 2032
- Table 131: Rest of Middle East Asphalt Additives Industry Revenue (Million) Forecast, by Application 2019 & 2032
- Table 132: Rest of Middle East Asphalt Additives Industry Volume (K Tons) Forecast, by Application 2019 & 2032
Frequently Asked Questions
1. What is the projected Compound Annual Growth Rate (CAGR) of the Asphalt Additives Industry?
The projected CAGR is approximately 5.34%.
2. Which companies are prominent players in the Asphalt Additives Industry?
Key companies in the market include Sasol, Honeywell International Inc, Arkema, Kraton Corporation, Nouryon, Exxon Mobil Corporation, Evonik Industries AG, Cargill, BASF SE, DuPont, Dow, PQ Corporation, ArrMaz Products Inc, Engineered Additives LLC, Kao Corporation, McAsphalt Industries Limited, Genan Holding A/S.
3. What are the main segments of the Asphalt Additives Industry?
The market segments include Application, End-user Industry.
4. Can you provide details about the market size?
The market size is estimated to be USD 4.37 Million as of 2022.
5. What are some drivers contributing to market growth?
High Traffic Volume and Heavier Loads; Emphasis on Meeting Super-save Design Specifications; Increased Pavement Work-life and Reduced MRO Cost Advantages.
6. What are the notable trends driving market growth?
Increasing Demand from Paving Application.
7. Are there any restraints impacting market growth?
High Initial Cost for Using Modified Asphalt Cement; Occupational Health Hazards Regarding Asphalt.
8. Can you provide examples of recent developments in the market?
January 2023: Dow is the supporter of The Road Forward, an initiative by the National Asphalt Pavement Association (NAPA), Greenbelt, Maryland, that aims to achieve net zero carbon emissions for the asphalt pavement industry.
9. What pricing options are available for accessing the report?
Pricing options include single-user, multi-user, and enterprise licenses priced at USD 4750, USD 5250, and USD 8750 respectively.
10. Is the market size provided in terms of value or volume?
The market size is provided in terms of value, measured in Million and volume, measured in K Tons.
11. Are there any specific market keywords associated with the report?
Yes, the market keyword associated with the report is "Asphalt Additives Industry," which aids in identifying and referencing the specific market segment covered.
12. How do I determine which pricing option suits my needs best?
The pricing options vary based on user requirements and access needs. Individual users may opt for single-user licenses, while businesses requiring broader access may choose multi-user or enterprise licenses for cost-effective access to the report.
13. Are there any additional resources or data provided in the Asphalt Additives Industry report?
While the report offers comprehensive insights, it's advisable to review the specific contents or supplementary materials provided to ascertain if additional resources or data are available.
14. How can I stay updated on further developments or reports in the Asphalt Additives Industry?
To stay informed about further developments, trends, and reports in the Asphalt Additives Industry, consider subscribing to industry newsletters, following relevant companies and organizations, or regularly checking reputable industry news sources and publications.
Methodology
Step 1 - Identification of Relevant Samples Size from Population Database


Step 2 - Approaches for Defining Global Market Size (Value, Volume* & Price*)

Note*: In applicable scenarios
Step 3 - Data Sources
Primary Research
- Web Analytics
- Survey Reports
- Research Institute
- Latest Research Reports
- Opinion Leaders
Secondary Research
- Annual Reports
- White Paper
- Latest Press Release
- Industry Association
- Paid Database
- Investor Presentations

Step 4 - Data Triangulation
Involves using different sources of information in order to increase the validity of a study
These sources are likely to be stakeholders in a program - participants, other researchers, program staff, other community members, and so on.
Then we put all data in single framework & apply various statistical tools to find out the dynamic on the market.
During the analysis stage, feedback from the stakeholder groups would be compared to determine areas of agreement as well as areas of divergence


