
Key Insights
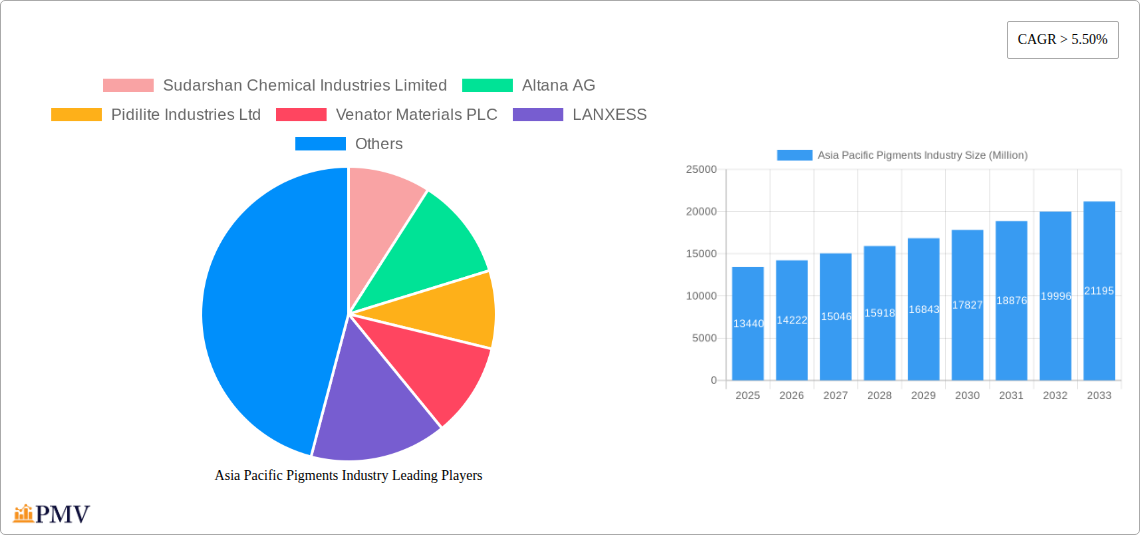
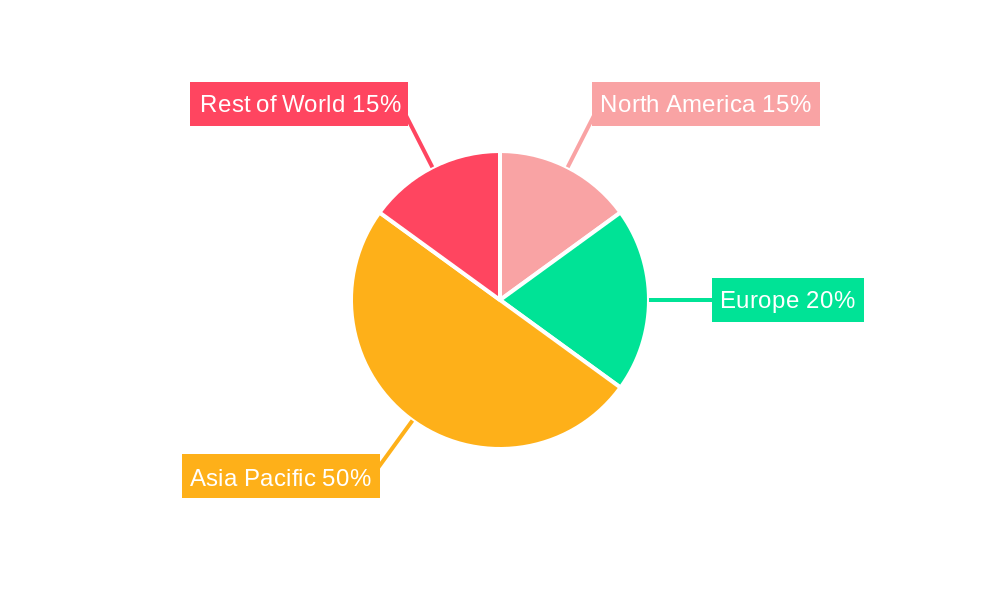
The Asia-Pacific pigments market, valued at $13.44 billion in 2025, is projected to experience robust growth, exceeding a 5.50% CAGR from 2025 to 2033. This expansion is driven by several key factors. The region's burgeoning construction and automotive industries fuel significant demand for paints and coatings, the largest application segment for pigments. Furthermore, the textile industry's growth, particularly in countries like China, India, and Bangladesh, contributes significantly to pigment consumption. Increased investments in infrastructure development and rising disposable incomes further bolster market growth. The rising adoption of eco-friendly pigments, driven by increasing environmental awareness, presents a promising trend, while challenges such as fluctuating raw material prices and stringent environmental regulations represent potential restraints. Within the product types, inorganic pigments currently hold the largest market share, benefiting from their cost-effectiveness and wide application range. However, the demand for organic and specialty pigments is steadily growing, driven by their superior performance characteristics and diverse applications in high-value sectors such as electronics and cosmetics. Key players like Sudarshan Chemical Industries, Altana AG, and BASF SE are strategically investing in research and development to expand their product portfolios and strengthen their market presence. China, Japan, and India are currently the leading markets within the Asia-Pacific region, contributing significantly to overall market volume.
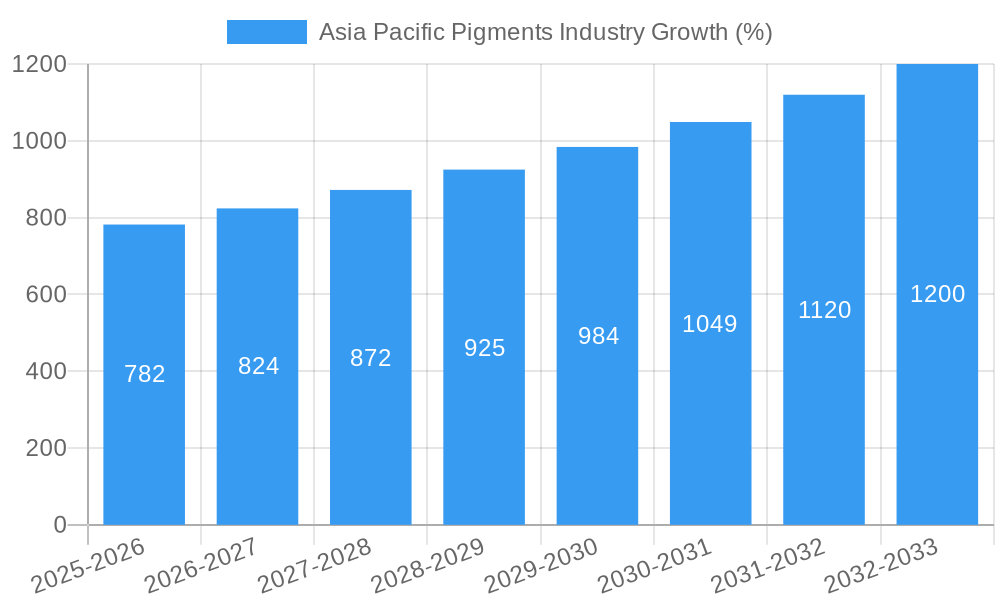
The forecast period (2025-2033) indicates continued growth, fueled by sustained industrial expansion and technological advancements. The increasing adoption of digital printing technologies and the rising demand for high-performance pigments in specialized applications, such as electronics and cosmetics, will contribute to market diversification. However, manufacturers must address challenges such as managing supply chain disruptions, ensuring sustainability, and complying with evolving environmental regulations to maintain sustainable growth. Competitive dynamics will likely intensify, with companies focusing on innovation, strategic partnerships, and mergers and acquisitions to gain a competitive edge. A significant aspect of future growth will hinge on the successful integration of sustainable and eco-friendly pigment technologies to cater to the escalating demand for environmentally responsible solutions. The market’s evolution will depend on successfully navigating these opportunities and challenges to sustain the projected growth trajectory.
Asia Pacific Pigments Industry: A Comprehensive Market Report (2019-2033)
This in-depth report provides a comprehensive analysis of the Asia Pacific pigments industry, covering market size, segmentation, competitive landscape, and future growth prospects. With a study period spanning 2019-2033, a base year of 2025, and a forecast period of 2025-2033, this report is an indispensable resource for industry professionals, investors, and strategic decision-makers. The report utilizes data from the historical period (2019-2024) and incorporates key industry developments to offer actionable insights. The total market value is projected to reach xx Million by 2033.
Asia Pacific Pigments Industry Market Structure & Competitive Dynamics
The Asia Pacific pigments market exhibits a moderately concentrated structure, with several major players holding significant market share. Key companies include Sudarshan Chemical Industries Limited, Altana AG, Pidilite Industries Ltd, Venator Materials PLC, LANXESS, BASF SE, Wellton Chemical Co Ltd, The Chemours Company, Tronox Holdings PLC, and DIC CORPORATION. However, the market also accommodates numerous smaller regional players. The industry's innovation ecosystem is driven by ongoing research and development in areas such as sustainable pigments, enhanced performance characteristics, and specialized applications. Regulatory frameworks vary across the region, impacting production and compliance. Product substitutes, such as natural dyes and digital printing techniques, present some competitive pressure, though pigment use remains dominant in many applications. End-user trends toward sustainability and higher-performance materials influence pigment demand. The market has witnessed significant M&A activity in recent years, with transactions driven by expansion strategies and technological synergies. For example, Cathay Industries' acquisition of Venator Materials PLC's iron oxide pigment business significantly altered market dynamics. Deal values for these mergers and acquisitions have ranged from xx Million to xx Million in recent years, consolidating market share among key players. The market share of the top five players is estimated to be around xx%.
Asia Pacific Pigments Industry Industry Trends & Insights
The Asia Pacific pigments market is experiencing robust growth, driven by factors such as the booming construction industry, expanding automotive sector, and increasing demand for durable and aesthetically appealing products across various applications. The projected Compound Annual Growth Rate (CAGR) for the forecast period (2025-2033) is estimated to be xx%. Technological disruptions, such as the development of nanotechnology-based pigments and eco-friendly alternatives, are transforming the industry. Market penetration of these innovative pigments is steadily increasing, driven by growing consumer preference for environmentally sustainable products. Intense competition necessitates continuous innovation and cost optimization strategies among industry players. Pricing strategies also play a significant role, with fluctuations influenced by raw material costs and regional economic conditions. Consumer preferences are increasingly shaped by sustainability concerns and demand for superior performance characteristics, influencing pigment selection across diverse industries. The market penetration of organic pigments is expected to rise significantly due to growing environmental concerns.
Dominant Markets & Segments in Asia Pacific Pigments Industry
Within the Asia Pacific region, China and India stand out as dominant markets, driven by rapid industrialization and urbanization. Other significant markets include Japan, South Korea, and Southeast Asian nations.
- Product Type: Inorganic pigments currently dominate the market due to their cost-effectiveness and widespread applications. However, organic and specialty pigments are witnessing significant growth due to their superior performance in specific applications like textiles and plastics. Metallic and natural pigments hold niche market positions.
- Application: Paints and coatings account for the largest share of pigment consumption, followed by plastics and printing inks. The textiles and leather industries represent growing segments, while the use of pigments in cosmetics and electronics is expanding.
Key Drivers:
- Economic Growth: Rapid economic growth in many Asia Pacific nations fuels infrastructure development and consumer spending, driving demand for pigments in construction, automotive, and consumer goods.
- Favorable Government Policies: Government support for infrastructure projects and initiatives promoting manufacturing contribute significantly to industry growth.
The dominance of specific segments is intricately linked to regional economic development, infrastructure investments, and governmental policies that support industrial growth. China's robust construction sector and India's growing manufacturing base significantly influence the overall market.
Asia Pacific Pigments Industry Product Innovations
Recent years have witnessed significant innovation in pigment technology, including the development of high-performance pigments with enhanced durability, color fastness, and weather resistance. Nanotechnology-based pigments offer improved dispersion and enhanced optical properties. Emphasis on sustainability has driven the development of eco-friendly, low-toxicity pigments, addressing growing environmental concerns. These innovations cater to the increasing demand for sustainable and high-performance products across diverse application segments, creating a competitive advantage for manufacturers at the forefront of technological advancements.
Report Segmentation & Scope
This report provides a granular segmentation of the Asia Pacific pigments market based on product type and application.
Product Type: Inorganic pigments (further segmented into Iron Oxide, Chromium Oxide, etc.), Organic pigments, Specialty pigments, and Other product types (Metallic Pigments, Natural Pigments, etc.) are analyzed individually, providing market size, growth projections, and competitive dynamics.
Application: Paints and Coatings, Textiles, Printing Inks, Plastics, Leather, and Other Applications (Cosmetics, Ceramics, Electronics, etc.) are detailed, revealing application-specific market characteristics, growth trends, and prominent players.
The report projects significant growth across all segments, with variations based on regional economic conditions, technological advancements, and changing consumer preferences.
Key Drivers of Asia Pacific Pigments Industry Growth
Several key factors are driving growth within the Asia Pacific pigments industry. These include:
- Rapid Industrialization and Urbanization: This fuels demand for construction materials, packaging, and other products heavily reliant on pigments.
- Technological Advancements: Innovations like nanotechnology pigments offer improved performance and cater to growing needs for sustainability.
- Growing Consumer Spending: Rising disposable incomes drive demand for high-quality products with superior aesthetics and durability.
Challenges in the Asia Pacific Pigments Industry Sector
The Asia Pacific pigments market faces several challenges, including:
- Fluctuating Raw Material Prices: Raw material costs significantly impact pigment production costs and profitability.
- Environmental Regulations: Stricter environmental regulations necessitate adoption of sustainable manufacturing practices, increasing compliance costs.
- Intense Competition: The presence of numerous players creates a highly competitive market, necessitating ongoing innovation and cost optimization.
These challenges impact profitability and necessitate adaptive strategies for successful operation within the sector.
Leading Players in the Asia Pacific Pigments Industry Market
- Sudarshan Chemical Industries Limited
- Altana AG
- Pidilite Industries Ltd
- Venator Materials PLC
- LANXESS
- BASF SE
- Wellton Chemical Co Ltd
- The Chemours Company
- Tronox Holdings PLC
- DIC CORPORATION
Key Developments in Asia Pacific Pigments Industry Sector
- November 2022: Cathay Industries acquired Venator Materials PLC's iron oxide pigment business, expanding its global manufacturing presence and market share.
- January 2022: Clariant sold its pigments business to a consortium including Heubach Group and SK Capital Partner, resulting in a new market structure and potentially influencing competitive dynamics.
These acquisitions significantly reshape the competitive landscape, highlighting the ongoing consolidation within the industry.
Strategic Asia Pacific Pigments Industry Market Outlook
The Asia Pacific pigments market presents significant growth opportunities due to continued industrialization, urbanization, and increasing consumer demand. Strategic focus should be on innovation, sustainability, and efficient supply chains to navigate competitive pressures and regulatory compliance. Companies investing in research and development of high-performance, eco-friendly pigments, and those with strong regional presence and distribution networks are well-positioned to capitalize on future market expansion. The long-term outlook remains positive, driven by the region's dynamic economic growth and evolving consumer preferences.
Asia Pacific Pigments Industry Segmentation
-
1. Product Type
-
1.1. Inorganic
- 1.1.1. Titanium Dioxide
- 1.1.2. Zinc Oxide
- 1.1.3. Other In
- 1.2. Organic
- 1.3. Specialty Pigments
- 1.4. Other Pr
-
1.1. Inorganic
-
2. Application
- 2.1. Paints and Coatings
- 2.2. Textiles
- 2.3. Printing Inks
- 2.4. Plastics
- 2.5. Leather
- 2.6. Other Ap
-
3. Geography
- 3.1. China
- 3.2. India
- 3.3. Japan
- 3.4. South Korea
- 3.5. Australia & New Zealand
- 3.6. Rest of Asia-Pacific
Asia Pacific Pigments Industry Segmentation By Geography
- 1. China
- 2. India
- 3. Japan
- 4. South Korea
- 5. Australia
- 6. Rest of Asia Pacific
Asia Pacific Pigments Industry REPORT HIGHLIGHTS
| Aspects | Details |
|---|---|
| Study Period | 2019-2033 |
| Base Year | 2024 |
| Estimated Year | 2025 |
| Forecast Period | 2025-2033 |
| Historical Period | 2019-2024 |
| Growth Rate | CAGR of > 5.50% from 2019-2033 |
| Segmentation |
|
Table of Contents
- 1. Introduction
- 1.1. Research Scope
- 1.2. Market Segmentation
- 1.3. Research Methodology
- 1.4. Definitions and Assumptions
- 2. Executive Summary
- 2.1. Introduction
- 3. Market Dynamics
- 3.1. Introduction
- 3.2. Market Drivers
- 3.2.1. Growing Demand From the Paints and Coatings Industry; Rising Demand from the Textile Industry; The Increasing Demand for Pigments from Plastics Applications
- 3.3. Market Restrains
- 3.3.1. Stringent Government Regulations on the usage of Pigments; High Cost Associated with the Organic Pigments
- 3.4. Market Trends
- 3.4.1. Increasing Demand from the Paints and Coatings Industry
- 4. Market Factor Analysis
- 4.1. Porters Five Forces
- 4.2. Supply/Value Chain
- 4.3. PESTEL analysis
- 4.4. Market Entropy
- 4.5. Patent/Trademark Analysis
- 5. Asia Pacific Pigments Industry Analysis, Insights and Forecast, 2019-2031
- 5.1. Market Analysis, Insights and Forecast - by Product Type
- 5.1.1. Inorganic
- 5.1.1.1. Titanium Dioxide
- 5.1.1.2. Zinc Oxide
- 5.1.1.3. Other In
- 5.1.2. Organic
- 5.1.3. Specialty Pigments
- 5.1.4. Other Pr
- 5.1.1. Inorganic
- 5.2. Market Analysis, Insights and Forecast - by Application
- 5.2.1. Paints and Coatings
- 5.2.2. Textiles
- 5.2.3. Printing Inks
- 5.2.4. Plastics
- 5.2.5. Leather
- 5.2.6. Other Ap
- 5.3. Market Analysis, Insights and Forecast - by Geography
- 5.3.1. China
- 5.3.2. India
- 5.3.3. Japan
- 5.3.4. South Korea
- 5.3.5. Australia & New Zealand
- 5.3.6. Rest of Asia-Pacific
- 5.4. Market Analysis, Insights and Forecast - by Region
- 5.4.1. China
- 5.4.2. India
- 5.4.3. Japan
- 5.4.4. South Korea
- 5.4.5. Australia
- 5.4.6. Rest of Asia Pacific
- 5.1. Market Analysis, Insights and Forecast - by Product Type
- 6. China Asia Pacific Pigments Industry Analysis, Insights and Forecast, 2019-2031
- 6.1. Market Analysis, Insights and Forecast - by Product Type
- 6.1.1. Inorganic
- 6.1.1.1. Titanium Dioxide
- 6.1.1.2. Zinc Oxide
- 6.1.1.3. Other In
- 6.1.2. Organic
- 6.1.3. Specialty Pigments
- 6.1.4. Other Pr
- 6.1.1. Inorganic
- 6.2. Market Analysis, Insights and Forecast - by Application
- 6.2.1. Paints and Coatings
- 6.2.2. Textiles
- 6.2.3. Printing Inks
- 6.2.4. Plastics
- 6.2.5. Leather
- 6.2.6. Other Ap
- 6.3. Market Analysis, Insights and Forecast - by Geography
- 6.3.1. China
- 6.3.2. India
- 6.3.3. Japan
- 6.3.4. South Korea
- 6.3.5. Australia & New Zealand
- 6.3.6. Rest of Asia-Pacific
- 6.1. Market Analysis, Insights and Forecast - by Product Type
- 7. India Asia Pacific Pigments Industry Analysis, Insights and Forecast, 2019-2031
- 7.1. Market Analysis, Insights and Forecast - by Product Type
- 7.1.1. Inorganic
- 7.1.1.1. Titanium Dioxide
- 7.1.1.2. Zinc Oxide
- 7.1.1.3. Other In
- 7.1.2. Organic
- 7.1.3. Specialty Pigments
- 7.1.4. Other Pr
- 7.1.1. Inorganic
- 7.2. Market Analysis, Insights and Forecast - by Application
- 7.2.1. Paints and Coatings
- 7.2.2. Textiles
- 7.2.3. Printing Inks
- 7.2.4. Plastics
- 7.2.5. Leather
- 7.2.6. Other Ap
- 7.3. Market Analysis, Insights and Forecast - by Geography
- 7.3.1. China
- 7.3.2. India
- 7.3.3. Japan
- 7.3.4. South Korea
- 7.3.5. Australia & New Zealand
- 7.3.6. Rest of Asia-Pacific
- 7.1. Market Analysis, Insights and Forecast - by Product Type
- 8. Japan Asia Pacific Pigments Industry Analysis, Insights and Forecast, 2019-2031
- 8.1. Market Analysis, Insights and Forecast - by Product Type
- 8.1.1. Inorganic
- 8.1.1.1. Titanium Dioxide
- 8.1.1.2. Zinc Oxide
- 8.1.1.3. Other In
- 8.1.2. Organic
- 8.1.3. Specialty Pigments
- 8.1.4. Other Pr
- 8.1.1. Inorganic
- 8.2. Market Analysis, Insights and Forecast - by Application
- 8.2.1. Paints and Coatings
- 8.2.2. Textiles
- 8.2.3. Printing Inks
- 8.2.4. Plastics
- 8.2.5. Leather
- 8.2.6. Other Ap
- 8.3. Market Analysis, Insights and Forecast - by Geography
- 8.3.1. China
- 8.3.2. India
- 8.3.3. Japan
- 8.3.4. South Korea
- 8.3.5. Australia & New Zealand
- 8.3.6. Rest of Asia-Pacific
- 8.1. Market Analysis, Insights and Forecast - by Product Type
- 9. South Korea Asia Pacific Pigments Industry Analysis, Insights and Forecast, 2019-2031
- 9.1. Market Analysis, Insights and Forecast - by Product Type
- 9.1.1. Inorganic
- 9.1.1.1. Titanium Dioxide
- 9.1.1.2. Zinc Oxide
- 9.1.1.3. Other In
- 9.1.2. Organic
- 9.1.3. Specialty Pigments
- 9.1.4. Other Pr
- 9.1.1. Inorganic
- 9.2. Market Analysis, Insights and Forecast - by Application
- 9.2.1. Paints and Coatings
- 9.2.2. Textiles
- 9.2.3. Printing Inks
- 9.2.4. Plastics
- 9.2.5. Leather
- 9.2.6. Other Ap
- 9.3. Market Analysis, Insights and Forecast - by Geography
- 9.3.1. China
- 9.3.2. India
- 9.3.3. Japan
- 9.3.4. South Korea
- 9.3.5. Australia & New Zealand
- 9.3.6. Rest of Asia-Pacific
- 9.1. Market Analysis, Insights and Forecast - by Product Type
- 10. Australia Asia Pacific Pigments Industry Analysis, Insights and Forecast, 2019-2031
- 10.1. Market Analysis, Insights and Forecast - by Product Type
- 10.1.1. Inorganic
- 10.1.1.1. Titanium Dioxide
- 10.1.1.2. Zinc Oxide
- 10.1.1.3. Other In
- 10.1.2. Organic
- 10.1.3. Specialty Pigments
- 10.1.4. Other Pr
- 10.1.1. Inorganic
- 10.2. Market Analysis, Insights and Forecast - by Application
- 10.2.1. Paints and Coatings
- 10.2.2. Textiles
- 10.2.3. Printing Inks
- 10.2.4. Plastics
- 10.2.5. Leather
- 10.2.6. Other Ap
- 10.3. Market Analysis, Insights and Forecast - by Geography
- 10.3.1. China
- 10.3.2. India
- 10.3.3. Japan
- 10.3.4. South Korea
- 10.3.5. Australia & New Zealand
- 10.3.6. Rest of Asia-Pacific
- 10.1. Market Analysis, Insights and Forecast - by Product Type
- 11. Rest of Asia Pacific Asia Pacific Pigments Industry Analysis, Insights and Forecast, 2019-2031
- 11.1. Market Analysis, Insights and Forecast - by Product Type
- 11.1.1. Inorganic
- 11.1.1.1. Titanium Dioxide
- 11.1.1.2. Zinc Oxide
- 11.1.1.3. Other In
- 11.1.2. Organic
- 11.1.3. Specialty Pigments
- 11.1.4. Other Pr
- 11.1.1. Inorganic
- 11.2. Market Analysis, Insights and Forecast - by Application
- 11.2.1. Paints and Coatings
- 11.2.2. Textiles
- 11.2.3. Printing Inks
- 11.2.4. Plastics
- 11.2.5. Leather
- 11.2.6. Other Ap
- 11.3. Market Analysis, Insights and Forecast - by Geography
- 11.3.1. China
- 11.3.2. India
- 11.3.3. Japan
- 11.3.4. South Korea
- 11.3.5. Australia & New Zealand
- 11.3.6. Rest of Asia-Pacific
- 11.1. Market Analysis, Insights and Forecast - by Product Type
- 12. China Asia Pacific Pigments Industry Analysis, Insights and Forecast, 2019-2031
- 13. Japan Asia Pacific Pigments Industry Analysis, Insights and Forecast, 2019-2031
- 14. India Asia Pacific Pigments Industry Analysis, Insights and Forecast, 2019-2031
- 15. South Korea Asia Pacific Pigments Industry Analysis, Insights and Forecast, 2019-2031
- 16. Taiwan Asia Pacific Pigments Industry Analysis, Insights and Forecast, 2019-2031
- 17. Australia Asia Pacific Pigments Industry Analysis, Insights and Forecast, 2019-2031
- 18. Rest of Asia-Pacific Asia Pacific Pigments Industry Analysis, Insights and Forecast, 2019-2031
- 19. Competitive Analysis
- 19.1. Market Share Analysis 2024
- 19.2. Company Profiles
- 19.2.1 Sudarshan Chemical Industries Limited
- 19.2.1.1. Overview
- 19.2.1.2. Products
- 19.2.1.3. SWOT Analysis
- 19.2.1.4. Recent Developments
- 19.2.1.5. Financials (Based on Availability)
- 19.2.2 Altana AG
- 19.2.2.1. Overview
- 19.2.2.2. Products
- 19.2.2.3. SWOT Analysis
- 19.2.2.4. Recent Developments
- 19.2.2.5. Financials (Based on Availability)
- 19.2.3 Pidilite Industries Ltd
- 19.2.3.1. Overview
- 19.2.3.2. Products
- 19.2.3.3. SWOT Analysis
- 19.2.3.4. Recent Developments
- 19.2.3.5. Financials (Based on Availability)
- 19.2.4 Venator Materials PLC
- 19.2.4.1. Overview
- 19.2.4.2. Products
- 19.2.4.3. SWOT Analysis
- 19.2.4.4. Recent Developments
- 19.2.4.5. Financials (Based on Availability)
- 19.2.5 LANXESS
- 19.2.5.1. Overview
- 19.2.5.2. Products
- 19.2.5.3. SWOT Analysis
- 19.2.5.4. Recent Developments
- 19.2.5.5. Financials (Based on Availability)
- 19.2.6 BASF SE
- 19.2.6.1. Overview
- 19.2.6.2. Products
- 19.2.6.3. SWOT Analysis
- 19.2.6.4. Recent Developments
- 19.2.6.5. Financials (Based on Availability)
- 19.2.7 Wellton Chemical Co Ltd*List Not Exhaustive
- 19.2.7.1. Overview
- 19.2.7.2. Products
- 19.2.7.3. SWOT Analysis
- 19.2.7.4. Recent Developments
- 19.2.7.5. Financials (Based on Availability)
- 19.2.8 The Chemours Company
- 19.2.8.1. Overview
- 19.2.8.2. Products
- 19.2.8.3. SWOT Analysis
- 19.2.8.4. Recent Developments
- 19.2.8.5. Financials (Based on Availability)
- 19.2.9 Tronox Holdings PLC
- 19.2.9.1. Overview
- 19.2.9.2. Products
- 19.2.9.3. SWOT Analysis
- 19.2.9.4. Recent Developments
- 19.2.9.5. Financials (Based on Availability)
- 19.2.10 DIC CORPORATION
- 19.2.10.1. Overview
- 19.2.10.2. Products
- 19.2.10.3. SWOT Analysis
- 19.2.10.4. Recent Developments
- 19.2.10.5. Financials (Based on Availability)
- 19.2.1 Sudarshan Chemical Industries Limited
List of Figures
- Figure 1: Asia Pacific Pigments Industry Revenue Breakdown (Million, %) by Product 2024 & 2032
- Figure 2: Asia Pacific Pigments Industry Share (%) by Company 2024
List of Tables
- Table 1: Asia Pacific Pigments Industry Revenue Million Forecast, by Region 2019 & 2032
- Table 2: Asia Pacific Pigments Industry Volume Kiloton Forecast, by Region 2019 & 2032
- Table 3: Asia Pacific Pigments Industry Revenue Million Forecast, by Product Type 2019 & 2032
- Table 4: Asia Pacific Pigments Industry Volume Kiloton Forecast, by Product Type 2019 & 2032
- Table 5: Asia Pacific Pigments Industry Revenue Million Forecast, by Application 2019 & 2032
- Table 6: Asia Pacific Pigments Industry Volume Kiloton Forecast, by Application 2019 & 2032
- Table 7: Asia Pacific Pigments Industry Revenue Million Forecast, by Geography 2019 & 2032
- Table 8: Asia Pacific Pigments Industry Volume Kiloton Forecast, by Geography 2019 & 2032
- Table 9: Asia Pacific Pigments Industry Revenue Million Forecast, by Region 2019 & 2032
- Table 10: Asia Pacific Pigments Industry Volume Kiloton Forecast, by Region 2019 & 2032
- Table 11: Asia Pacific Pigments Industry Revenue Million Forecast, by Country 2019 & 2032
- Table 12: Asia Pacific Pigments Industry Volume Kiloton Forecast, by Country 2019 & 2032
- Table 13: China Asia Pacific Pigments Industry Revenue (Million) Forecast, by Application 2019 & 2032
- Table 14: China Asia Pacific Pigments Industry Volume (Kiloton) Forecast, by Application 2019 & 2032
- Table 15: Japan Asia Pacific Pigments Industry Revenue (Million) Forecast, by Application 2019 & 2032
- Table 16: Japan Asia Pacific Pigments Industry Volume (Kiloton) Forecast, by Application 2019 & 2032
- Table 17: India Asia Pacific Pigments Industry Revenue (Million) Forecast, by Application 2019 & 2032
- Table 18: India Asia Pacific Pigments Industry Volume (Kiloton) Forecast, by Application 2019 & 2032
- Table 19: South Korea Asia Pacific Pigments Industry Revenue (Million) Forecast, by Application 2019 & 2032
- Table 20: South Korea Asia Pacific Pigments Industry Volume (Kiloton) Forecast, by Application 2019 & 2032
- Table 21: Taiwan Asia Pacific Pigments Industry Revenue (Million) Forecast, by Application 2019 & 2032
- Table 22: Taiwan Asia Pacific Pigments Industry Volume (Kiloton) Forecast, by Application 2019 & 2032
- Table 23: Australia Asia Pacific Pigments Industry Revenue (Million) Forecast, by Application 2019 & 2032
- Table 24: Australia Asia Pacific Pigments Industry Volume (Kiloton) Forecast, by Application 2019 & 2032
- Table 25: Rest of Asia-Pacific Asia Pacific Pigments Industry Revenue (Million) Forecast, by Application 2019 & 2032
- Table 26: Rest of Asia-Pacific Asia Pacific Pigments Industry Volume (Kiloton) Forecast, by Application 2019 & 2032
- Table 27: Asia Pacific Pigments Industry Revenue Million Forecast, by Product Type 2019 & 2032
- Table 28: Asia Pacific Pigments Industry Volume Kiloton Forecast, by Product Type 2019 & 2032
- Table 29: Asia Pacific Pigments Industry Revenue Million Forecast, by Application 2019 & 2032
- Table 30: Asia Pacific Pigments Industry Volume Kiloton Forecast, by Application 2019 & 2032
- Table 31: Asia Pacific Pigments Industry Revenue Million Forecast, by Geography 2019 & 2032
- Table 32: Asia Pacific Pigments Industry Volume Kiloton Forecast, by Geography 2019 & 2032
- Table 33: Asia Pacific Pigments Industry Revenue Million Forecast, by Country 2019 & 2032
- Table 34: Asia Pacific Pigments Industry Volume Kiloton Forecast, by Country 2019 & 2032
- Table 35: Asia Pacific Pigments Industry Revenue Million Forecast, by Product Type 2019 & 2032
- Table 36: Asia Pacific Pigments Industry Volume Kiloton Forecast, by Product Type 2019 & 2032
- Table 37: Asia Pacific Pigments Industry Revenue Million Forecast, by Application 2019 & 2032
- Table 38: Asia Pacific Pigments Industry Volume Kiloton Forecast, by Application 2019 & 2032
- Table 39: Asia Pacific Pigments Industry Revenue Million Forecast, by Geography 2019 & 2032
- Table 40: Asia Pacific Pigments Industry Volume Kiloton Forecast, by Geography 2019 & 2032
- Table 41: Asia Pacific Pigments Industry Revenue Million Forecast, by Country 2019 & 2032
- Table 42: Asia Pacific Pigments Industry Volume Kiloton Forecast, by Country 2019 & 2032
- Table 43: Asia Pacific Pigments Industry Revenue Million Forecast, by Product Type 2019 & 2032
- Table 44: Asia Pacific Pigments Industry Volume Kiloton Forecast, by Product Type 2019 & 2032
- Table 45: Asia Pacific Pigments Industry Revenue Million Forecast, by Application 2019 & 2032
- Table 46: Asia Pacific Pigments Industry Volume Kiloton Forecast, by Application 2019 & 2032
- Table 47: Asia Pacific Pigments Industry Revenue Million Forecast, by Geography 2019 & 2032
- Table 48: Asia Pacific Pigments Industry Volume Kiloton Forecast, by Geography 2019 & 2032
- Table 49: Asia Pacific Pigments Industry Revenue Million Forecast, by Country 2019 & 2032
- Table 50: Asia Pacific Pigments Industry Volume Kiloton Forecast, by Country 2019 & 2032
- Table 51: Asia Pacific Pigments Industry Revenue Million Forecast, by Product Type 2019 & 2032
- Table 52: Asia Pacific Pigments Industry Volume Kiloton Forecast, by Product Type 2019 & 2032
- Table 53: Asia Pacific Pigments Industry Revenue Million Forecast, by Application 2019 & 2032
- Table 54: Asia Pacific Pigments Industry Volume Kiloton Forecast, by Application 2019 & 2032
- Table 55: Asia Pacific Pigments Industry Revenue Million Forecast, by Geography 2019 & 2032
- Table 56: Asia Pacific Pigments Industry Volume Kiloton Forecast, by Geography 2019 & 2032
- Table 57: Asia Pacific Pigments Industry Revenue Million Forecast, by Country 2019 & 2032
- Table 58: Asia Pacific Pigments Industry Volume Kiloton Forecast, by Country 2019 & 2032
- Table 59: Asia Pacific Pigments Industry Revenue Million Forecast, by Product Type 2019 & 2032
- Table 60: Asia Pacific Pigments Industry Volume Kiloton Forecast, by Product Type 2019 & 2032
- Table 61: Asia Pacific Pigments Industry Revenue Million Forecast, by Application 2019 & 2032
- Table 62: Asia Pacific Pigments Industry Volume Kiloton Forecast, by Application 2019 & 2032
- Table 63: Asia Pacific Pigments Industry Revenue Million Forecast, by Geography 2019 & 2032
- Table 64: Asia Pacific Pigments Industry Volume Kiloton Forecast, by Geography 2019 & 2032
- Table 65: Asia Pacific Pigments Industry Revenue Million Forecast, by Country 2019 & 2032
- Table 66: Asia Pacific Pigments Industry Volume Kiloton Forecast, by Country 2019 & 2032
- Table 67: Asia Pacific Pigments Industry Revenue Million Forecast, by Product Type 2019 & 2032
- Table 68: Asia Pacific Pigments Industry Volume Kiloton Forecast, by Product Type 2019 & 2032
- Table 69: Asia Pacific Pigments Industry Revenue Million Forecast, by Application 2019 & 2032
- Table 70: Asia Pacific Pigments Industry Volume Kiloton Forecast, by Application 2019 & 2032
- Table 71: Asia Pacific Pigments Industry Revenue Million Forecast, by Geography 2019 & 2032
- Table 72: Asia Pacific Pigments Industry Volume Kiloton Forecast, by Geography 2019 & 2032
- Table 73: Asia Pacific Pigments Industry Revenue Million Forecast, by Country 2019 & 2032
- Table 74: Asia Pacific Pigments Industry Volume Kiloton Forecast, by Country 2019 & 2032
Frequently Asked Questions
1. What is the projected Compound Annual Growth Rate (CAGR) of the Asia Pacific Pigments Industry?
The projected CAGR is approximately > 5.50%.
2. Which companies are prominent players in the Asia Pacific Pigments Industry?
Key companies in the market include Sudarshan Chemical Industries Limited, Altana AG, Pidilite Industries Ltd, Venator Materials PLC, LANXESS, BASF SE, Wellton Chemical Co Ltd*List Not Exhaustive, The Chemours Company, Tronox Holdings PLC, DIC CORPORATION.
3. What are the main segments of the Asia Pacific Pigments Industry?
The market segments include Product Type, Application, Geography.
4. Can you provide details about the market size?
The market size is estimated to be USD 13.44 Million as of 2022.
5. What are some drivers contributing to market growth?
Growing Demand From the Paints and Coatings Industry; Rising Demand from the Textile Industry; The Increasing Demand for Pigments from Plastics Applications.
6. What are the notable trends driving market growth?
Increasing Demand from the Paints and Coatings Industry.
7. Are there any restraints impacting market growth?
Stringent Government Regulations on the usage of Pigments; High Cost Associated with the Organic Pigments.
8. Can you provide examples of recent developments in the market?
November 2022: Cathay Industries declared the successful acquisition of Venator Materials PLC's iron oxide pigment business. This strategic move is expected to facilitate the expansion of Cathay Industries' global manufacturing presence.
9. What pricing options are available for accessing the report?
Pricing options include single-user, multi-user, and enterprise licenses priced at USD 4750, USD 5250, and USD 8750 respectively.
10. Is the market size provided in terms of value or volume?
The market size is provided in terms of value, measured in Million and volume, measured in Kiloton.
11. Are there any specific market keywords associated with the report?
Yes, the market keyword associated with the report is "Asia Pacific Pigments Industry," which aids in identifying and referencing the specific market segment covered.
12. How do I determine which pricing option suits my needs best?
The pricing options vary based on user requirements and access needs. Individual users may opt for single-user licenses, while businesses requiring broader access may choose multi-user or enterprise licenses for cost-effective access to the report.
13. Are there any additional resources or data provided in the Asia Pacific Pigments Industry report?
While the report offers comprehensive insights, it's advisable to review the specific contents or supplementary materials provided to ascertain if additional resources or data are available.
14. How can I stay updated on further developments or reports in the Asia Pacific Pigments Industry?
To stay informed about further developments, trends, and reports in the Asia Pacific Pigments Industry, consider subscribing to industry newsletters, following relevant companies and organizations, or regularly checking reputable industry news sources and publications.
Methodology
Step 1 - Identification of Relevant Samples Size from Population Database


Step 2 - Approaches for Defining Global Market Size (Value, Volume* & Price*)

Note*: In applicable scenarios
Step 3 - Data Sources
Primary Research
- Web Analytics
- Survey Reports
- Research Institute
- Latest Research Reports
- Opinion Leaders
Secondary Research
- Annual Reports
- White Paper
- Latest Press Release
- Industry Association
- Paid Database
- Investor Presentations

Step 4 - Data Triangulation
Involves using different sources of information in order to increase the validity of a study
These sources are likely to be stakeholders in a program - participants, other researchers, program staff, other community members, and so on.
Then we put all data in single framework & apply various statistical tools to find out the dynamic on the market.
During the analysis stage, feedback from the stakeholder groups would be compared to determine areas of agreement as well as areas of divergence


