
Key Insights
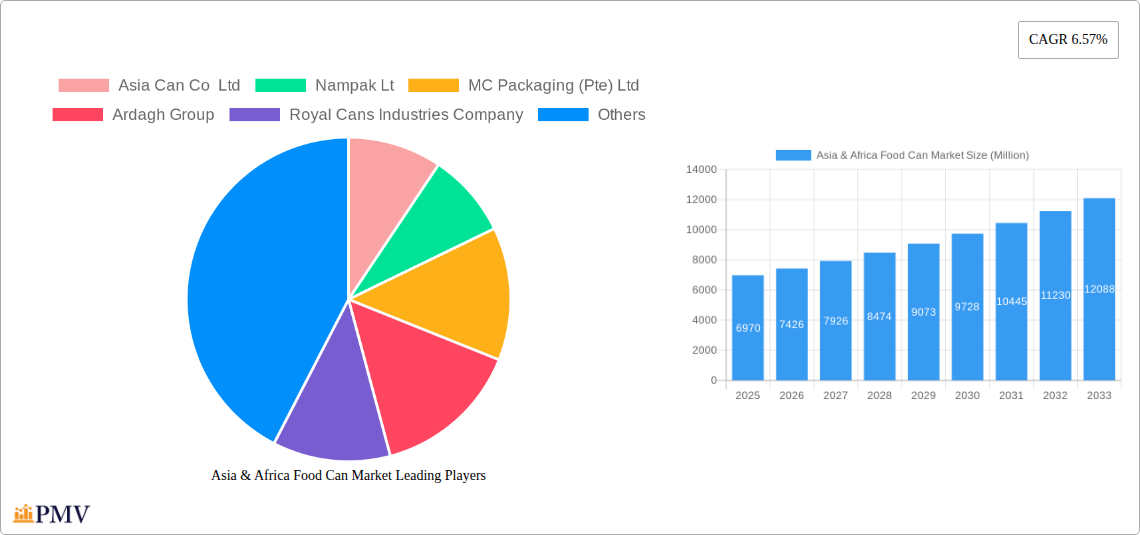
The Asia & Africa food can market, valued at $6.97 billion in 2025, is projected to experience robust growth, driven by several key factors. Rising disposable incomes, particularly in rapidly urbanizing areas of Asia and Africa, are fueling increased demand for convenient and shelf-stable food products. The growing popularity of processed and ready-to-eat meals, alongside the expanding pet food sector, significantly contributes to the market's expansion. Furthermore, advancements in can manufacturing technology, leading to lighter, more sustainable packaging options, are also bolstering market growth. Aluminum cans, known for their recyclability and lightweight properties, are gaining popularity over steel/tin cans, although the latter still holds significant market share due to established infrastructure and cost-effectiveness in certain regions. The market is segmented by can type (2-piece and 3-piece), material (aluminum and steel/tin), and application (fish and seafood, fruits and vegetables, processed food, and pet food). While growth is widespread, specific regional variations exist; for example, South Africa and Kenya show strong potential within the African market due to established food processing industries and increasing consumer preference for canned goods. However, challenges like fluctuating raw material prices and the need for improved waste management infrastructure pose potential restraints to the market's trajectory.
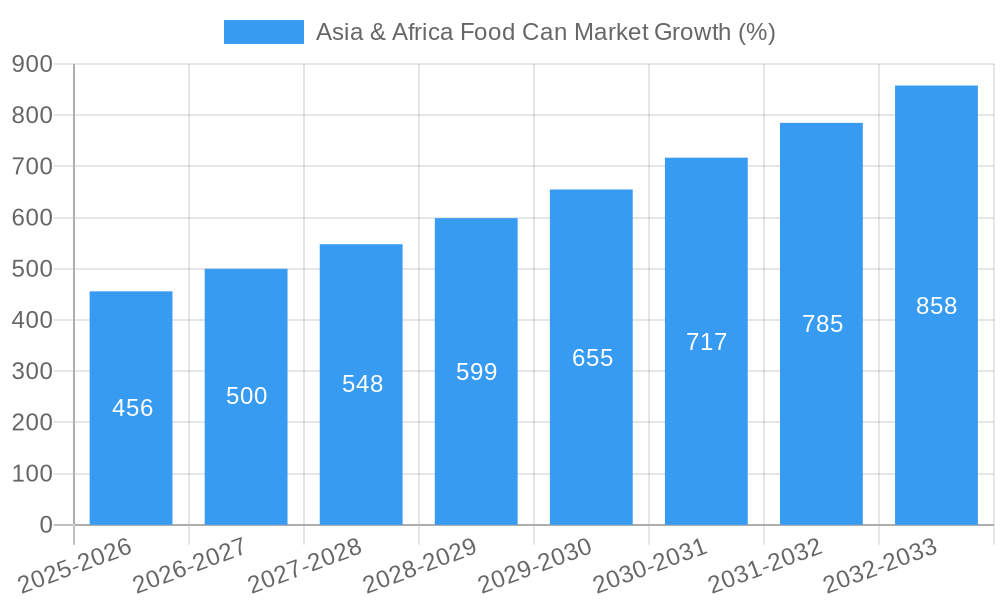
The projected Compound Annual Growth Rate (CAGR) of 6.57% for the 2025-2033 period indicates sustained growth. This positive outlook is further strengthened by ongoing efforts to improve food safety and preservation techniques, which are crucial in regions with varying levels of refrigeration infrastructure. Major players like Crown Holdings Inc., Silgan Holdings Inc., and Ardagh Group are actively investing in capacity expansion and technological advancements to meet the growing demand. The market's future is likely to be characterized by increased competition, innovation in packaging designs, and a growing focus on sustainable and eco-friendly practices within the can manufacturing industry. Companies are exploring options like lighter-gauge cans and increased use of recycled materials to address environmental concerns and improve their sustainability profiles.
Asia & Africa Food Can Market: A Comprehensive Report (2019-2033)
This comprehensive report provides an in-depth analysis of the Asia & Africa food can market, offering invaluable insights for industry stakeholders. Covering the period 2019-2033, with a base year of 2025 and a forecast period of 2025-2033, this report meticulously examines market size, growth drivers, competitive dynamics, and future trends. The report utilizes data from the historical period (2019-2024) to predict the future trajectory of this dynamic market. Expected market value at the estimated year 2025 is xx Million.
Asia & Africa Food Can Market Market Structure & Competitive Dynamics
The Asia & Africa food can market exhibits a moderately concentrated structure, with key players like Crown Holdings Inc, Silgan Holdings Inc, and Nampak Ltd holding significant market share. However, the presence of numerous regional players and emerging companies fosters competition. Innovation within the industry is driven by advancements in can manufacturing technologies, including lighter-weight materials and improved coatings for extended shelf life. Regulatory frameworks vary across countries, impacting material sourcing and production processes. Aluminum cans are increasingly preferred over steel/tin cans due to their lightweight nature and recyclability, although steel/tin cans remain dominant in certain segments. M&A activity in the food can sector has been moderate, with deal values averaging xx Million in recent years. End-user trends favor convenient and sustainable packaging, boosting demand for recyclable aluminum cans.
- Market Concentration: Moderately concentrated, with top players holding approximately xx% of the market share.
- Innovation Ecosystems: Focused on material efficiency, sustainability, and enhanced product preservation.
- Regulatory Frameworks: Vary across regions, impacting material choices and manufacturing standards.
- Product Substitutes: Include pouches, glass jars, and plastic containers, posing a competitive challenge.
- End-User Trends: Growing demand for convenience and sustainability.
- M&A Activities: Moderate activity, with recent deals valued at an average of xx Million.
Asia & Africa Food Can Market Industry Trends & Insights
The Asia & Africa food can market is experiencing robust growth, driven by factors such as rising urbanization, increasing disposable incomes, and a growing preference for processed and convenient foods. The Compound Annual Growth Rate (CAGR) is projected to be xx% during the forecast period (2025-2033). Technological disruptions, such as advancements in can coating and printing technologies, are enhancing product appeal and shelf life. Changing consumer preferences are leading to a higher demand for sustainable packaging, thereby driving the adoption of recyclable aluminum cans. Competitive dynamics are characterized by the ongoing expansion of major players, the emergence of regional can manufacturers, and increased focus on innovation. Market penetration of aluminum cans is steadily rising, especially in emerging economies. The market is segmented by Material (Aluminum Cans, Steel/Tin Cans), Can Type (2-piece, 3-piece), and Application (Fish and Seafood, Fruits and Vegetables, Processed Food, Pet Food, Other Applications). The changing dynamics across regions in Asia and Africa, coupled with shifts in consumer purchasing habits, drive market growth and fluctuations.
Dominant Markets & Segments in Asia & Africa Food Can Market
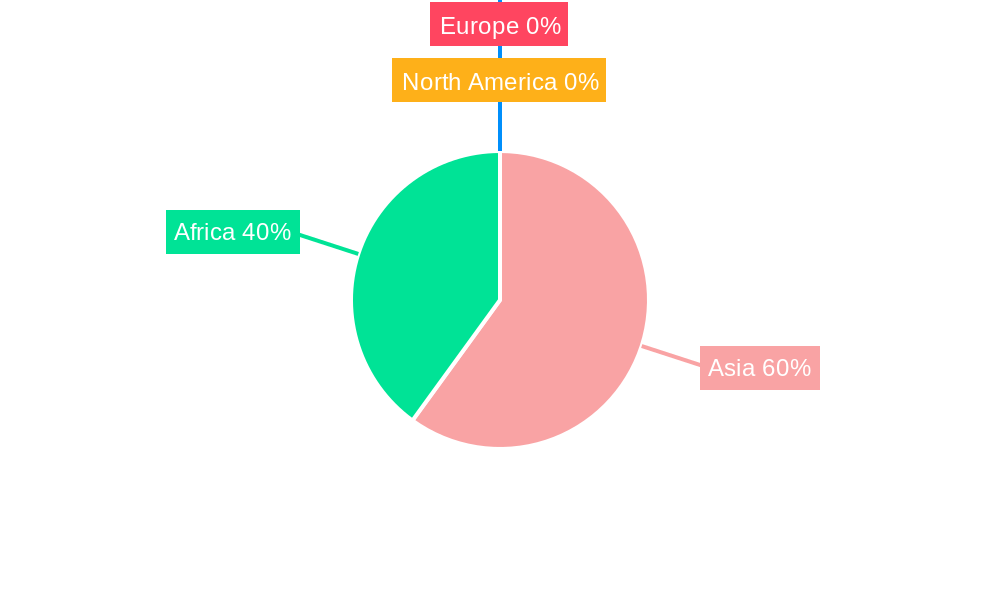
The Asia & Africa food can market shows significant regional variations. Within Asia, countries like India, China, and Indonesia are key markets due to their large populations and growing processed food sectors. In Africa, Nigeria and South Africa are significant markets given the growing demand for canned food.
- Dominant Region: Asia (xx% market share).
- Dominant Country: India (xx% of Asia's market).
- Dominant Material: Steel/Tin Cans (xx% market share), driven by cost-effectiveness in certain applications.
- Dominant Can Type: 2-piece cans (xx% market share), due to their ease of manufacturing and cost efficiency.
- Dominant Application: Processed food (xx% market share), reflecting the rising consumption of processed and convenient foods.
Key Drivers for Dominant Segments:
- Processed Food: Rising disposable incomes and changing lifestyles contribute to higher demand.
- Steel/Tin Cans: Cost-effectiveness makes them suitable for budget-conscious consumers and certain product types.
- 2-Piece Cans: Economical production methods and ease of manufacturing contribute to market dominance.
- India & China: Massive populations and expanding food processing sectors fuel market growth.
Asia & Africa Food Can Market Product Innovations
Recent product innovations focus on lightweight, sustainable designs, improved coatings for extended shelf life, and enhanced printing capabilities for better branding. Technological advancements are driving the development of easy-open cans and cans with improved barrier properties to ensure optimal product preservation. These innovations aim to meet consumer demands for convenience and sustainability while enhancing product quality and shelf life. This, in turn, fuels competition and drives market growth.
Report Segmentation & Scope
This report segments the Asia & Africa food can market based on Material (Aluminum Cans, Steel/Tin Cans), Can Type (2-piece, 3-piece), and Application (Fish and Seafood, Fruits and Vegetables, Processed Food, Pet Food, Other Applications). Each segment's growth trajectory, market size, and competitive dynamics are analyzed in detail. Aluminum cans are expected to experience a higher CAGR than steel/tin cans due to rising preference for eco-friendly packaging. The 2-piece can segment is projected to grow faster than the 3-piece can segment because of its manufacturing efficiency. Processed food applications represent the largest market segment, followed by fruits and vegetables and fish and seafood.
Key Drivers of Asia & Africa Food Can Market Growth
Several key factors drive the growth of the Asia & Africa food can market:
- Rising disposable incomes: Increase in purchasing power supports the consumption of processed foods.
- Urbanization: Shift to urban centers drives demand for convenient food options.
- Technological advancements: Improved can manufacturing technologies improve shelf life and product quality.
- Government regulations: Policies promoting food safety and standardization benefit the canned food sector.
- Expansion of the organized retail sector: Increased availability of canned food products boosts market growth.
Challenges in the Asia & Africa Food Can Market Sector
Challenges facing the Asia & Africa food can market include:
- Fluctuating raw material prices: Impacts production costs and profitability.
- Supply chain disruptions: Disruptions in logistics and transportation can affect the availability of cans.
- Competition from alternative packaging: Pouch packaging and other alternatives pose a competitive threat.
- Stringent environmental regulations: Pressure to adopt sustainable and recyclable packaging materials.
Leading Players in the Asia & Africa Food Can Market Market
- Asia Can Co Ltd
- Nampak Ltd
- MC Packaging (Pte) Ltd
- Ardagh Group
- Royal Cans Industries Company
- Dongwon Systems
- Crown Holdings Inc
- CPMC Holdings Limited
- CanSmart Group
- Toyo Seikan Group Holdings Ltd
- Kaira Can Private Limited
- Kian Joo Can Factory (Can One)
- Silgan Holdings Inc
- ORG Packaging Co Limited
- Can It
Key Developments in Asia & Africa Food Can Market Sector
- November 2020: Nestle announced the expansion of its cereal business production in Zimbabwe, aiming for a more than 30% production increase. This signifies growing demand for canned food products in the region.
- February 2021: Tyson Foods and Malayan Flour Mills Berhad (MFM) announced a partnership, with Tyson Foods investing in MFM's poultry business. This development is likely to increase the supply of poultry for canning, thus boosting the food can market.
Strategic Asia & Africa Food Can Market Market Outlook
The Asia & Africa food can market presents significant growth potential, driven by continued urbanization, rising disposable incomes, and growing demand for convenient and sustainable food packaging. Strategic opportunities lie in investing in innovative can manufacturing technologies, expanding into new markets, and focusing on sustainable packaging solutions. The focus on eco-friendly materials and improved supply chain management are key strategic priorities for growth in this market. The market is set for expansion as consumer demand and industry innovation continue to evolve.
Asia & Africa Food Can Market Segmentation
-
1. Material
- 1.1. Aluminum Cans
- 1.2. Steel/Tin Cans
-
2. Can Type
- 2.1. 2-piece
- 2.2. 3-piece
-
3. Application
- 3.1. Fish and Seafood
- 3.2. Fruits and Vegetables
- 3.3. Processed Food
- 3.4. Pet Food
- 3.5. Other Applications
-
4. Geography
-
4.1. Asia
- 4.1.1. China
- 4.1.2. India
- 4.1.3. South Korea
- 4.1.4. Southeast Asia
-
4.2. Africa
- 4.2.1. South Africa
-
4.1. Asia
Asia & Africa Food Can Market Segmentation By Geography
-
1. Asia
- 1.1. China
- 1.2. India
- 1.3. South Korea
- 1.4. Southeast Asia
-
2. Africa
- 2.1. South Africa
Asia & Africa Food Can Market REPORT HIGHLIGHTS
| Aspects | Details |
|---|---|
| Study Period | 2019-2033 |
| Base Year | 2024 |
| Estimated Year | 2025 |
| Forecast Period | 2025-2033 |
| Historical Period | 2019-2024 |
| Growth Rate | CAGR of 6.57% from 2019-2033 |
| Segmentation |
|
Table of Contents
- 1. Introduction
- 1.1. Research Scope
- 1.2. Market Segmentation
- 1.3. Research Methodology
- 1.4. Definitions and Assumptions
- 2. Executive Summary
- 2.1. Introduction
- 3. Market Dynamics
- 3.1. Introduction
- 3.2. Market Drivers
- 3.2.1. High Recyclable Score of Metal Cans over Alternatives; Demand for Canned Foods Driven by Cost and Convenience-related Advantages; Product Innovations Leading to Increased Shelf Life
- 3.3. Market Restrains
- 3.3.1. ; Stringent Regulations on the Usage of Plastic Bottles
- 3.4. Market Trends
- 3.4.1. Fruits and Vegetables to Drive the Market Growth
- 4. Market Factor Analysis
- 4.1. Porters Five Forces
- 4.2. Supply/Value Chain
- 4.3. PESTEL analysis
- 4.4. Market Entropy
- 4.5. Patent/Trademark Analysis
- 5. Asia & Africa Food Can Market Analysis, Insights and Forecast, 2019-2031
- 5.1. Market Analysis, Insights and Forecast - by Material
- 5.1.1. Aluminum Cans
- 5.1.2. Steel/Tin Cans
- 5.2. Market Analysis, Insights and Forecast - by Can Type
- 5.2.1. 2-piece
- 5.2.2. 3-piece
- 5.3. Market Analysis, Insights and Forecast - by Application
- 5.3.1. Fish and Seafood
- 5.3.2. Fruits and Vegetables
- 5.3.3. Processed Food
- 5.3.4. Pet Food
- 5.3.5. Other Applications
- 5.4. Market Analysis, Insights and Forecast - by Geography
- 5.4.1. Asia
- 5.4.1.1. China
- 5.4.1.2. India
- 5.4.1.3. South Korea
- 5.4.1.4. Southeast Asia
- 5.4.2. Africa
- 5.4.2.1. South Africa
- 5.4.1. Asia
- 5.5. Market Analysis, Insights and Forecast - by Region
- 5.5.1. Asia
- 5.5.2. Africa
- 5.1. Market Analysis, Insights and Forecast - by Material
- 6. Asia Asia & Africa Food Can Market Analysis, Insights and Forecast, 2019-2031
- 6.1. Market Analysis, Insights and Forecast - by Material
- 6.1.1. Aluminum Cans
- 6.1.2. Steel/Tin Cans
- 6.2. Market Analysis, Insights and Forecast - by Can Type
- 6.2.1. 2-piece
- 6.2.2. 3-piece
- 6.3. Market Analysis, Insights and Forecast - by Application
- 6.3.1. Fish and Seafood
- 6.3.2. Fruits and Vegetables
- 6.3.3. Processed Food
- 6.3.4. Pet Food
- 6.3.5. Other Applications
- 6.4. Market Analysis, Insights and Forecast - by Geography
- 6.4.1. Asia
- 6.4.1.1. China
- 6.4.1.2. India
- 6.4.1.3. South Korea
- 6.4.1.4. Southeast Asia
- 6.4.2. Africa
- 6.4.2.1. South Africa
- 6.4.1. Asia
- 6.1. Market Analysis, Insights and Forecast - by Material
- 7. Africa Asia & Africa Food Can Market Analysis, Insights and Forecast, 2019-2031
- 7.1. Market Analysis, Insights and Forecast - by Material
- 7.1.1. Aluminum Cans
- 7.1.2. Steel/Tin Cans
- 7.2. Market Analysis, Insights and Forecast - by Can Type
- 7.2.1. 2-piece
- 7.2.2. 3-piece
- 7.3. Market Analysis, Insights and Forecast - by Application
- 7.3.1. Fish and Seafood
- 7.3.2. Fruits and Vegetables
- 7.3.3. Processed Food
- 7.3.4. Pet Food
- 7.3.5. Other Applications
- 7.4. Market Analysis, Insights and Forecast - by Geography
- 7.4.1. Asia
- 7.4.1.1. China
- 7.4.1.2. India
- 7.4.1.3. South Korea
- 7.4.1.4. Southeast Asia
- 7.4.2. Africa
- 7.4.2.1. South Africa
- 7.4.1. Asia
- 7.1. Market Analysis, Insights and Forecast - by Material
- 8. South Africa Asia & Africa Food Can Market Analysis, Insights and Forecast, 2019-2031
- 9. Sudan Asia & Africa Food Can Market Analysis, Insights and Forecast, 2019-2031
- 10. Uganda Asia & Africa Food Can Market Analysis, Insights and Forecast, 2019-2031
- 11. Tanzania Asia & Africa Food Can Market Analysis, Insights and Forecast, 2019-2031
- 12. Kenya Asia & Africa Food Can Market Analysis, Insights and Forecast, 2019-2031
- 13. Rest of Africa Asia & Africa Food Can Market Analysis, Insights and Forecast, 2019-2031
- 14. Competitive Analysis
- 14.1. Market Share Analysis 2024
- 14.2. Company Profiles
- 14.2.1 Asia Can Co Ltd
- 14.2.1.1. Overview
- 14.2.1.2. Products
- 14.2.1.3. SWOT Analysis
- 14.2.1.4. Recent Developments
- 14.2.1.5. Financials (Based on Availability)
- 14.2.2 Nampak Lt
- 14.2.2.1. Overview
- 14.2.2.2. Products
- 14.2.2.3. SWOT Analysis
- 14.2.2.4. Recent Developments
- 14.2.2.5. Financials (Based on Availability)
- 14.2.3 MC Packaging (Pte) Ltd
- 14.2.3.1. Overview
- 14.2.3.2. Products
- 14.2.3.3. SWOT Analysis
- 14.2.3.4. Recent Developments
- 14.2.3.5. Financials (Based on Availability)
- 14.2.4 Ardagh Group
- 14.2.4.1. Overview
- 14.2.4.2. Products
- 14.2.4.3. SWOT Analysis
- 14.2.4.4. Recent Developments
- 14.2.4.5. Financials (Based on Availability)
- 14.2.5 Royal Cans Industries Company
- 14.2.5.1. Overview
- 14.2.5.2. Products
- 14.2.5.3. SWOT Analysis
- 14.2.5.4. Recent Developments
- 14.2.5.5. Financials (Based on Availability)
- 14.2.6 Dongwon Systems
- 14.2.6.1. Overview
- 14.2.6.2. Products
- 14.2.6.3. SWOT Analysis
- 14.2.6.4. Recent Developments
- 14.2.6.5. Financials (Based on Availability)
- 14.2.7 Crown Holdings Inc
- 14.2.7.1. Overview
- 14.2.7.2. Products
- 14.2.7.3. SWOT Analysis
- 14.2.7.4. Recent Developments
- 14.2.7.5. Financials (Based on Availability)
- 14.2.8 CPMC Holdings Limited
- 14.2.8.1. Overview
- 14.2.8.2. Products
- 14.2.8.3. SWOT Analysis
- 14.2.8.4. Recent Developments
- 14.2.8.5. Financials (Based on Availability)
- 14.2.9 CanSmart Group
- 14.2.9.1. Overview
- 14.2.9.2. Products
- 14.2.9.3. SWOT Analysis
- 14.2.9.4. Recent Developments
- 14.2.9.5. Financials (Based on Availability)
- 14.2.10 Toyo Seikan Group Holdings Ltd
- 14.2.10.1. Overview
- 14.2.10.2. Products
- 14.2.10.3. SWOT Analysis
- 14.2.10.4. Recent Developments
- 14.2.10.5. Financials (Based on Availability)
- 14.2.11 Kaira Can Private Limited
- 14.2.11.1. Overview
- 14.2.11.2. Products
- 14.2.11.3. SWOT Analysis
- 14.2.11.4. Recent Developments
- 14.2.11.5. Financials (Based on Availability)
- 14.2.12 Kian Joo Can Factory (Can One)
- 14.2.12.1. Overview
- 14.2.12.2. Products
- 14.2.12.3. SWOT Analysis
- 14.2.12.4. Recent Developments
- 14.2.12.5. Financials (Based on Availability)
- 14.2.13 Silgan Holdings Inc
- 14.2.13.1. Overview
- 14.2.13.2. Products
- 14.2.13.3. SWOT Analysis
- 14.2.13.4. Recent Developments
- 14.2.13.5. Financials (Based on Availability)
- 14.2.14 ORG Packaging Co Limited
- 14.2.14.1. Overview
- 14.2.14.2. Products
- 14.2.14.3. SWOT Analysis
- 14.2.14.4. Recent Developments
- 14.2.14.5. Financials (Based on Availability)
- 14.2.15 Can It
- 14.2.15.1. Overview
- 14.2.15.2. Products
- 14.2.15.3. SWOT Analysis
- 14.2.15.4. Recent Developments
- 14.2.15.5. Financials (Based on Availability)
- 14.2.1 Asia Can Co Ltd
List of Figures
- Figure 1: Asia & Africa Food Can Market Revenue Breakdown (Million, %) by Product 2024 & 2032
- Figure 2: Asia & Africa Food Can Market Share (%) by Company 2024
List of Tables
- Table 1: Asia & Africa Food Can Market Revenue Million Forecast, by Region 2019 & 2032
- Table 2: Asia & Africa Food Can Market Revenue Million Forecast, by Material 2019 & 2032
- Table 3: Asia & Africa Food Can Market Revenue Million Forecast, by Can Type 2019 & 2032
- Table 4: Asia & Africa Food Can Market Revenue Million Forecast, by Application 2019 & 2032
- Table 5: Asia & Africa Food Can Market Revenue Million Forecast, by Geography 2019 & 2032
- Table 6: Asia & Africa Food Can Market Revenue Million Forecast, by Region 2019 & 2032
- Table 7: Asia & Africa Food Can Market Revenue Million Forecast, by Country 2019 & 2032
- Table 8: South Africa Asia & Africa Food Can Market Revenue (Million) Forecast, by Application 2019 & 2032
- Table 9: Sudan Asia & Africa Food Can Market Revenue (Million) Forecast, by Application 2019 & 2032
- Table 10: Uganda Asia & Africa Food Can Market Revenue (Million) Forecast, by Application 2019 & 2032
- Table 11: Tanzania Asia & Africa Food Can Market Revenue (Million) Forecast, by Application 2019 & 2032
- Table 12: Kenya Asia & Africa Food Can Market Revenue (Million) Forecast, by Application 2019 & 2032
- Table 13: Rest of Africa Asia & Africa Food Can Market Revenue (Million) Forecast, by Application 2019 & 2032
- Table 14: Asia & Africa Food Can Market Revenue Million Forecast, by Material 2019 & 2032
- Table 15: Asia & Africa Food Can Market Revenue Million Forecast, by Can Type 2019 & 2032
- Table 16: Asia & Africa Food Can Market Revenue Million Forecast, by Application 2019 & 2032
- Table 17: Asia & Africa Food Can Market Revenue Million Forecast, by Geography 2019 & 2032
- Table 18: Asia & Africa Food Can Market Revenue Million Forecast, by Country 2019 & 2032
- Table 19: China Asia & Africa Food Can Market Revenue (Million) Forecast, by Application 2019 & 2032
- Table 20: India Asia & Africa Food Can Market Revenue (Million) Forecast, by Application 2019 & 2032
- Table 21: South Korea Asia & Africa Food Can Market Revenue (Million) Forecast, by Application 2019 & 2032
- Table 22: Southeast Asia Asia & Africa Food Can Market Revenue (Million) Forecast, by Application 2019 & 2032
- Table 23: Asia & Africa Food Can Market Revenue Million Forecast, by Material 2019 & 2032
- Table 24: Asia & Africa Food Can Market Revenue Million Forecast, by Can Type 2019 & 2032
- Table 25: Asia & Africa Food Can Market Revenue Million Forecast, by Application 2019 & 2032
- Table 26: Asia & Africa Food Can Market Revenue Million Forecast, by Geography 2019 & 2032
- Table 27: Asia & Africa Food Can Market Revenue Million Forecast, by Country 2019 & 2032
- Table 28: South Africa Asia & Africa Food Can Market Revenue (Million) Forecast, by Application 2019 & 2032
Frequently Asked Questions
1. What is the projected Compound Annual Growth Rate (CAGR) of the Asia & Africa Food Can Market?
The projected CAGR is approximately 6.57%.
2. Which companies are prominent players in the Asia & Africa Food Can Market?
Key companies in the market include Asia Can Co Ltd, Nampak Lt, MC Packaging (Pte) Ltd, Ardagh Group, Royal Cans Industries Company, Dongwon Systems, Crown Holdings Inc, CPMC Holdings Limited, CanSmart Group, Toyo Seikan Group Holdings Ltd, Kaira Can Private Limited, Kian Joo Can Factory (Can One), Silgan Holdings Inc, ORG Packaging Co Limited, Can It.
3. What are the main segments of the Asia & Africa Food Can Market?
The market segments include Material, Can Type , Application, Geography.
4. Can you provide details about the market size?
The market size is estimated to be USD 6.97 Million as of 2022.
5. What are some drivers contributing to market growth?
High Recyclable Score of Metal Cans over Alternatives; Demand for Canned Foods Driven by Cost and Convenience-related Advantages; Product Innovations Leading to Increased Shelf Life.
6. What are the notable trends driving market growth?
Fruits and Vegetables to Drive the Market Growth.
7. Are there any restraints impacting market growth?
; Stringent Regulations on the Usage of Plastic Bottles.
8. Can you provide examples of recent developments in the market?
February 2021 - Tyson Foods and Malayan Flour Mills Berhad (MFM) announced a partnership in which Tyson Foods is expected to invest in MFM's vertically integrated poultry business, thus adding more supply flexibility for both companies.
9. What pricing options are available for accessing the report?
Pricing options include single-user, multi-user, and enterprise licenses priced at USD 4750, USD 5250, and USD 8750 respectively.
10. Is the market size provided in terms of value or volume?
The market size is provided in terms of value, measured in Million.
11. Are there any specific market keywords associated with the report?
Yes, the market keyword associated with the report is "Asia & Africa Food Can Market," which aids in identifying and referencing the specific market segment covered.
12. How do I determine which pricing option suits my needs best?
The pricing options vary based on user requirements and access needs. Individual users may opt for single-user licenses, while businesses requiring broader access may choose multi-user or enterprise licenses for cost-effective access to the report.
13. Are there any additional resources or data provided in the Asia & Africa Food Can Market report?
While the report offers comprehensive insights, it's advisable to review the specific contents or supplementary materials provided to ascertain if additional resources or data are available.
14. How can I stay updated on further developments or reports in the Asia & Africa Food Can Market?
To stay informed about further developments, trends, and reports in the Asia & Africa Food Can Market, consider subscribing to industry newsletters, following relevant companies and organizations, or regularly checking reputable industry news sources and publications.
Methodology
Step 1 - Identification of Relevant Samples Size from Population Database


Step 2 - Approaches for Defining Global Market Size (Value, Volume* & Price*)

Note*: In applicable scenarios
Step 3 - Data Sources
Primary Research
- Web Analytics
- Survey Reports
- Research Institute
- Latest Research Reports
- Opinion Leaders
Secondary Research
- Annual Reports
- White Paper
- Latest Press Release
- Industry Association
- Paid Database
- Investor Presentations

Step 4 - Data Triangulation
Involves using different sources of information in order to increase the validity of a study
These sources are likely to be stakeholders in a program - participants, other researchers, program staff, other community members, and so on.
Then we put all data in single framework & apply various statistical tools to find out the dynamic on the market.
During the analysis stage, feedback from the stakeholder groups would be compared to determine areas of agreement as well as areas of divergence


