


Key Insights
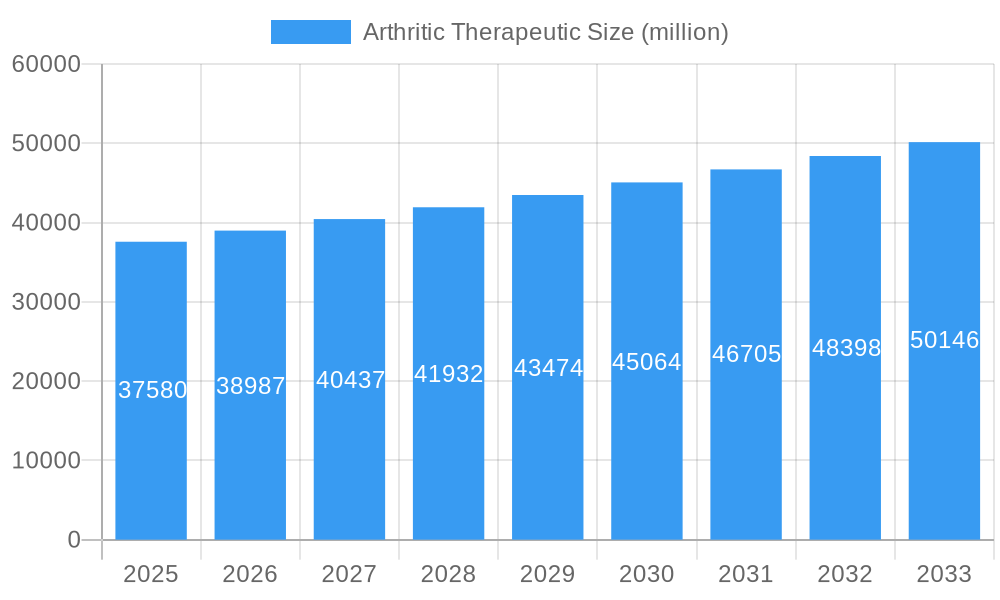
The global Arthritic Therapeutic market is projected for significant expansion, anticipated to reach $3.5 billion by 2025, with a compound annual growth rate (CAGR) of 7.14% during the forecast period. This growth is primarily driven by the increasing incidence of arthritis types such as rheumatoid arthritis, osteoarthritis, psoriatic arthritis, and ankylosing spondylitis, linked to an aging global population and evolving lifestyle factors. Enhanced awareness of effective treatment options and breakthroughs in drug discovery, particularly in advanced biologic therapies offering targeted and potent solutions for inflammatory and autoimmune arthritic conditions, are key growth catalysts. Furthermore, escalating global healthcare spending, alongside improved access to advanced medical infrastructure and treatments, especially in emerging markets, is bolstering the market's upward trend. The fibromyalgia segment also presents a growing area of focus for therapeutic innovation.
Arthritic Therapeutic Market Size (In Billion)

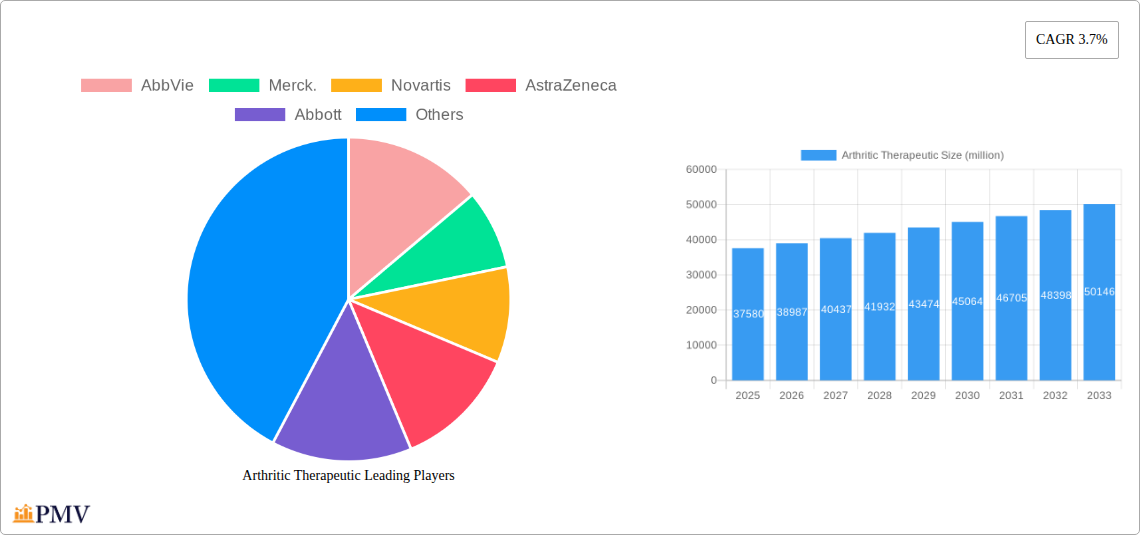
The Arthritic Therapeutic market features a wide array of treatment modalities and a competitive environment led by major pharmaceutical corporations. Biologics, including monoclonal antibodies and fusion proteins, are a rapidly growing segment, demonstrating superior efficacy in managing chronic and severe arthritic conditions. Non-biologics, such as NSAIDs and DMARDs, maintain a substantial market share due to their cost-effectiveness and broad accessibility for less severe arthritis cases. Leading market participants, including AbbVie, Merck, Novartis, AstraZeneca, and Pfizer, are making substantial R&D investments to launch novel therapies and broaden their product offerings. Geographically, North America and Europe currently lead the market, attributed to well-developed healthcare systems and high disease prevalence. Nevertheless, the Asia Pacific region is emerging as a critical growth hub, propelled by increased healthcare investments, a growing patient demographic, and rising disposable incomes, which enhance access to advanced treatments. Addressing the unmet needs in managing complex arthritic conditions and developing affordable solutions will be paramount for sustained market growth.
Arthritic Therapeutic Company Market Share
Arthritic Therapeutic Market Report: Comprehensive Analysis & Future Outlook (2019-2033)
This in-depth report provides a detailed analysis of the global Arthritic Therapeutic market, encompassing its current structure, future trends, dominant segments, and key players. Spanning the historical period of 2019-2024, with a base and estimated year of 2025, and a comprehensive forecast period of 2025-2033, this research offers actionable insights for industry stakeholders. We leverage millions of data points to deliver precise market valuations and growth projections, focusing on critical segments like Rheumatoid Arthritis, Osteoarthritis, Psoriatic Arthritis, Ankylosing Spondylitis, Fibromyalgia, and Others, across Biologics and Non-biologics. Key companies analyzed include AbbVie, Merck, Novartis, AstraZeneca, Abbott, Amgen, Baxter, Bristol-Myers Squibb, F. Hoffmann-La Roche, Eli Lilly, Johnson & Johnson, GlaxoSmithKline, Celgene, and Pfizer.
Arthritic Therapeutic Market Structure & Competitive Dynamics
The Arthritic Therapeutic market is characterized by a moderate to high level of concentration, with several global pharmaceutical giants holding significant market share. Innovation ecosystems are robust, driven by continuous research and development in understanding disease pathways and developing targeted therapies. Regulatory frameworks, overseen by bodies like the FDA and EMA, play a crucial role in drug approval, market access, and pricing strategies. The presence of numerous therapeutic options, including biologics and non-biologics, introduces a degree of substitutability, impacting competitive dynamics. End-user trends are increasingly focused on personalized medicine, improved patient outcomes, and cost-effectiveness. Mergers and acquisitions (M&A) activities are prevalent, with significant M&A deal values in the millions of dollars, as companies seek to expand their portfolios, gain access to novel technologies, and consolidate market positions. For instance, strategic acquisitions of smaller biotech firms with promising pipeline assets have become a common tactic. The market share distribution reflects the R&D investments and commercial success of established players in key therapeutic areas.
Arthritic Therapeutic Industry Trends & Insights
The Arthritic Therapeutic market is poised for substantial growth, with an estimated Compound Annual Growth Rate (CAGR) of over 7% projected for the forecast period. This upward trajectory is fueled by a confluence of factors, including the increasing global prevalence of arthritis due to aging populations and rising obesity rates. Technological disruptions are significantly reshaping the landscape, with advancements in gene editing, precision medicine, and digital health platforms enabling more targeted and effective treatments. Biologics, particularly monoclonal antibodies and Janus kinase (JAK) inhibitors, continue to dominate the therapeutic landscape, offering improved efficacy and safety profiles for chronic inflammatory conditions like Rheumatoid Arthritis and Psoriatic Arthritis. The market penetration of novel therapies is steadily increasing as payers recognize their long-term value proposition in reducing disease progression and healthcare costs. Consumer preferences are shifting towards less invasive treatment options, faster symptom relief, and greater patient empowerment through accessible information and support systems. Competitive dynamics are intensifying, with ongoing patent expiries of blockbuster drugs prompting a focus on biosimil development and innovative new molecular entities. Strategic partnerships and collaborations between pharmaceutical companies, academic institutions, and technology providers are becoming more critical for accelerating drug discovery and development. The integration of artificial intelligence (AI) in drug discovery and clinical trial optimization is also emerging as a key trend, promising to streamline R&D processes and reduce time-to-market for new arthritic therapies.
Dominant Markets & Segments in Arthritic Therapeutic
The global Arthritic Therapeutic market is dominated by Osteoarthritis and Rheumatoid Arthritis applications, which together account for an estimated 60% of the total market value. Within these, Biologics represent the fastest-growing segment, driven by their superior efficacy in managing inflammatory and autoimmune arthritic conditions.
- Osteoarthritis: This segment, while historically dominated by non-biologics like NSAIDs and corticosteroids, is witnessing increasing interest in novel biologics and regenerative medicine approaches due to its high prevalence in aging populations. Economic policies supporting the development of gerontological healthcare and advancements in orthopedic technologies are key drivers.
- Rheumatoid Arthritis: This autoimmune disease has been a prime target for biologics, leading to significant market penetration and a substantial share for therapies like TNF inhibitors and JAK inhibitors. The stringent regulatory pathways for biologics, coupled with robust clinical trial data, solidify their dominance.
- Psoriatic Arthritis: Similar to Rheumatoid Arthritis, this segment benefits from the advancements in biologic therapies, with considerable market growth attributed to targeted treatments that address both skin and joint manifestations. The increasing awareness and diagnosis of this condition are further contributing to its expansion.
- Ankylosing Spondylitis: This inflammatory arthritis also sees a strong uptake of biologics, particularly those targeting the IL-17 pathway. The chronic nature of the disease and the need for long-term symptom management create a sustained demand for these high-value therapies.
- Fibromyalgia: While less defined by traditional inflammatory markers, this chronic pain condition is seeing emerging therapeutic strategies, including non-pharmacological interventions and select pharmaceutical agents. The market for fibromyalgia treatments is still evolving, with potential for growth in novel drug development.
- Others: This category includes less common forms of arthritis and related conditions, which collectively represent a smaller but important segment of the market.
The dominance of these segments is further reinforced by significant R&D investments from leading pharmaceutical companies, robust clinical trial pipelines, and favorable reimbursement policies in key geographical regions.
Arthritic Therapeutic Product Innovations
Product innovations in the Arthritic Therapeutic sector are primarily focused on developing highly targeted therapies with improved efficacy and reduced side effects. This includes the advancement of next-generation biologics, such as novel monoclonal antibodies and antibody-drug conjugates, designed to modulate specific immune pathways implicated in various forms of arthritis. Furthermore, significant efforts are directed towards exploring regenerative medicine approaches, including stem cell therapies and gene therapies, to repair damaged joint tissues and reverse disease progression. The competitive advantage of these innovations lies in their potential to offer disease-modifying capabilities, moving beyond symptom management to address the underlying causes of arthritic conditions. Technological trends such as AI-driven drug discovery are accelerating the identification of novel therapeutic targets and the design of more effective drug candidates, ensuring a strong market fit for these advanced treatments.
Report Segmentation & Scope
This report meticulously segments the Arthritic Therapeutic market across key applications and therapeutic types. The Application segmentation includes Rheumatoid Arthritis, Osteoarthritis, Psoriatic Arthritis, Ankylosing Spondylitis, Fibromyalgia, and Others. For each application, we provide detailed market size projections and growth forecasts, analyzing the competitive dynamics and the impact of prevailing healthcare policies. The Type segmentation categorizes the market into Biologics and Non-biologics. Biologics, a rapidly expanding segment, are further analyzed for their specific mechanisms of action and market penetration. Non-biologics, encompassing traditional pain relievers, NSAIDs, and corticosteroids, are examined for their continued role and evolving market share.
Key Drivers of Arthritic Therapeutic Growth
The arthritic therapeutic market is experiencing robust growth driven by several interconnected factors. Firstly, the increasing global prevalence of arthritis, attributed to aging populations and rising rates of obesity, creates a continuously expanding patient pool. Secondly, advancements in pharmaceutical research and development are leading to the discovery and approval of novel, more effective, and targeted therapies, particularly biologics, which offer significant improvements in managing complex inflammatory conditions. Thirdly, rising healthcare expenditures and improved access to healthcare services in emerging economies are expanding the market reach for arthritic treatments. Finally, growing patient awareness and demand for better quality of life are pushing for more effective pain management and disease modification strategies.
Challenges in the Arthritic Therapeutic Sector
Despite its growth, the arthritic therapeutic sector faces several significant challenges. High research and development costs associated with novel drug discovery, particularly for biologics, pose a considerable barrier to entry and a strain on profitability. Stringent regulatory approval processes can lead to lengthy timelines and substantial investment before market entry. Patent expirations of blockbuster drugs and the subsequent rise of biosimil competition put pressure on pricing and revenue streams for originator products. Reimbursement hurdles and pricing pressures from payers can limit market access and adoption of expensive therapies. Additionally, challenges in patient adherence to long-term treatment regimens and the need for continuous monitoring and management of side effects remain critical considerations.
Leading Players in the Arthritic Therapeutic Market
- AbbVie
- Merck
- Novartis
- AstraZeneca
- Abbott
- Amgen
- Baxter
- Bristol-Myers Squibb
- F. Hoffmann-La Roche
- Eli Lilly
- Johnson & Johnson
- GlaxoSmithKline
- Celgene
- Pfizer
Key Developments in Arthritic Therapeutic Sector
- 2023: Launch of a new JAK inhibitor with improved safety profile for Rheumatoid Arthritis.
- 2023: Acquisition of a biotech company with a promising gene therapy pipeline for Osteoarthritis.
- 2022: Approval of a novel biologic targeting IL-17 for Psoriatic Arthritis, expanding treatment options.
- 2022: Significant investment in AI-driven drug discovery platforms for identifying new arthritic therapeutic targets.
- 2021: Introduction of a biosimilar for a leading TNF inhibitor, increasing market competition and patient access.
Strategic Arthritic Therapeutic Market Outlook
The strategic outlook for the Arthritic Therapeutic market remains highly positive, driven by the persistent unmet medical needs and continuous innovation. Growth accelerators include the expanding pipeline of novel biologics, the increasing focus on personalized medicine approaches, and the integration of advanced technologies like AI and gene therapy into drug development. Strategic opportunities lie in targeting underserved patient populations, expanding into emerging markets, and forging collaborations to leverage synergistic expertise. The market is expected to witness a continued shift towards disease-modifying treatments offering long-term benefits, thereby enhancing patient quality of life and reducing the overall burden of arthritic diseases.
Arthritic Therapeutic Segmentation
-
1. Application
- 1.1. Rheumatoid Arthritis
- 1.2. Osteoarthritis
- 1.3. Psoriatic Arthritis
- 1.4. Ankylosing Spondylitis
- 1.5. Fibromyalgia
- 1.6. Others
-
2. Type
- 2.1. Biologics
- 2.2. Non-biologics
Arthritic Therapeutic Segmentation By Geography
-
1. North America
- 1.1. United States
- 1.2. Canada
- 1.3. Mexico
-
2. South America
- 2.1. Brazil
- 2.2. Argentina
- 2.3. Rest of South America
-
3. Europe
- 3.1. United Kingdom
- 3.2. Germany
- 3.3. France
- 3.4. Italy
- 3.5. Spain
- 3.6. Russia
- 3.7. Benelux
- 3.8. Nordics
- 3.9. Rest of Europe
-
4. Middle East & Africa
- 4.1. Turkey
- 4.2. Israel
- 4.3. GCC
- 4.4. North Africa
- 4.5. South Africa
- 4.6. Rest of Middle East & Africa
-
5. Asia Pacific
- 5.1. China
- 5.2. India
- 5.3. Japan
- 5.4. South Korea
- 5.5. ASEAN
- 5.6. Oceania
- 5.7. Rest of Asia Pacific
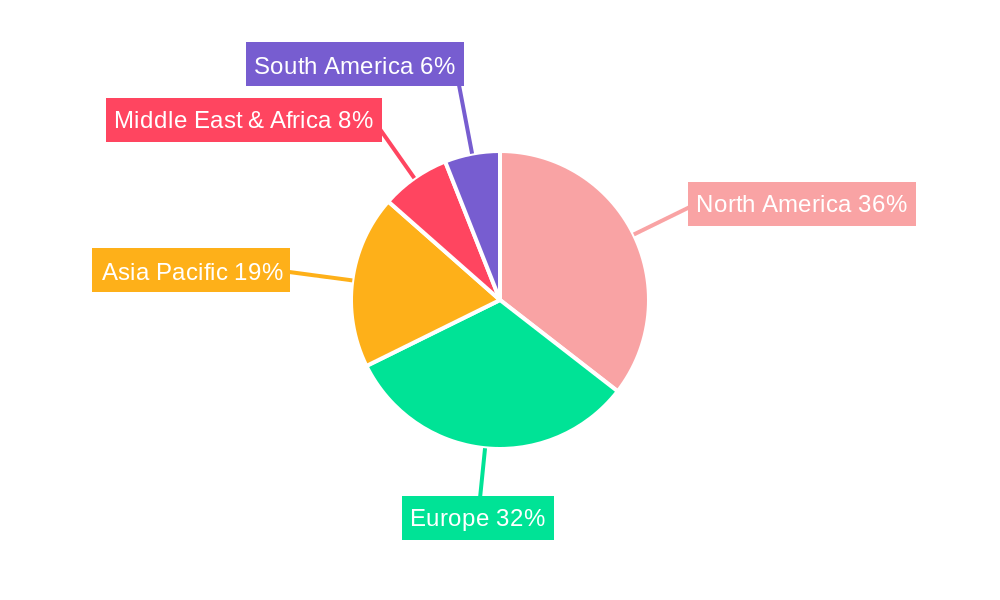
Arthritic Therapeutic Regional Market Share
Geographic Coverage of Arthritic Therapeutic
Arthritic Therapeutic REPORT HIGHLIGHTS
| Aspects | Details |
|---|---|
| Study Period | 2020-2034 |
| Base Year | 2025 |
| Estimated Year | 2026 |
| Forecast Period | 2026-2034 |
| Historical Period | 2020-2025 |
| Growth Rate | CAGR of 7.14% from 2020-2034 |
| Segmentation |
|
Table of Contents
- 1. Introduction
- 1.1. Research Scope
- 1.2. Market Segmentation
- 1.3. Research Methodology
- 1.4. Definitions and Assumptions
- 2. Executive Summary
- 2.1. Introduction
- 3. Market Dynamics
- 3.1. Introduction
- 3.2. Market Drivers
- 3.3. Market Restrains
- 3.4. Market Trends
- 4. Market Factor Analysis
- 4.1. Porters Five Forces
- 4.2. Supply/Value Chain
- 4.3. PESTEL analysis
- 4.4. Market Entropy
- 4.5. Patent/Trademark Analysis
- 5. Global Arthritic Therapeutic Analysis, Insights and Forecast, 2020-2032
- 5.1. Market Analysis, Insights and Forecast - by Application
- 5.1.1. Rheumatoid Arthritis
- 5.1.2. Osteoarthritis
- 5.1.3. Psoriatic Arthritis
- 5.1.4. Ankylosing Spondylitis
- 5.1.5. Fibromyalgia
- 5.1.6. Others
- 5.2. Market Analysis, Insights and Forecast - by Type
- 5.2.1. Biologics
- 5.2.2. Non-biologics
- 5.3. Market Analysis, Insights and Forecast - by Region
- 5.3.1. North America
- 5.3.2. South America
- 5.3.3. Europe
- 5.3.4. Middle East & Africa
- 5.3.5. Asia Pacific
- 5.1. Market Analysis, Insights and Forecast - by Application
- 6. North America Arthritic Therapeutic Analysis, Insights and Forecast, 2020-2032
- 6.1. Market Analysis, Insights and Forecast - by Application
- 6.1.1. Rheumatoid Arthritis
- 6.1.2. Osteoarthritis
- 6.1.3. Psoriatic Arthritis
- 6.1.4. Ankylosing Spondylitis
- 6.1.5. Fibromyalgia
- 6.1.6. Others
- 6.2. Market Analysis, Insights and Forecast - by Type
- 6.2.1. Biologics
- 6.2.2. Non-biologics
- 6.1. Market Analysis, Insights and Forecast - by Application
- 7. South America Arthritic Therapeutic Analysis, Insights and Forecast, 2020-2032
- 7.1. Market Analysis, Insights and Forecast - by Application
- 7.1.1. Rheumatoid Arthritis
- 7.1.2. Osteoarthritis
- 7.1.3. Psoriatic Arthritis
- 7.1.4. Ankylosing Spondylitis
- 7.1.5. Fibromyalgia
- 7.1.6. Others
- 7.2. Market Analysis, Insights and Forecast - by Type
- 7.2.1. Biologics
- 7.2.2. Non-biologics
- 7.1. Market Analysis, Insights and Forecast - by Application
- 8. Europe Arthritic Therapeutic Analysis, Insights and Forecast, 2020-2032
- 8.1. Market Analysis, Insights and Forecast - by Application
- 8.1.1. Rheumatoid Arthritis
- 8.1.2. Osteoarthritis
- 8.1.3. Psoriatic Arthritis
- 8.1.4. Ankylosing Spondylitis
- 8.1.5. Fibromyalgia
- 8.1.6. Others
- 8.2. Market Analysis, Insights and Forecast - by Type
- 8.2.1. Biologics
- 8.2.2. Non-biologics
- 8.1. Market Analysis, Insights and Forecast - by Application
- 9. Middle East & Africa Arthritic Therapeutic Analysis, Insights and Forecast, 2020-2032
- 9.1. Market Analysis, Insights and Forecast - by Application
- 9.1.1. Rheumatoid Arthritis
- 9.1.2. Osteoarthritis
- 9.1.3. Psoriatic Arthritis
- 9.1.4. Ankylosing Spondylitis
- 9.1.5. Fibromyalgia
- 9.1.6. Others
- 9.2. Market Analysis, Insights and Forecast - by Type
- 9.2.1. Biologics
- 9.2.2. Non-biologics
- 9.1. Market Analysis, Insights and Forecast - by Application
- 10. Asia Pacific Arthritic Therapeutic Analysis, Insights and Forecast, 2020-2032
- 10.1. Market Analysis, Insights and Forecast - by Application
- 10.1.1. Rheumatoid Arthritis
- 10.1.2. Osteoarthritis
- 10.1.3. Psoriatic Arthritis
- 10.1.4. Ankylosing Spondylitis
- 10.1.5. Fibromyalgia
- 10.1.6. Others
- 10.2. Market Analysis, Insights and Forecast - by Type
- 10.2.1. Biologics
- 10.2.2. Non-biologics
- 10.1. Market Analysis, Insights and Forecast - by Application
- 11. Competitive Analysis
- 11.1. Global Market Share Analysis 2025
- 11.2. Company Profiles
- 11.2.1 AbbVie
- 11.2.1.1. Overview
- 11.2.1.2. Products
- 11.2.1.3. SWOT Analysis
- 11.2.1.4. Recent Developments
- 11.2.1.5. Financials (Based on Availability)
- 11.2.2 Merck.
- 11.2.2.1. Overview
- 11.2.2.2. Products
- 11.2.2.3. SWOT Analysis
- 11.2.2.4. Recent Developments
- 11.2.2.5. Financials (Based on Availability)
- 11.2.3 Novartis
- 11.2.3.1. Overview
- 11.2.3.2. Products
- 11.2.3.3. SWOT Analysis
- 11.2.3.4. Recent Developments
- 11.2.3.5. Financials (Based on Availability)
- 11.2.4 AstraZeneca
- 11.2.4.1. Overview
- 11.2.4.2. Products
- 11.2.4.3. SWOT Analysis
- 11.2.4.4. Recent Developments
- 11.2.4.5. Financials (Based on Availability)
- 11.2.5 Abbott
- 11.2.5.1. Overview
- 11.2.5.2. Products
- 11.2.5.3. SWOT Analysis
- 11.2.5.4. Recent Developments
- 11.2.5.5. Financials (Based on Availability)
- 11.2.6 Amgen
- 11.2.6.1. Overview
- 11.2.6.2. Products
- 11.2.6.3. SWOT Analysis
- 11.2.6.4. Recent Developments
- 11.2.6.5. Financials (Based on Availability)
- 11.2.7 Baxter
- 11.2.7.1. Overview
- 11.2.7.2. Products
- 11.2.7.3. SWOT Analysis
- 11.2.7.4. Recent Developments
- 11.2.7.5. Financials (Based on Availability)
- 11.2.8 Bristol-Myers Squibb
- 11.2.8.1. Overview
- 11.2.8.2. Products
- 11.2.8.3. SWOT Analysis
- 11.2.8.4. Recent Developments
- 11.2.8.5. Financials (Based on Availability)
- 11.2.9 F. Hoffmann-La Roche
- 11.2.9.1. Overview
- 11.2.9.2. Products
- 11.2.9.3. SWOT Analysis
- 11.2.9.4. Recent Developments
- 11.2.9.5. Financials (Based on Availability)
- 11.2.10 Eli Lilly
- 11.2.10.1. Overview
- 11.2.10.2. Products
- 11.2.10.3. SWOT Analysis
- 11.2.10.4. Recent Developments
- 11.2.10.5. Financials (Based on Availability)
- 11.2.11 Johnson & Johnson
- 11.2.11.1. Overview
- 11.2.11.2. Products
- 11.2.11.3. SWOT Analysis
- 11.2.11.4. Recent Developments
- 11.2.11.5. Financials (Based on Availability)
- 11.2.12 GlaxoSmithKline
- 11.2.12.1. Overview
- 11.2.12.2. Products
- 11.2.12.3. SWOT Analysis
- 11.2.12.4. Recent Developments
- 11.2.12.5. Financials (Based on Availability)
- 11.2.13 Celgene
- 11.2.13.1. Overview
- 11.2.13.2. Products
- 11.2.13.3. SWOT Analysis
- 11.2.13.4. Recent Developments
- 11.2.13.5. Financials (Based on Availability)
- 11.2.14 Pfizer
- 11.2.14.1. Overview
- 11.2.14.2. Products
- 11.2.14.3. SWOT Analysis
- 11.2.14.4. Recent Developments
- 11.2.14.5. Financials (Based on Availability)
- 11.2.1 AbbVie
List of Figures
- Figure 1: Global Arthritic Therapeutic Revenue Breakdown (billion, %) by Region 2025 & 2033
- Figure 2: North America Arthritic Therapeutic Revenue (billion), by Application 2025 & 2033
- Figure 3: North America Arthritic Therapeutic Revenue Share (%), by Application 2025 & 2033
- Figure 4: North America Arthritic Therapeutic Revenue (billion), by Type 2025 & 2033
- Figure 5: North America Arthritic Therapeutic Revenue Share (%), by Type 2025 & 2033
- Figure 6: North America Arthritic Therapeutic Revenue (billion), by Country 2025 & 2033
- Figure 7: North America Arthritic Therapeutic Revenue Share (%), by Country 2025 & 2033
- Figure 8: South America Arthritic Therapeutic Revenue (billion), by Application 2025 & 2033
- Figure 9: South America Arthritic Therapeutic Revenue Share (%), by Application 2025 & 2033
- Figure 10: South America Arthritic Therapeutic Revenue (billion), by Type 2025 & 2033
- Figure 11: South America Arthritic Therapeutic Revenue Share (%), by Type 2025 & 2033
- Figure 12: South America Arthritic Therapeutic Revenue (billion), by Country 2025 & 2033
- Figure 13: South America Arthritic Therapeutic Revenue Share (%), by Country 2025 & 2033
- Figure 14: Europe Arthritic Therapeutic Revenue (billion), by Application 2025 & 2033
- Figure 15: Europe Arthritic Therapeutic Revenue Share (%), by Application 2025 & 2033
- Figure 16: Europe Arthritic Therapeutic Revenue (billion), by Type 2025 & 2033
- Figure 17: Europe Arthritic Therapeutic Revenue Share (%), by Type 2025 & 2033
- Figure 18: Europe Arthritic Therapeutic Revenue (billion), by Country 2025 & 2033
- Figure 19: Europe Arthritic Therapeutic Revenue Share (%), by Country 2025 & 2033
- Figure 20: Middle East & Africa Arthritic Therapeutic Revenue (billion), by Application 2025 & 2033
- Figure 21: Middle East & Africa Arthritic Therapeutic Revenue Share (%), by Application 2025 & 2033
- Figure 22: Middle East & Africa Arthritic Therapeutic Revenue (billion), by Type 2025 & 2033
- Figure 23: Middle East & Africa Arthritic Therapeutic Revenue Share (%), by Type 2025 & 2033
- Figure 24: Middle East & Africa Arthritic Therapeutic Revenue (billion), by Country 2025 & 2033
- Figure 25: Middle East & Africa Arthritic Therapeutic Revenue Share (%), by Country 2025 & 2033
- Figure 26: Asia Pacific Arthritic Therapeutic Revenue (billion), by Application 2025 & 2033
- Figure 27: Asia Pacific Arthritic Therapeutic Revenue Share (%), by Application 2025 & 2033
- Figure 28: Asia Pacific Arthritic Therapeutic Revenue (billion), by Type 2025 & 2033
- Figure 29: Asia Pacific Arthritic Therapeutic Revenue Share (%), by Type 2025 & 2033
- Figure 30: Asia Pacific Arthritic Therapeutic Revenue (billion), by Country 2025 & 2033
- Figure 31: Asia Pacific Arthritic Therapeutic Revenue Share (%), by Country 2025 & 2033
List of Tables
- Table 1: Global Arthritic Therapeutic Revenue billion Forecast, by Application 2020 & 2033
- Table 2: Global Arthritic Therapeutic Revenue billion Forecast, by Type 2020 & 2033
- Table 3: Global Arthritic Therapeutic Revenue billion Forecast, by Region 2020 & 2033
- Table 4: Global Arthritic Therapeutic Revenue billion Forecast, by Application 2020 & 2033
- Table 5: Global Arthritic Therapeutic Revenue billion Forecast, by Type 2020 & 2033
- Table 6: Global Arthritic Therapeutic Revenue billion Forecast, by Country 2020 & 2033
- Table 7: United States Arthritic Therapeutic Revenue (billion) Forecast, by Application 2020 & 2033
- Table 8: Canada Arthritic Therapeutic Revenue (billion) Forecast, by Application 2020 & 2033
- Table 9: Mexico Arthritic Therapeutic Revenue (billion) Forecast, by Application 2020 & 2033
- Table 10: Global Arthritic Therapeutic Revenue billion Forecast, by Application 2020 & 2033
- Table 11: Global Arthritic Therapeutic Revenue billion Forecast, by Type 2020 & 2033
- Table 12: Global Arthritic Therapeutic Revenue billion Forecast, by Country 2020 & 2033
- Table 13: Brazil Arthritic Therapeutic Revenue (billion) Forecast, by Application 2020 & 2033
- Table 14: Argentina Arthritic Therapeutic Revenue (billion) Forecast, by Application 2020 & 2033
- Table 15: Rest of South America Arthritic Therapeutic Revenue (billion) Forecast, by Application 2020 & 2033
- Table 16: Global Arthritic Therapeutic Revenue billion Forecast, by Application 2020 & 2033
- Table 17: Global Arthritic Therapeutic Revenue billion Forecast, by Type 2020 & 2033
- Table 18: Global Arthritic Therapeutic Revenue billion Forecast, by Country 2020 & 2033
- Table 19: United Kingdom Arthritic Therapeutic Revenue (billion) Forecast, by Application 2020 & 2033
- Table 20: Germany Arthritic Therapeutic Revenue (billion) Forecast, by Application 2020 & 2033
- Table 21: France Arthritic Therapeutic Revenue (billion) Forecast, by Application 2020 & 2033
- Table 22: Italy Arthritic Therapeutic Revenue (billion) Forecast, by Application 2020 & 2033
- Table 23: Spain Arthritic Therapeutic Revenue (billion) Forecast, by Application 2020 & 2033
- Table 24: Russia Arthritic Therapeutic Revenue (billion) Forecast, by Application 2020 & 2033
- Table 25: Benelux Arthritic Therapeutic Revenue (billion) Forecast, by Application 2020 & 2033
- Table 26: Nordics Arthritic Therapeutic Revenue (billion) Forecast, by Application 2020 & 2033
- Table 27: Rest of Europe Arthritic Therapeutic Revenue (billion) Forecast, by Application 2020 & 2033
- Table 28: Global Arthritic Therapeutic Revenue billion Forecast, by Application 2020 & 2033
- Table 29: Global Arthritic Therapeutic Revenue billion Forecast, by Type 2020 & 2033
- Table 30: Global Arthritic Therapeutic Revenue billion Forecast, by Country 2020 & 2033
- Table 31: Turkey Arthritic Therapeutic Revenue (billion) Forecast, by Application 2020 & 2033
- Table 32: Israel Arthritic Therapeutic Revenue (billion) Forecast, by Application 2020 & 2033
- Table 33: GCC Arthritic Therapeutic Revenue (billion) Forecast, by Application 2020 & 2033
- Table 34: North Africa Arthritic Therapeutic Revenue (billion) Forecast, by Application 2020 & 2033
- Table 35: South Africa Arthritic Therapeutic Revenue (billion) Forecast, by Application 2020 & 2033
- Table 36: Rest of Middle East & Africa Arthritic Therapeutic Revenue (billion) Forecast, by Application 2020 & 2033
- Table 37: Global Arthritic Therapeutic Revenue billion Forecast, by Application 2020 & 2033
- Table 38: Global Arthritic Therapeutic Revenue billion Forecast, by Type 2020 & 2033
- Table 39: Global Arthritic Therapeutic Revenue billion Forecast, by Country 2020 & 2033
- Table 40: China Arthritic Therapeutic Revenue (billion) Forecast, by Application 2020 & 2033
- Table 41: India Arthritic Therapeutic Revenue (billion) Forecast, by Application 2020 & 2033
- Table 42: Japan Arthritic Therapeutic Revenue (billion) Forecast, by Application 2020 & 2033
- Table 43: South Korea Arthritic Therapeutic Revenue (billion) Forecast, by Application 2020 & 2033
- Table 44: ASEAN Arthritic Therapeutic Revenue (billion) Forecast, by Application 2020 & 2033
- Table 45: Oceania Arthritic Therapeutic Revenue (billion) Forecast, by Application 2020 & 2033
- Table 46: Rest of Asia Pacific Arthritic Therapeutic Revenue (billion) Forecast, by Application 2020 & 2033
Frequently Asked Questions
1. What is the projected Compound Annual Growth Rate (CAGR) of the Arthritic Therapeutic?
The projected CAGR is approximately 7.14%.
2. Which companies are prominent players in the Arthritic Therapeutic?
Key companies in the market include AbbVie, Merck., Novartis, AstraZeneca, Abbott, Amgen, Baxter, Bristol-Myers Squibb, F. Hoffmann-La Roche, Eli Lilly, Johnson & Johnson, GlaxoSmithKline, Celgene, Pfizer.
3. What are the main segments of the Arthritic Therapeutic?
The market segments include Application, Type.
4. Can you provide details about the market size?
The market size is estimated to be USD 3.5 billion as of 2022.
5. What are some drivers contributing to market growth?
N/A
6. What are the notable trends driving market growth?
N/A
7. Are there any restraints impacting market growth?
N/A
8. Can you provide examples of recent developments in the market?
N/A
9. What pricing options are available for accessing the report?
Pricing options include single-user, multi-user, and enterprise licenses priced at USD 2900.00, USD 4350.00, and USD 5800.00 respectively.
10. Is the market size provided in terms of value or volume?
The market size is provided in terms of value, measured in billion.
11. Are there any specific market keywords associated with the report?
Yes, the market keyword associated with the report is "Arthritic Therapeutic," which aids in identifying and referencing the specific market segment covered.
12. How do I determine which pricing option suits my needs best?
The pricing options vary based on user requirements and access needs. Individual users may opt for single-user licenses, while businesses requiring broader access may choose multi-user or enterprise licenses for cost-effective access to the report.
13. Are there any additional resources or data provided in the Arthritic Therapeutic report?
While the report offers comprehensive insights, it's advisable to review the specific contents or supplementary materials provided to ascertain if additional resources or data are available.
14. How can I stay updated on further developments or reports in the Arthritic Therapeutic?
To stay informed about further developments, trends, and reports in the Arthritic Therapeutic, consider subscribing to industry newsletters, following relevant companies and organizations, or regularly checking reputable industry news sources and publications.
Methodology
Step 1 - Identification of Relevant Samples Size from Population Database


Step 2 - Approaches for Defining Global Market Size (Value, Volume* & Price*)

Note*: In applicable scenarios
Step 3 - Data Sources
Primary Research
- Web Analytics
- Survey Reports
- Research Institute
- Latest Research Reports
- Opinion Leaders
Secondary Research
- Annual Reports
- White Paper
- Latest Press Release
- Industry Association
- Paid Database
- Investor Presentations

Step 4 - Data Triangulation
Involves using different sources of information in order to increase the validity of a study
These sources are likely to be stakeholders in a program - participants, other researchers, program staff, other community members, and so on.
Then we put all data in single framework & apply various statistical tools to find out the dynamic on the market.
During the analysis stage, feedback from the stakeholder groups would be compared to determine areas of agreement as well as areas of divergence