
Key Insights
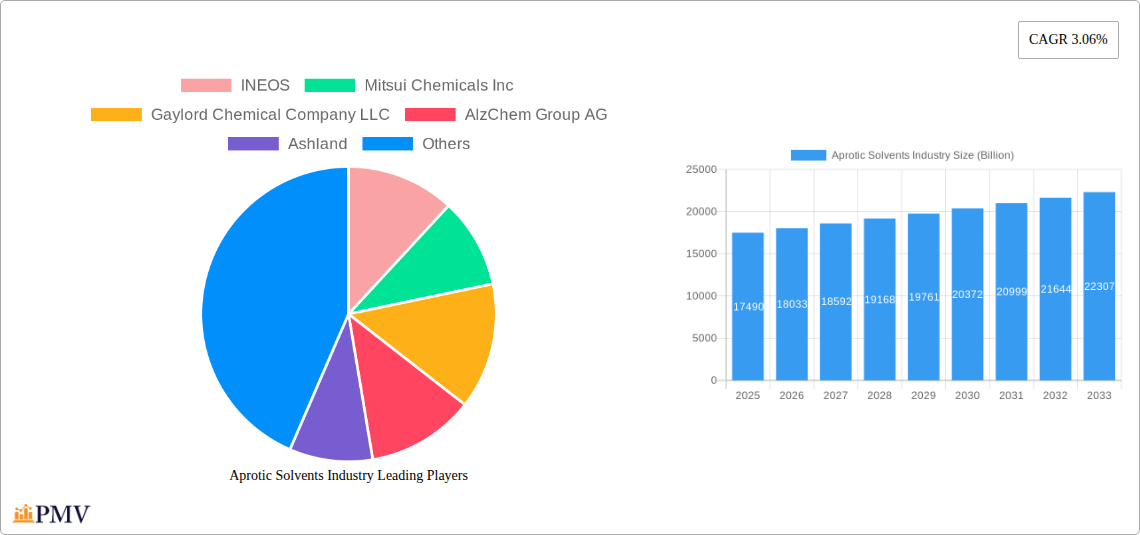
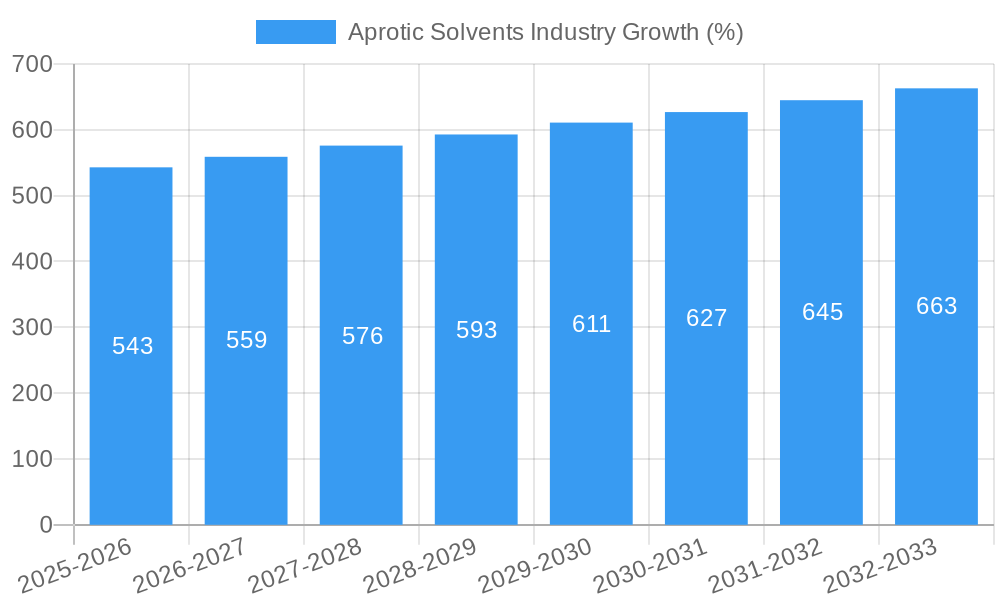
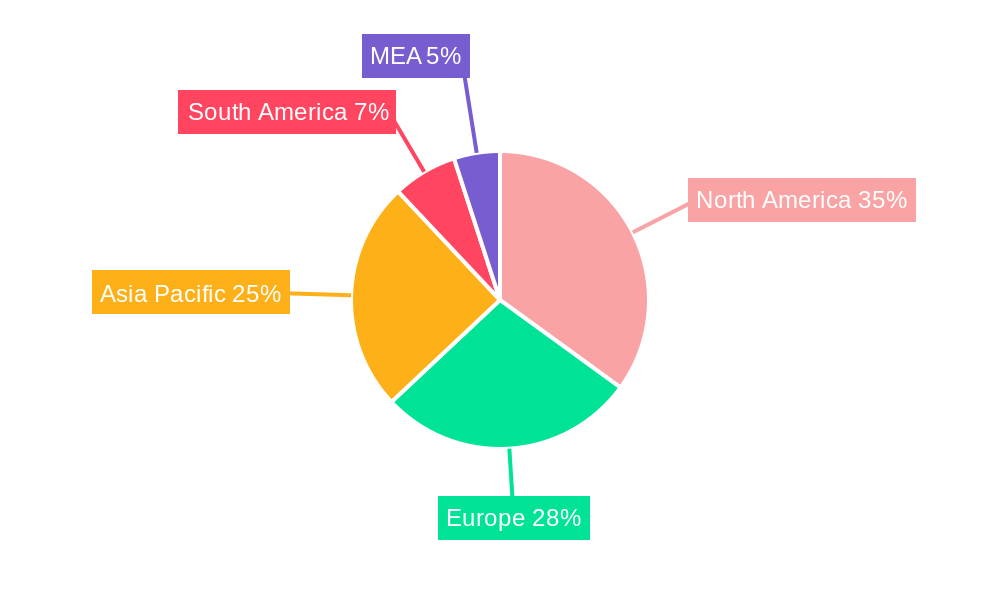
The aprotic solvents market, valued at $17.49 billion in 2025, is projected to experience steady growth, driven by increasing demand across diverse sectors. A compound annual growth rate (CAGR) of 3.06% from 2025 to 2033 indicates a promising outlook. Key drivers include the expanding oil and gas industry, the burgeoning pharmaceutical sector's need for efficient solvents, and the rising adoption of aprotic solvents in advanced materials manufacturing, particularly in electronics and plastics. The N-Methyl-2-Pyrrolidone (NMP) segment is expected to dominate due to its high performance and versatility, while applications in paints and coatings, and adhesives are also significant contributors. Growth is likely to be geographically diverse, with North America and Asia-Pacific representing key regional markets, reflecting robust industrial activity and manufacturing capabilities in these areas. However, potential restraints include environmental regulations on certain solvent types and the emergence of greener alternatives. The competitive landscape is marked by established players such as INEOS, Mitsui Chemicals, and BASF, who continually innovate to meet evolving industry needs. This market's sustained growth reflects a strong correlation with overall industrial expansion and technological advancements.
The forecast period (2025-2033) anticipates a continued, albeit moderate, growth trajectory for aprotic solvents. The steady CAGR indicates a consistent market expansion, but the pace might be influenced by fluctuating raw material prices, evolving environmental regulations, and the development of sustainable alternatives. Technological advancements in solvent design and recycling practices will influence market dynamics. Increased focus on eco-friendly solvents may result in a shift towards less harmful alternatives, leading to adjustments in the market share of existing solvents like toluene and benzene. Successful market players will be those who strategically adapt to these challenges, investing in research and development to offer more sustainable and efficient solutions. Regional differences in regulations and economic conditions will also play a significant role in shaping future growth patterns.
Aprotic Solvents Industry Market Report: 2019-2033
This comprehensive report provides an in-depth analysis of the Aprotic Solvents market, projecting a market value exceeding $XX Billion by 2033. The study covers the period 2019-2033, with 2025 serving as the base and estimated year. This report is essential for industry stakeholders, investors, and researchers seeking to understand the market dynamics and future growth potential of aprotic solvents. Key players like INEOS, Mitsui Chemicals Inc, Gaylord Chemical Company LLC, AlzChem Group AG, Ashland, BASF SE, Dow, and Eastman Chemical Company are analyzed extensively.
Aprotic Solvents Industry Market Structure & Competitive Dynamics
The aprotic solvents market exhibits a moderately concentrated structure, with a few major players holding significant market share. INEOS, BASF SE, and Dow collectively account for approximately XX% of the global market in 2025, showcasing their dominance. However, the market also features several regional and specialized players, creating a competitive landscape.
Innovation within the industry focuses on developing more sustainable and efficient solvent production methods, driven by stringent environmental regulations. The regulatory landscape varies across regions, influencing production costs and market access. Substitutes, such as ionic liquids and supercritical fluids, present challenges, though their market penetration remains relatively low in 2025 (approximately XX%).
End-user trends are shifting towards environmentally friendly solvents, particularly within the paints and coatings, and pharmaceutical sectors. M&A activity has been moderate in recent years, with deal values totaling approximately $XX Billion between 2019 and 2024. These transactions largely focused on expanding product portfolios and geographical reach.
- Market Concentration: High (XX% market share by top 3 players in 2025)
- Innovation: Focus on sustainability and efficiency
- Regulatory Landscape: Regionally diverse, impacting production costs
- Substitutes: Ionic liquids, supercritical fluids (low penetration – XX% in 2025)
- End-User Trends: Growing demand for eco-friendly solvents
- M&A Activity: Moderate, $XX Billion in deal value (2019-2024)
Aprotic Solvents Industry Industry Trends & Insights
The aprotic solvents market is projected to experience significant growth, with a CAGR of XX% during the forecast period (2025-2033). This growth is primarily fueled by increasing demand from various end-use industries, particularly in the burgeoning electronics and pharmaceutical sectors. Technological advancements, such as the development of more efficient synthesis methods and novel solvent formulations, are further driving market expansion.
Consumer preferences are increasingly aligned with sustainable and environmentally friendly products, creating opportunities for manufacturers offering bio-based or biodegradable aprotic solvents. The competitive dynamics are shaped by pricing pressures, innovation, and regulatory compliance. Market penetration of novel aprotic solvents remains relatively low (approximately XX% in 2025), indicating substantial potential for future growth.
Dominant Markets & Segments in Aprotic Solvents Industry
The Asia-Pacific region is expected to dominate the aprotic solvents market throughout the forecast period, driven by robust economic growth and expanding industrial sectors, especially in China and India. Within the solvent types, N-Methyl-2-Pyrrolidone (NMP) holds the largest market share in 2025 due to its versatile applications in various industries. The plastics and pharmaceutical industries are the leading end-use segments, contributing to a significant portion of overall market demand.
- Leading Region: Asia-Pacific (Driven by economic growth in China and India)
- Leading Solvent Type: N-Methyl-2-Pyrrolidone (NMP) (versatile applications)
- Leading Application: Plastics and Pharmaceuticals (high volume demand)
- Key Drivers (Asia-Pacific):
- Rapid industrialization
- Growing infrastructure development
- Favorable government policies
Aprotic Solvents Industry Product Innovations
Recent innovations focus on developing high-performance aprotic solvents with enhanced properties like improved solvency, reduced toxicity, and enhanced biodegradability. New applications are emerging in areas like battery manufacturing and advanced materials processing. These innovations provide competitive advantages by improving efficiency, reducing environmental impact, and meeting the evolving needs of various industries.
Report Segmentation & Scope
This report segments the aprotic solvents market by type (N-Methyl-2-Pyrrolidone (NMP), Toluene, Benzene, Acetone, Others) and application (Oil and Gas, Plastics, Pharmaceutical, Electronic Equipments, Paints and Coatings, Adhesives, Others). Each segment's growth trajectory, market size, and competitive dynamics are analyzed in detail. Growth projections are provided for each segment throughout the forecast period (2025-2033), offering a granular understanding of market opportunities.
Key Drivers of Aprotic Solvents Industry Growth
Several factors are driving the growth of the aprotic solvents industry. These include increasing demand from diverse end-use sectors (plastics, pharmaceuticals), advancements in solvent technology leading to improved efficiency and sustainability, and favorable government policies promoting industrial growth in key regions. Stringent environmental regulations are also pushing the development of eco-friendly solvents.
Challenges in the Aprotic Solvents Industry Sector
The aprotic solvents industry faces challenges such as stringent environmental regulations leading to higher production costs, volatile raw material prices, and intense competition among established players. Supply chain disruptions can also impact production and availability. These factors can influence profitability and market growth.
Leading Players in the Aprotic Solvents Industry Market
- INEOS
- Mitsui Chemicals Inc
- Gaylord Chemical Company LLC
- AlzChem Group AG
- Ashland
- BASF SE
- Dow
- Eastman Chemical Company
Key Developments in Aprotic Solvents Industry Sector
- 2022-Q4: BASF SE launched a new, sustainable NMP production process.
- 2023-Q1: INEOS announced a strategic partnership to expand its aprotic solvent distribution network.
- 2023-Q3: Dow introduced a new line of biodegradable aprotic solvents. (Further developments will be added as they occur).
Strategic Aprotic Solvents Industry Market Outlook
The aprotic solvents market presents significant opportunities for growth driven by the expanding demand from key end-use industries and advancements in sustainable solvent technologies. Strategic partnerships, investments in R&D, and expansion into emerging markets will be crucial for industry players to capitalize on this growth potential. The focus on sustainability and regulatory compliance will continue to shape the market landscape in the coming years.
Aprotic Solvents Industry Segmentation
-
1. Type
- 1.1. N-Methyl-2-Pyrrolidone (NMP)
- 1.2. Toluene
- 1.3. Benzene
- 1.4. Acetone
- 1.5. Others
-
2. Application
- 2.1. Oil and Gas
- 2.2. Plastics
- 2.3. Pharmaceutical
- 2.4. Electronic Equipments
- 2.5. Paints and Coatings
- 2.6. Adhesives
- 2.7. Others
Aprotic Solvents Industry Segmentation By Geography
-
1. Asia Pacific
- 1.1. China
- 1.2. India
- 1.3. Japan
- 1.4. South Korea
- 1.5. Rest of Asia Pacific
-
2. North America
- 2.1. United States
- 2.2. Canada
- 2.3. Mexico
-
3. Europe
- 3.1. Germany
- 3.2. United Kingdom
- 3.3. France
- 3.4. Italy
- 3.5. Rest of Europe
-
4. South America
- 4.1. Brazil
- 4.2. Argentina
- 4.3. Rest of South America
-
5. Middle East and Africa
- 5.1. Saudi Arabia
- 5.2. South Africa
- 5.3. Rest of Middle East and Africa
Aprotic Solvents Industry REPORT HIGHLIGHTS
| Aspects | Details |
|---|---|
| Study Period | 2019-2033 |
| Base Year | 2024 |
| Estimated Year | 2025 |
| Forecast Period | 2025-2033 |
| Historical Period | 2019-2024 |
| Growth Rate | CAGR of 3.06% from 2019-2033 |
| Segmentation |
|
Table of Contents
- 1. Introduction
- 1.1. Research Scope
- 1.2. Market Segmentation
- 1.3. Research Methodology
- 1.4. Definitions and Assumptions
- 2. Executive Summary
- 2.1. Introduction
- 3. Market Dynamics
- 3.1. Introduction
- 3.2. Market Drivers
- 3.2.1. ; Growing Demand from Oil and Gas Industry; Increasing Consumption in Pharmaceutical Sector
- 3.3. Market Restrains
- 3.3.1. ; Non-Toxic Substitutes; Envrionmental Concerns; Unfavorable Conditions Arising Due to COVID-19 Outbreak
- 3.4. Market Trends
- 3.4.1. Application in the Oil and Gas Sector to Dominate the Market
- 4. Market Factor Analysis
- 4.1. Porters Five Forces
- 4.2. Supply/Value Chain
- 4.3. PESTEL analysis
- 4.4. Market Entropy
- 4.5. Patent/Trademark Analysis
- 5. Global Aprotic Solvents Industry Analysis, Insights and Forecast, 2019-2031
- 5.1. Market Analysis, Insights and Forecast - by Type
- 5.1.1. N-Methyl-2-Pyrrolidone (NMP)
- 5.1.2. Toluene
- 5.1.3. Benzene
- 5.1.4. Acetone
- 5.1.5. Others
- 5.2. Market Analysis, Insights and Forecast - by Application
- 5.2.1. Oil and Gas
- 5.2.2. Plastics
- 5.2.3. Pharmaceutical
- 5.2.4. Electronic Equipments
- 5.2.5. Paints and Coatings
- 5.2.6. Adhesives
- 5.2.7. Others
- 5.3. Market Analysis, Insights and Forecast - by Region
- 5.3.1. Asia Pacific
- 5.3.2. North America
- 5.3.3. Europe
- 5.3.4. South America
- 5.3.5. Middle East and Africa
- 5.1. Market Analysis, Insights and Forecast - by Type
- 6. Asia Pacific Aprotic Solvents Industry Analysis, Insights and Forecast, 2019-2031
- 6.1. Market Analysis, Insights and Forecast - by Type
- 6.1.1. N-Methyl-2-Pyrrolidone (NMP)
- 6.1.2. Toluene
- 6.1.3. Benzene
- 6.1.4. Acetone
- 6.1.5. Others
- 6.2. Market Analysis, Insights and Forecast - by Application
- 6.2.1. Oil and Gas
- 6.2.2. Plastics
- 6.2.3. Pharmaceutical
- 6.2.4. Electronic Equipments
- 6.2.5. Paints and Coatings
- 6.2.6. Adhesives
- 6.2.7. Others
- 6.1. Market Analysis, Insights and Forecast - by Type
- 7. North America Aprotic Solvents Industry Analysis, Insights and Forecast, 2019-2031
- 7.1. Market Analysis, Insights and Forecast - by Type
- 7.1.1. N-Methyl-2-Pyrrolidone (NMP)
- 7.1.2. Toluene
- 7.1.3. Benzene
- 7.1.4. Acetone
- 7.1.5. Others
- 7.2. Market Analysis, Insights and Forecast - by Application
- 7.2.1. Oil and Gas
- 7.2.2. Plastics
- 7.2.3. Pharmaceutical
- 7.2.4. Electronic Equipments
- 7.2.5. Paints and Coatings
- 7.2.6. Adhesives
- 7.2.7. Others
- 7.1. Market Analysis, Insights and Forecast - by Type
- 8. Europe Aprotic Solvents Industry Analysis, Insights and Forecast, 2019-2031
- 8.1. Market Analysis, Insights and Forecast - by Type
- 8.1.1. N-Methyl-2-Pyrrolidone (NMP)
- 8.1.2. Toluene
- 8.1.3. Benzene
- 8.1.4. Acetone
- 8.1.5. Others
- 8.2. Market Analysis, Insights and Forecast - by Application
- 8.2.1. Oil and Gas
- 8.2.2. Plastics
- 8.2.3. Pharmaceutical
- 8.2.4. Electronic Equipments
- 8.2.5. Paints and Coatings
- 8.2.6. Adhesives
- 8.2.7. Others
- 8.1. Market Analysis, Insights and Forecast - by Type
- 9. South America Aprotic Solvents Industry Analysis, Insights and Forecast, 2019-2031
- 9.1. Market Analysis, Insights and Forecast - by Type
- 9.1.1. N-Methyl-2-Pyrrolidone (NMP)
- 9.1.2. Toluene
- 9.1.3. Benzene
- 9.1.4. Acetone
- 9.1.5. Others
- 9.2. Market Analysis, Insights and Forecast - by Application
- 9.2.1. Oil and Gas
- 9.2.2. Plastics
- 9.2.3. Pharmaceutical
- 9.2.4. Electronic Equipments
- 9.2.5. Paints and Coatings
- 9.2.6. Adhesives
- 9.2.7. Others
- 9.1. Market Analysis, Insights and Forecast - by Type
- 10. Middle East and Africa Aprotic Solvents Industry Analysis, Insights and Forecast, 2019-2031
- 10.1. Market Analysis, Insights and Forecast - by Type
- 10.1.1. N-Methyl-2-Pyrrolidone (NMP)
- 10.1.2. Toluene
- 10.1.3. Benzene
- 10.1.4. Acetone
- 10.1.5. Others
- 10.2. Market Analysis, Insights and Forecast - by Application
- 10.2.1. Oil and Gas
- 10.2.2. Plastics
- 10.2.3. Pharmaceutical
- 10.2.4. Electronic Equipments
- 10.2.5. Paints and Coatings
- 10.2.6. Adhesives
- 10.2.7. Others
- 10.1. Market Analysis, Insights and Forecast - by Type
- 11. North America Aprotic Solvents Industry Analysis, Insights and Forecast, 2019-2031
- 11.1. Market Analysis, Insights and Forecast - By Country/Sub-region
- 11.1.1 United States
- 11.1.2 Canada
- 11.1.3 Mexico
- 12. Europe Aprotic Solvents Industry Analysis, Insights and Forecast, 2019-2031
- 12.1. Market Analysis, Insights and Forecast - By Country/Sub-region
- 12.1.1 Germany
- 12.1.2 France
- 12.1.3 Italy
- 12.1.4 United Kingdom
- 12.1.5 Netherlands
- 12.1.6 Rest of Europe
- 13. Asia Pacific Aprotic Solvents Industry Analysis, Insights and Forecast, 2019-2031
- 13.1. Market Analysis, Insights and Forecast - By Country/Sub-region
- 13.1.1 China
- 13.1.2 Japan
- 13.1.3 India
- 13.1.4 South Korea
- 13.1.5 Taiwan
- 13.1.6 Australia
- 13.1.7 Rest of Asia-Pacific
- 14. South America Aprotic Solvents Industry Analysis, Insights and Forecast, 2019-2031
- 14.1. Market Analysis, Insights and Forecast - By Country/Sub-region
- 14.1.1 Brazil
- 14.1.2 Argentina
- 14.1.3 Rest of South America
- 15. MEA Aprotic Solvents Industry Analysis, Insights and Forecast, 2019-2031
- 15.1. Market Analysis, Insights and Forecast - By Country/Sub-region
- 15.1.1 Middle East
- 15.1.2 Africa
- 16. Competitive Analysis
- 16.1. Global Market Share Analysis 2024
- 16.2. Company Profiles
- 16.2.1 INEOS
- 16.2.1.1. Overview
- 16.2.1.2. Products
- 16.2.1.3. SWOT Analysis
- 16.2.1.4. Recent Developments
- 16.2.1.5. Financials (Based on Availability)
- 16.2.2 Mitsui Chemicals Inc
- 16.2.2.1. Overview
- 16.2.2.2. Products
- 16.2.2.3. SWOT Analysis
- 16.2.2.4. Recent Developments
- 16.2.2.5. Financials (Based on Availability)
- 16.2.3 Gaylord Chemical Company LLC
- 16.2.3.1. Overview
- 16.2.3.2. Products
- 16.2.3.3. SWOT Analysis
- 16.2.3.4. Recent Developments
- 16.2.3.5. Financials (Based on Availability)
- 16.2.4 AlzChem Group AG
- 16.2.4.1. Overview
- 16.2.4.2. Products
- 16.2.4.3. SWOT Analysis
- 16.2.4.4. Recent Developments
- 16.2.4.5. Financials (Based on Availability)
- 16.2.5 Ashland
- 16.2.5.1. Overview
- 16.2.5.2. Products
- 16.2.5.3. SWOT Analysis
- 16.2.5.4. Recent Developments
- 16.2.5.5. Financials (Based on Availability)
- 16.2.6 BASF SE
- 16.2.6.1. Overview
- 16.2.6.2. Products
- 16.2.6.3. SWOT Analysis
- 16.2.6.4. Recent Developments
- 16.2.6.5. Financials (Based on Availability)
- 16.2.7 Dow
- 16.2.7.1. Overview
- 16.2.7.2. Products
- 16.2.7.3. SWOT Analysis
- 16.2.7.4. Recent Developments
- 16.2.7.5. Financials (Based on Availability)
- 16.2.8 Eastman Chemical Company
- 16.2.8.1. Overview
- 16.2.8.2. Products
- 16.2.8.3. SWOT Analysis
- 16.2.8.4. Recent Developments
- 16.2.8.5. Financials (Based on Availability)
- 16.2.1 INEOS
List of Figures
- Figure 1: Global Aprotic Solvents Industry Revenue Breakdown (Billion, %) by Region 2024 & 2032
- Figure 2: Global Aprotic Solvents Industry Volume Breakdown (K Tons, %) by Region 2024 & 2032
- Figure 3: North America Aprotic Solvents Industry Revenue (Billion), by Country 2024 & 2032
- Figure 4: North America Aprotic Solvents Industry Volume (K Tons), by Country 2024 & 2032
- Figure 5: North America Aprotic Solvents Industry Revenue Share (%), by Country 2024 & 2032
- Figure 6: North America Aprotic Solvents Industry Volume Share (%), by Country 2024 & 2032
- Figure 7: Europe Aprotic Solvents Industry Revenue (Billion), by Country 2024 & 2032
- Figure 8: Europe Aprotic Solvents Industry Volume (K Tons), by Country 2024 & 2032
- Figure 9: Europe Aprotic Solvents Industry Revenue Share (%), by Country 2024 & 2032
- Figure 10: Europe Aprotic Solvents Industry Volume Share (%), by Country 2024 & 2032
- Figure 11: Asia Pacific Aprotic Solvents Industry Revenue (Billion), by Country 2024 & 2032
- Figure 12: Asia Pacific Aprotic Solvents Industry Volume (K Tons), by Country 2024 & 2032
- Figure 13: Asia Pacific Aprotic Solvents Industry Revenue Share (%), by Country 2024 & 2032
- Figure 14: Asia Pacific Aprotic Solvents Industry Volume Share (%), by Country 2024 & 2032
- Figure 15: South America Aprotic Solvents Industry Revenue (Billion), by Country 2024 & 2032
- Figure 16: South America Aprotic Solvents Industry Volume (K Tons), by Country 2024 & 2032
- Figure 17: South America Aprotic Solvents Industry Revenue Share (%), by Country 2024 & 2032
- Figure 18: South America Aprotic Solvents Industry Volume Share (%), by Country 2024 & 2032
- Figure 19: MEA Aprotic Solvents Industry Revenue (Billion), by Country 2024 & 2032
- Figure 20: MEA Aprotic Solvents Industry Volume (K Tons), by Country 2024 & 2032
- Figure 21: MEA Aprotic Solvents Industry Revenue Share (%), by Country 2024 & 2032
- Figure 22: MEA Aprotic Solvents Industry Volume Share (%), by Country 2024 & 2032
- Figure 23: Asia Pacific Aprotic Solvents Industry Revenue (Billion), by Type 2024 & 2032
- Figure 24: Asia Pacific Aprotic Solvents Industry Volume (K Tons), by Type 2024 & 2032
- Figure 25: Asia Pacific Aprotic Solvents Industry Revenue Share (%), by Type 2024 & 2032
- Figure 26: Asia Pacific Aprotic Solvents Industry Volume Share (%), by Type 2024 & 2032
- Figure 27: Asia Pacific Aprotic Solvents Industry Revenue (Billion), by Application 2024 & 2032
- Figure 28: Asia Pacific Aprotic Solvents Industry Volume (K Tons), by Application 2024 & 2032
- Figure 29: Asia Pacific Aprotic Solvents Industry Revenue Share (%), by Application 2024 & 2032
- Figure 30: Asia Pacific Aprotic Solvents Industry Volume Share (%), by Application 2024 & 2032
- Figure 31: Asia Pacific Aprotic Solvents Industry Revenue (Billion), by Country 2024 & 2032
- Figure 32: Asia Pacific Aprotic Solvents Industry Volume (K Tons), by Country 2024 & 2032
- Figure 33: Asia Pacific Aprotic Solvents Industry Revenue Share (%), by Country 2024 & 2032
- Figure 34: Asia Pacific Aprotic Solvents Industry Volume Share (%), by Country 2024 & 2032
- Figure 35: North America Aprotic Solvents Industry Revenue (Billion), by Type 2024 & 2032
- Figure 36: North America Aprotic Solvents Industry Volume (K Tons), by Type 2024 & 2032
- Figure 37: North America Aprotic Solvents Industry Revenue Share (%), by Type 2024 & 2032
- Figure 38: North America Aprotic Solvents Industry Volume Share (%), by Type 2024 & 2032
- Figure 39: North America Aprotic Solvents Industry Revenue (Billion), by Application 2024 & 2032
- Figure 40: North America Aprotic Solvents Industry Volume (K Tons), by Application 2024 & 2032
- Figure 41: North America Aprotic Solvents Industry Revenue Share (%), by Application 2024 & 2032
- Figure 42: North America Aprotic Solvents Industry Volume Share (%), by Application 2024 & 2032
- Figure 43: North America Aprotic Solvents Industry Revenue (Billion), by Country 2024 & 2032
- Figure 44: North America Aprotic Solvents Industry Volume (K Tons), by Country 2024 & 2032
- Figure 45: North America Aprotic Solvents Industry Revenue Share (%), by Country 2024 & 2032
- Figure 46: North America Aprotic Solvents Industry Volume Share (%), by Country 2024 & 2032
- Figure 47: Europe Aprotic Solvents Industry Revenue (Billion), by Type 2024 & 2032
- Figure 48: Europe Aprotic Solvents Industry Volume (K Tons), by Type 2024 & 2032
- Figure 49: Europe Aprotic Solvents Industry Revenue Share (%), by Type 2024 & 2032
- Figure 50: Europe Aprotic Solvents Industry Volume Share (%), by Type 2024 & 2032
- Figure 51: Europe Aprotic Solvents Industry Revenue (Billion), by Application 2024 & 2032
- Figure 52: Europe Aprotic Solvents Industry Volume (K Tons), by Application 2024 & 2032
- Figure 53: Europe Aprotic Solvents Industry Revenue Share (%), by Application 2024 & 2032
- Figure 54: Europe Aprotic Solvents Industry Volume Share (%), by Application 2024 & 2032
- Figure 55: Europe Aprotic Solvents Industry Revenue (Billion), by Country 2024 & 2032
- Figure 56: Europe Aprotic Solvents Industry Volume (K Tons), by Country 2024 & 2032
- Figure 57: Europe Aprotic Solvents Industry Revenue Share (%), by Country 2024 & 2032
- Figure 58: Europe Aprotic Solvents Industry Volume Share (%), by Country 2024 & 2032
- Figure 59: South America Aprotic Solvents Industry Revenue (Billion), by Type 2024 & 2032
- Figure 60: South America Aprotic Solvents Industry Volume (K Tons), by Type 2024 & 2032
- Figure 61: South America Aprotic Solvents Industry Revenue Share (%), by Type 2024 & 2032
- Figure 62: South America Aprotic Solvents Industry Volume Share (%), by Type 2024 & 2032
- Figure 63: South America Aprotic Solvents Industry Revenue (Billion), by Application 2024 & 2032
- Figure 64: South America Aprotic Solvents Industry Volume (K Tons), by Application 2024 & 2032
- Figure 65: South America Aprotic Solvents Industry Revenue Share (%), by Application 2024 & 2032
- Figure 66: South America Aprotic Solvents Industry Volume Share (%), by Application 2024 & 2032
- Figure 67: South America Aprotic Solvents Industry Revenue (Billion), by Country 2024 & 2032
- Figure 68: South America Aprotic Solvents Industry Volume (K Tons), by Country 2024 & 2032
- Figure 69: South America Aprotic Solvents Industry Revenue Share (%), by Country 2024 & 2032
- Figure 70: South America Aprotic Solvents Industry Volume Share (%), by Country 2024 & 2032
- Figure 71: Middle East and Africa Aprotic Solvents Industry Revenue (Billion), by Type 2024 & 2032
- Figure 72: Middle East and Africa Aprotic Solvents Industry Volume (K Tons), by Type 2024 & 2032
- Figure 73: Middle East and Africa Aprotic Solvents Industry Revenue Share (%), by Type 2024 & 2032
- Figure 74: Middle East and Africa Aprotic Solvents Industry Volume Share (%), by Type 2024 & 2032
- Figure 75: Middle East and Africa Aprotic Solvents Industry Revenue (Billion), by Application 2024 & 2032
- Figure 76: Middle East and Africa Aprotic Solvents Industry Volume (K Tons), by Application 2024 & 2032
- Figure 77: Middle East and Africa Aprotic Solvents Industry Revenue Share (%), by Application 2024 & 2032
- Figure 78: Middle East and Africa Aprotic Solvents Industry Volume Share (%), by Application 2024 & 2032
- Figure 79: Middle East and Africa Aprotic Solvents Industry Revenue (Billion), by Country 2024 & 2032
- Figure 80: Middle East and Africa Aprotic Solvents Industry Volume (K Tons), by Country 2024 & 2032
- Figure 81: Middle East and Africa Aprotic Solvents Industry Revenue Share (%), by Country 2024 & 2032
- Figure 82: Middle East and Africa Aprotic Solvents Industry Volume Share (%), by Country 2024 & 2032
List of Tables
- Table 1: Global Aprotic Solvents Industry Revenue Billion Forecast, by Region 2019 & 2032
- Table 2: Global Aprotic Solvents Industry Volume K Tons Forecast, by Region 2019 & 2032
- Table 3: Global Aprotic Solvents Industry Revenue Billion Forecast, by Type 2019 & 2032
- Table 4: Global Aprotic Solvents Industry Volume K Tons Forecast, by Type 2019 & 2032
- Table 5: Global Aprotic Solvents Industry Revenue Billion Forecast, by Application 2019 & 2032
- Table 6: Global Aprotic Solvents Industry Volume K Tons Forecast, by Application 2019 & 2032
- Table 7: Global Aprotic Solvents Industry Revenue Billion Forecast, by Region 2019 & 2032
- Table 8: Global Aprotic Solvents Industry Volume K Tons Forecast, by Region 2019 & 2032
- Table 9: Global Aprotic Solvents Industry Revenue Billion Forecast, by Country 2019 & 2032
- Table 10: Global Aprotic Solvents Industry Volume K Tons Forecast, by Country 2019 & 2032
- Table 11: United States Aprotic Solvents Industry Revenue (Billion) Forecast, by Application 2019 & 2032
- Table 12: United States Aprotic Solvents Industry Volume (K Tons) Forecast, by Application 2019 & 2032
- Table 13: Canada Aprotic Solvents Industry Revenue (Billion) Forecast, by Application 2019 & 2032
- Table 14: Canada Aprotic Solvents Industry Volume (K Tons) Forecast, by Application 2019 & 2032
- Table 15: Mexico Aprotic Solvents Industry Revenue (Billion) Forecast, by Application 2019 & 2032
- Table 16: Mexico Aprotic Solvents Industry Volume (K Tons) Forecast, by Application 2019 & 2032
- Table 17: Global Aprotic Solvents Industry Revenue Billion Forecast, by Country 2019 & 2032
- Table 18: Global Aprotic Solvents Industry Volume K Tons Forecast, by Country 2019 & 2032
- Table 19: Germany Aprotic Solvents Industry Revenue (Billion) Forecast, by Application 2019 & 2032
- Table 20: Germany Aprotic Solvents Industry Volume (K Tons) Forecast, by Application 2019 & 2032
- Table 21: France Aprotic Solvents Industry Revenue (Billion) Forecast, by Application 2019 & 2032
- Table 22: France Aprotic Solvents Industry Volume (K Tons) Forecast, by Application 2019 & 2032
- Table 23: Italy Aprotic Solvents Industry Revenue (Billion) Forecast, by Application 2019 & 2032
- Table 24: Italy Aprotic Solvents Industry Volume (K Tons) Forecast, by Application 2019 & 2032
- Table 25: United Kingdom Aprotic Solvents Industry Revenue (Billion) Forecast, by Application 2019 & 2032
- Table 26: United Kingdom Aprotic Solvents Industry Volume (K Tons) Forecast, by Application 2019 & 2032
- Table 27: Netherlands Aprotic Solvents Industry Revenue (Billion) Forecast, by Application 2019 & 2032
- Table 28: Netherlands Aprotic Solvents Industry Volume (K Tons) Forecast, by Application 2019 & 2032
- Table 29: Rest of Europe Aprotic Solvents Industry Revenue (Billion) Forecast, by Application 2019 & 2032
- Table 30: Rest of Europe Aprotic Solvents Industry Volume (K Tons) Forecast, by Application 2019 & 2032
- Table 31: Global Aprotic Solvents Industry Revenue Billion Forecast, by Country 2019 & 2032
- Table 32: Global Aprotic Solvents Industry Volume K Tons Forecast, by Country 2019 & 2032
- Table 33: China Aprotic Solvents Industry Revenue (Billion) Forecast, by Application 2019 & 2032
- Table 34: China Aprotic Solvents Industry Volume (K Tons) Forecast, by Application 2019 & 2032
- Table 35: Japan Aprotic Solvents Industry Revenue (Billion) Forecast, by Application 2019 & 2032
- Table 36: Japan Aprotic Solvents Industry Volume (K Tons) Forecast, by Application 2019 & 2032
- Table 37: India Aprotic Solvents Industry Revenue (Billion) Forecast, by Application 2019 & 2032
- Table 38: India Aprotic Solvents Industry Volume (K Tons) Forecast, by Application 2019 & 2032
- Table 39: South Korea Aprotic Solvents Industry Revenue (Billion) Forecast, by Application 2019 & 2032
- Table 40: South Korea Aprotic Solvents Industry Volume (K Tons) Forecast, by Application 2019 & 2032
- Table 41: Taiwan Aprotic Solvents Industry Revenue (Billion) Forecast, by Application 2019 & 2032
- Table 42: Taiwan Aprotic Solvents Industry Volume (K Tons) Forecast, by Application 2019 & 2032
- Table 43: Australia Aprotic Solvents Industry Revenue (Billion) Forecast, by Application 2019 & 2032
- Table 44: Australia Aprotic Solvents Industry Volume (K Tons) Forecast, by Application 2019 & 2032
- Table 45: Rest of Asia-Pacific Aprotic Solvents Industry Revenue (Billion) Forecast, by Application 2019 & 2032
- Table 46: Rest of Asia-Pacific Aprotic Solvents Industry Volume (K Tons) Forecast, by Application 2019 & 2032
- Table 47: Global Aprotic Solvents Industry Revenue Billion Forecast, by Country 2019 & 2032
- Table 48: Global Aprotic Solvents Industry Volume K Tons Forecast, by Country 2019 & 2032
- Table 49: Brazil Aprotic Solvents Industry Revenue (Billion) Forecast, by Application 2019 & 2032
- Table 50: Brazil Aprotic Solvents Industry Volume (K Tons) Forecast, by Application 2019 & 2032
- Table 51: Argentina Aprotic Solvents Industry Revenue (Billion) Forecast, by Application 2019 & 2032
- Table 52: Argentina Aprotic Solvents Industry Volume (K Tons) Forecast, by Application 2019 & 2032
- Table 53: Rest of South America Aprotic Solvents Industry Revenue (Billion) Forecast, by Application 2019 & 2032
- Table 54: Rest of South America Aprotic Solvents Industry Volume (K Tons) Forecast, by Application 2019 & 2032
- Table 55: Global Aprotic Solvents Industry Revenue Billion Forecast, by Country 2019 & 2032
- Table 56: Global Aprotic Solvents Industry Volume K Tons Forecast, by Country 2019 & 2032
- Table 57: Middle East Aprotic Solvents Industry Revenue (Billion) Forecast, by Application 2019 & 2032
- Table 58: Middle East Aprotic Solvents Industry Volume (K Tons) Forecast, by Application 2019 & 2032
- Table 59: Africa Aprotic Solvents Industry Revenue (Billion) Forecast, by Application 2019 & 2032
- Table 60: Africa Aprotic Solvents Industry Volume (K Tons) Forecast, by Application 2019 & 2032
- Table 61: Global Aprotic Solvents Industry Revenue Billion Forecast, by Type 2019 & 2032
- Table 62: Global Aprotic Solvents Industry Volume K Tons Forecast, by Type 2019 & 2032
- Table 63: Global Aprotic Solvents Industry Revenue Billion Forecast, by Application 2019 & 2032
- Table 64: Global Aprotic Solvents Industry Volume K Tons Forecast, by Application 2019 & 2032
- Table 65: Global Aprotic Solvents Industry Revenue Billion Forecast, by Country 2019 & 2032
- Table 66: Global Aprotic Solvents Industry Volume K Tons Forecast, by Country 2019 & 2032
- Table 67: China Aprotic Solvents Industry Revenue (Billion) Forecast, by Application 2019 & 2032
- Table 68: China Aprotic Solvents Industry Volume (K Tons) Forecast, by Application 2019 & 2032
- Table 69: India Aprotic Solvents Industry Revenue (Billion) Forecast, by Application 2019 & 2032
- Table 70: India Aprotic Solvents Industry Volume (K Tons) Forecast, by Application 2019 & 2032
- Table 71: Japan Aprotic Solvents Industry Revenue (Billion) Forecast, by Application 2019 & 2032
- Table 72: Japan Aprotic Solvents Industry Volume (K Tons) Forecast, by Application 2019 & 2032
- Table 73: South Korea Aprotic Solvents Industry Revenue (Billion) Forecast, by Application 2019 & 2032
- Table 74: South Korea Aprotic Solvents Industry Volume (K Tons) Forecast, by Application 2019 & 2032
- Table 75: Rest of Asia Pacific Aprotic Solvents Industry Revenue (Billion) Forecast, by Application 2019 & 2032
- Table 76: Rest of Asia Pacific Aprotic Solvents Industry Volume (K Tons) Forecast, by Application 2019 & 2032
- Table 77: Global Aprotic Solvents Industry Revenue Billion Forecast, by Type 2019 & 2032
- Table 78: Global Aprotic Solvents Industry Volume K Tons Forecast, by Type 2019 & 2032
- Table 79: Global Aprotic Solvents Industry Revenue Billion Forecast, by Application 2019 & 2032
- Table 80: Global Aprotic Solvents Industry Volume K Tons Forecast, by Application 2019 & 2032
- Table 81: Global Aprotic Solvents Industry Revenue Billion Forecast, by Country 2019 & 2032
- Table 82: Global Aprotic Solvents Industry Volume K Tons Forecast, by Country 2019 & 2032
- Table 83: United States Aprotic Solvents Industry Revenue (Billion) Forecast, by Application 2019 & 2032
- Table 84: United States Aprotic Solvents Industry Volume (K Tons) Forecast, by Application 2019 & 2032
- Table 85: Canada Aprotic Solvents Industry Revenue (Billion) Forecast, by Application 2019 & 2032
- Table 86: Canada Aprotic Solvents Industry Volume (K Tons) Forecast, by Application 2019 & 2032
- Table 87: Mexico Aprotic Solvents Industry Revenue (Billion) Forecast, by Application 2019 & 2032
- Table 88: Mexico Aprotic Solvents Industry Volume (K Tons) Forecast, by Application 2019 & 2032
- Table 89: Global Aprotic Solvents Industry Revenue Billion Forecast, by Type 2019 & 2032
- Table 90: Global Aprotic Solvents Industry Volume K Tons Forecast, by Type 2019 & 2032
- Table 91: Global Aprotic Solvents Industry Revenue Billion Forecast, by Application 2019 & 2032
- Table 92: Global Aprotic Solvents Industry Volume K Tons Forecast, by Application 2019 & 2032
- Table 93: Global Aprotic Solvents Industry Revenue Billion Forecast, by Country 2019 & 2032
- Table 94: Global Aprotic Solvents Industry Volume K Tons Forecast, by Country 2019 & 2032
- Table 95: Germany Aprotic Solvents Industry Revenue (Billion) Forecast, by Application 2019 & 2032
- Table 96: Germany Aprotic Solvents Industry Volume (K Tons) Forecast, by Application 2019 & 2032
- Table 97: United Kingdom Aprotic Solvents Industry Revenue (Billion) Forecast, by Application 2019 & 2032
- Table 98: United Kingdom Aprotic Solvents Industry Volume (K Tons) Forecast, by Application 2019 & 2032
- Table 99: France Aprotic Solvents Industry Revenue (Billion) Forecast, by Application 2019 & 2032
- Table 100: France Aprotic Solvents Industry Volume (K Tons) Forecast, by Application 2019 & 2032
- Table 101: Italy Aprotic Solvents Industry Revenue (Billion) Forecast, by Application 2019 & 2032
- Table 102: Italy Aprotic Solvents Industry Volume (K Tons) Forecast, by Application 2019 & 2032
- Table 103: Rest of Europe Aprotic Solvents Industry Revenue (Billion) Forecast, by Application 2019 & 2032
- Table 104: Rest of Europe Aprotic Solvents Industry Volume (K Tons) Forecast, by Application 2019 & 2032
- Table 105: Global Aprotic Solvents Industry Revenue Billion Forecast, by Type 2019 & 2032
- Table 106: Global Aprotic Solvents Industry Volume K Tons Forecast, by Type 2019 & 2032
- Table 107: Global Aprotic Solvents Industry Revenue Billion Forecast, by Application 2019 & 2032
- Table 108: Global Aprotic Solvents Industry Volume K Tons Forecast, by Application 2019 & 2032
- Table 109: Global Aprotic Solvents Industry Revenue Billion Forecast, by Country 2019 & 2032
- Table 110: Global Aprotic Solvents Industry Volume K Tons Forecast, by Country 2019 & 2032
- Table 111: Brazil Aprotic Solvents Industry Revenue (Billion) Forecast, by Application 2019 & 2032
- Table 112: Brazil Aprotic Solvents Industry Volume (K Tons) Forecast, by Application 2019 & 2032
- Table 113: Argentina Aprotic Solvents Industry Revenue (Billion) Forecast, by Application 2019 & 2032
- Table 114: Argentina Aprotic Solvents Industry Volume (K Tons) Forecast, by Application 2019 & 2032
- Table 115: Rest of South America Aprotic Solvents Industry Revenue (Billion) Forecast, by Application 2019 & 2032
- Table 116: Rest of South America Aprotic Solvents Industry Volume (K Tons) Forecast, by Application 2019 & 2032
- Table 117: Global Aprotic Solvents Industry Revenue Billion Forecast, by Type 2019 & 2032
- Table 118: Global Aprotic Solvents Industry Volume K Tons Forecast, by Type 2019 & 2032
- Table 119: Global Aprotic Solvents Industry Revenue Billion Forecast, by Application 2019 & 2032
- Table 120: Global Aprotic Solvents Industry Volume K Tons Forecast, by Application 2019 & 2032
- Table 121: Global Aprotic Solvents Industry Revenue Billion Forecast, by Country 2019 & 2032
- Table 122: Global Aprotic Solvents Industry Volume K Tons Forecast, by Country 2019 & 2032
- Table 123: Saudi Arabia Aprotic Solvents Industry Revenue (Billion) Forecast, by Application 2019 & 2032
- Table 124: Saudi Arabia Aprotic Solvents Industry Volume (K Tons) Forecast, by Application 2019 & 2032
- Table 125: South Africa Aprotic Solvents Industry Revenue (Billion) Forecast, by Application 2019 & 2032
- Table 126: South Africa Aprotic Solvents Industry Volume (K Tons) Forecast, by Application 2019 & 2032
- Table 127: Rest of Middle East and Africa Aprotic Solvents Industry Revenue (Billion) Forecast, by Application 2019 & 2032
- Table 128: Rest of Middle East and Africa Aprotic Solvents Industry Volume (K Tons) Forecast, by Application 2019 & 2032
Frequently Asked Questions
1. What is the projected Compound Annual Growth Rate (CAGR) of the Aprotic Solvents Industry?
The projected CAGR is approximately 3.06%.
2. Which companies are prominent players in the Aprotic Solvents Industry?
Key companies in the market include INEOS, Mitsui Chemicals Inc , Gaylord Chemical Company LLC, AlzChem Group AG, Ashland, BASF SE, Dow, Eastman Chemical Company.
3. What are the main segments of the Aprotic Solvents Industry?
The market segments include Type, Application.
4. Can you provide details about the market size?
The market size is estimated to be USD 17.49 Billion as of 2022.
5. What are some drivers contributing to market growth?
; Growing Demand from Oil and Gas Industry; Increasing Consumption in Pharmaceutical Sector.
6. What are the notable trends driving market growth?
Application in the Oil and Gas Sector to Dominate the Market.
7. Are there any restraints impacting market growth?
; Non-Toxic Substitutes; Envrionmental Concerns; Unfavorable Conditions Arising Due to COVID-19 Outbreak.
8. Can you provide examples of recent developments in the market?
N/A
9. What pricing options are available for accessing the report?
Pricing options include single-user, multi-user, and enterprise licenses priced at USD 4750, USD 5250, and USD 8750 respectively.
10. Is the market size provided in terms of value or volume?
The market size is provided in terms of value, measured in Billion and volume, measured in K Tons.
11. Are there any specific market keywords associated with the report?
Yes, the market keyword associated with the report is "Aprotic Solvents Industry," which aids in identifying and referencing the specific market segment covered.
12. How do I determine which pricing option suits my needs best?
The pricing options vary based on user requirements and access needs. Individual users may opt for single-user licenses, while businesses requiring broader access may choose multi-user or enterprise licenses for cost-effective access to the report.
13. Are there any additional resources or data provided in the Aprotic Solvents Industry report?
While the report offers comprehensive insights, it's advisable to review the specific contents or supplementary materials provided to ascertain if additional resources or data are available.
14. How can I stay updated on further developments or reports in the Aprotic Solvents Industry?
To stay informed about further developments, trends, and reports in the Aprotic Solvents Industry, consider subscribing to industry newsletters, following relevant companies and organizations, or regularly checking reputable industry news sources and publications.
Methodology
Step 1 - Identification of Relevant Samples Size from Population Database


Step 2 - Approaches for Defining Global Market Size (Value, Volume* & Price*)

Note*: In applicable scenarios
Step 3 - Data Sources
Primary Research
- Web Analytics
- Survey Reports
- Research Institute
- Latest Research Reports
- Opinion Leaders
Secondary Research
- Annual Reports
- White Paper
- Latest Press Release
- Industry Association
- Paid Database
- Investor Presentations

Step 4 - Data Triangulation
Involves using different sources of information in order to increase the validity of a study
These sources are likely to be stakeholders in a program - participants, other researchers, program staff, other community members, and so on.
Then we put all data in single framework & apply various statistical tools to find out the dynamic on the market.
During the analysis stage, feedback from the stakeholder groups would be compared to determine areas of agreement as well as areas of divergence


