

Key Insights
The Application Virtualization Solution market is poised for substantial expansion, projected to reach a significant USD 58.6 billion in 2025. This robust growth is underpinned by an impressive Compound Annual Growth Rate (CAGR) of 22.3% anticipated over the forecast period of 2025-2033. This surge is primarily driven by the escalating demand from both Small and Medium Enterprises (SMEs) and Large Enterprises for enhanced IT agility, cost optimization, and improved end-user experience. The adoption of Platform as a Service (PaaS) and Software as a Service (SaaS) models for application delivery is a key enabler, allowing businesses to streamline deployment, management, and access to critical applications from any device, anywhere. Furthermore, the increasing prevalence of remote and hybrid work models has amplified the need for secure and scalable application access, making virtualization solutions indispensable for maintaining business continuity and productivity. Emerging trends like desktop-as-a-service (DaaS) and the integration of AI and machine learning for enhanced performance monitoring and predictive maintenance are further fueling market momentum.
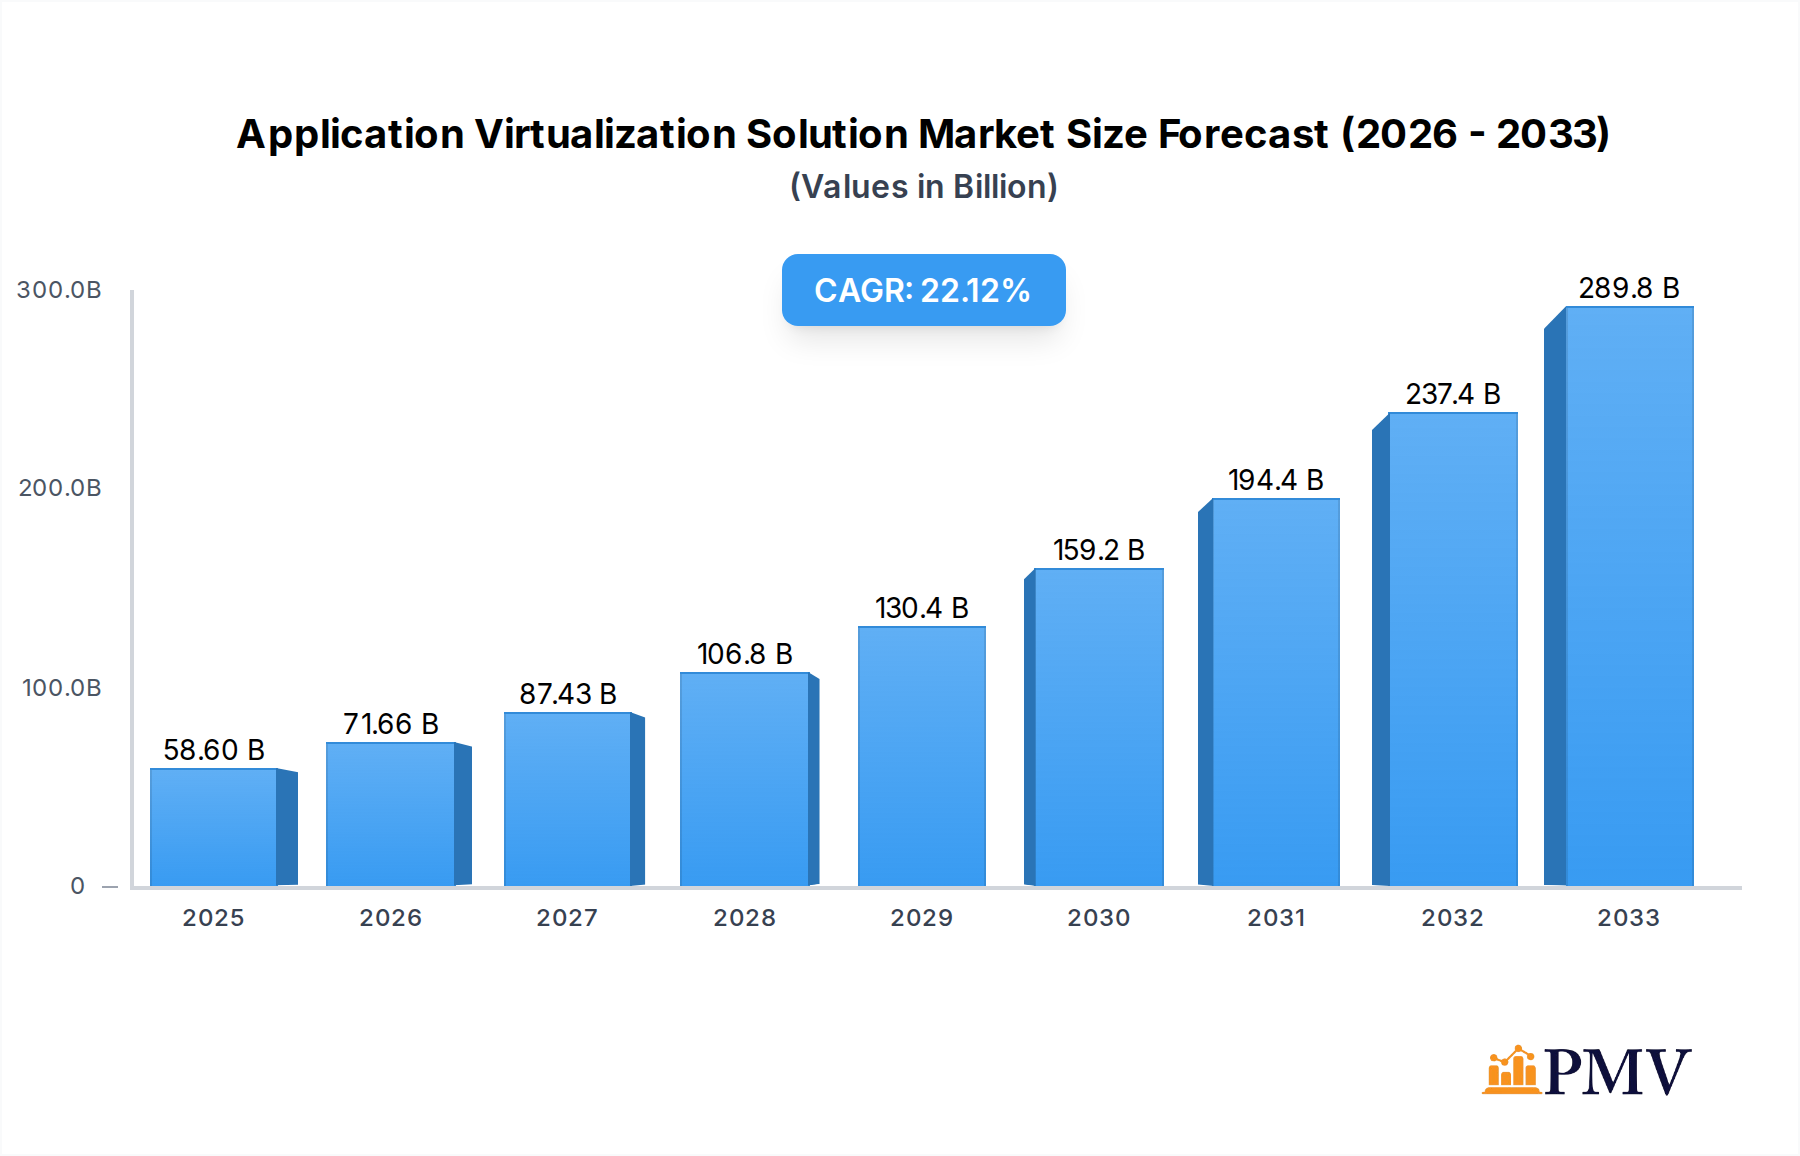
Application Virtualization Solution Market Size (In Billion)
While the market is experiencing robust growth, certain restraints such as initial implementation costs for complex deployments and concerns surrounding data security and compliance in highly regulated industries need to be strategically addressed by solution providers. However, these challenges are increasingly being mitigated through the development of more affordable and secure virtual desktop infrastructure (VDI) and application streaming technologies. The competitive landscape is dynamic, featuring established players like Microsoft (Azure), VMware, and Citrix Systems alongside innovative specialists such as CloudShare, Nutanix, and NVIDIA, all vying to capture market share by offering differentiated solutions that cater to diverse enterprise needs. Geographical expansion, particularly in emerging economies across Asia Pacific and Middle East & Africa, presents significant untapped potential for market players, driven by increasing digital transformation initiatives and the growing adoption of cloud-based solutions.

Application Virtualization Solution Company Market Share
Application Virtualization Solution Market Report: Comprehensive Analysis and Future Outlook (2019-2033)
This in-depth market research report provides a detailed examination of the global Application Virtualization Solution market. Spanning a study period from 2019 to 2033, with a base year of 2025 and a forecast period of 2025-2033, this analysis offers unparalleled insights into market dynamics, trends, key players, and future growth trajectories. With an estimated market size projected to reach billions in value, this report is an indispensable resource for stakeholders seeking to understand and capitalize on the evolving landscape of application delivery and management.
Application Virtualization Solution Market Structure & Competitive Dynamics
The Application Virtualization Solution market exhibits a moderately concentrated structure, with several established vendors and emerging innovators vying for market share. Key players like Microsoft (Azure), VMware, and Citrix Systems hold significant positions, driven by robust product portfolios and extensive enterprise adoption. The innovation ecosystem is vibrant, fueled by advancements in cloud computing, AI-driven resource optimization, and enhanced security protocols. Regulatory frameworks, while generally supportive of digital transformation, can present localized compliance challenges. Product substitutes, such as traditional software installations and containerization technologies, are present but often lack the comprehensive manageability and scalability offered by virtualization. End-user trends are heavily influenced by the demand for flexible remote work capabilities, reduced IT overhead, and seamless application access across devices, driving adoption for both Small and Medium Enterprises (SMEs) and Large Enterprises. Mergers and Acquisitions (M&A) activities have been strategic, aimed at consolidating market presence, expanding technological capabilities, and acquiring customer bases, with deal values often in the billions. For instance, recent M&A activities have aimed to integrate advanced security features, valued in the hundreds of millions.
Application Virtualization Solution Industry Trends & Insights
The Application Virtualization Solution industry is experiencing robust growth, with a projected Compound Annual Growth Rate (CAGR) exceeding 15% over the forecast period. This expansion is primarily driven by the accelerating digital transformation initiatives across sectors, the escalating need for secure and flexible remote work solutions, and the continuous demand for operational efficiency and cost optimization in IT infrastructure. Technological disruptions are a significant catalyst, with advancements in cloud-native architectures, edge computing, and progressive web applications (PWAs) reshaping application delivery paradigms. The increasing adoption of Platform as a Service (PaaS) and Software as a Service (SaaS) models further fuels the market, offering scalable and on-demand application access. Consumer preferences are shifting towards ubiquitous access to applications from any device, irrespective of location, emphasizing user experience and productivity. Competitive dynamics are intensifying, with vendors differentiating through enhanced security features, superior performance optimization, advanced analytics for resource management, and seamless integration with existing IT ecosystems. Market penetration is steadily increasing across both SME and Large Enterprise segments, as organizations recognize the strategic advantages of application virtualization in enhancing agility and reducing TCO, with the global market size expected to surpass several hundred billion by 2033.
Dominant Markets & Segments in Application Virtualization Solution
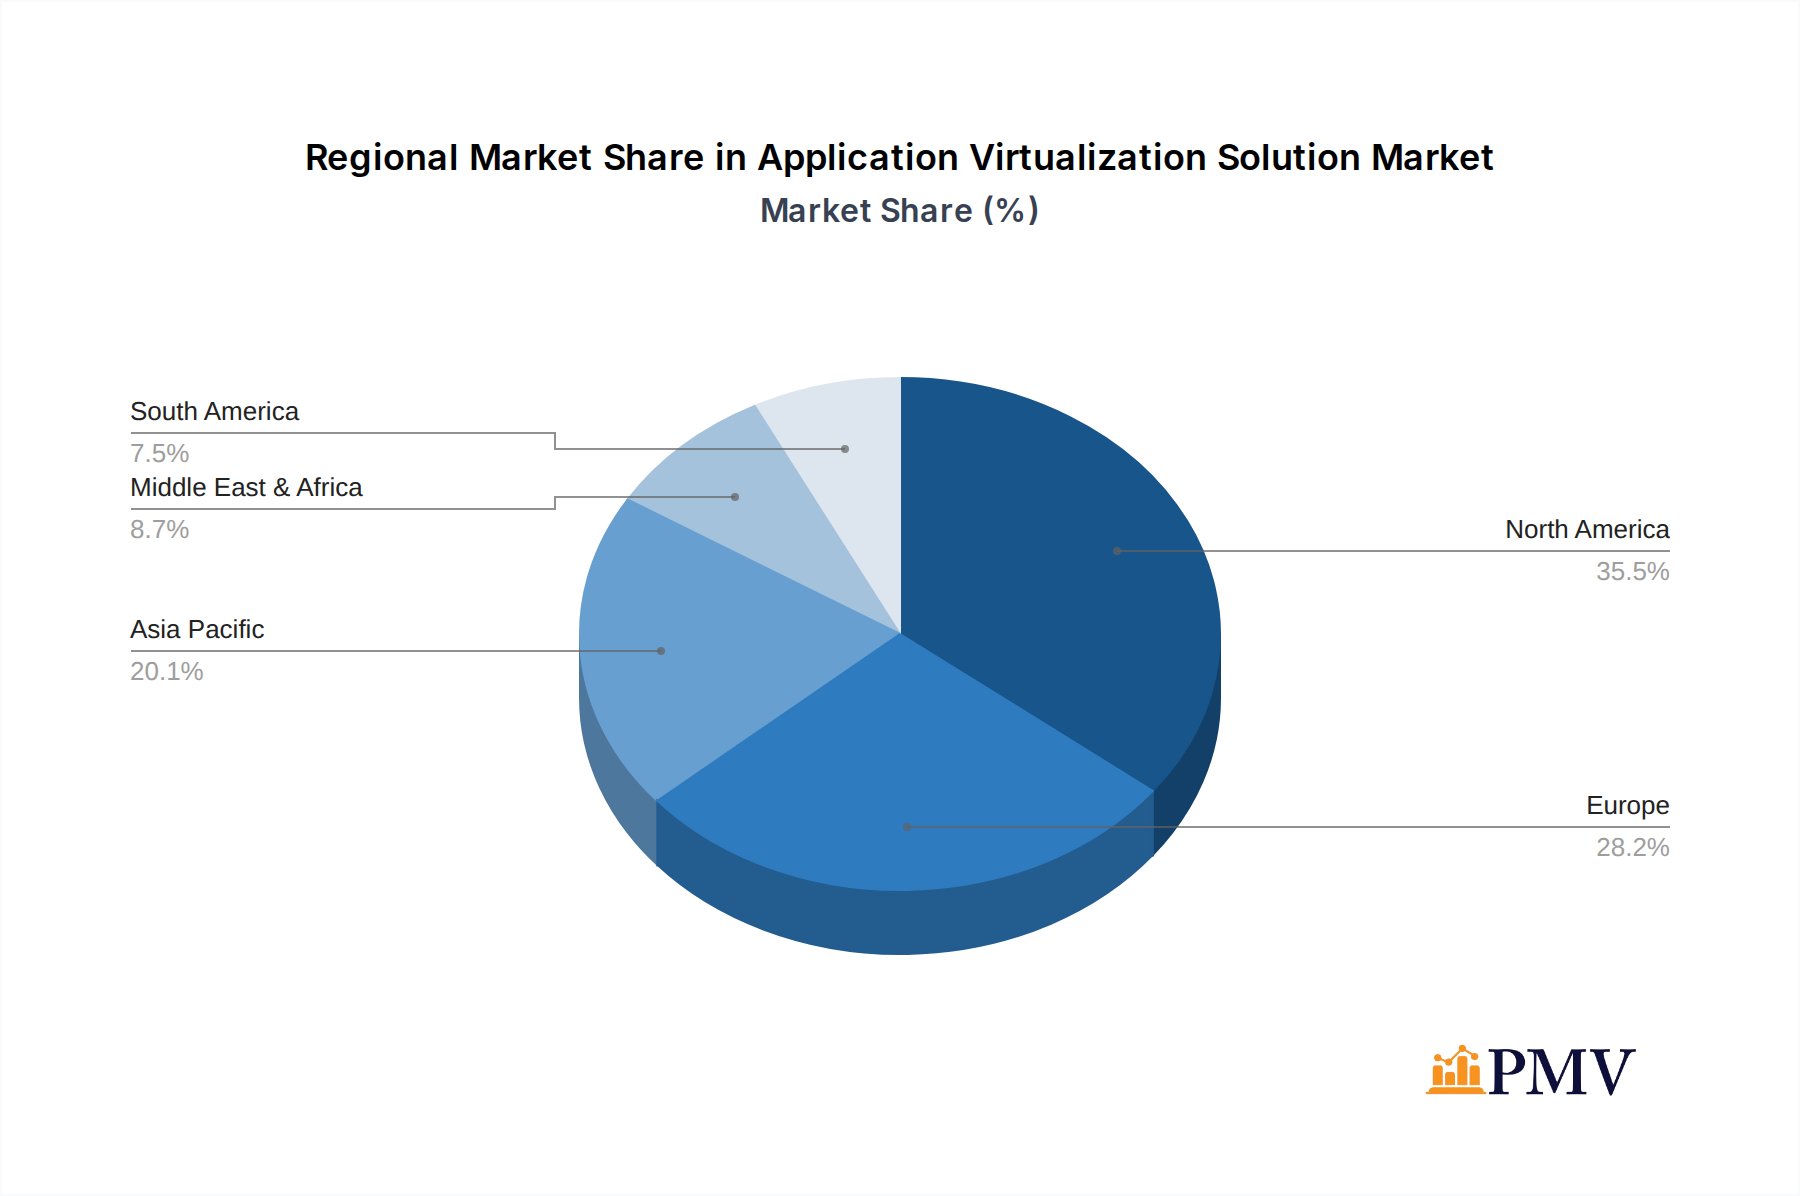
The dominant markets for Application Virtualization Solutions are characterized by high levels of digital maturity and strong government initiatives supporting cloud adoption. North America, particularly the United States, leads in market dominance due to its advanced technological infrastructure, significant presence of large enterprises, and substantial investment in R&D. Europe follows closely, driven by the GDPR compliance requirements and a growing appetite for digital transformation solutions among its diverse economic landscape.
Application Segment Dominance:
- Large Enterprise: This segment represents the largest share of the market, accounting for over 60% of the total market revenue. Key drivers include the imperative for centralized management of complex IT environments, the need for enhanced security across a vast user base, and the drive for cost savings through efficient resource utilization. Economic policies favoring cloud migration and substantial IT budgets empower large enterprises to invest in comprehensive application virtualization solutions. The market size for Large Enterprises is estimated to be in the tens of billions.
- SME (Small and Medium Enterprises): While smaller in individual spending, the SME segment is exhibiting the fastest growth rate. Its dominance is driven by the increasing affordability and accessibility of cloud-based solutions, enabling SMEs to compete with larger organizations by leveraging advanced IT capabilities. Government incentives for SME digitalization and the growing realization of productivity gains are significant factors. The market size for SMEs is projected to reach several billion by 2033.
Types Segment Dominance:
- PaaS (Platform as a Service): This segment is experiencing rapid expansion due to its inherent flexibility and scalability, allowing developers and IT departments to focus on application development rather than infrastructure management. Economic policies promoting innovation and the growing adoption of cloud-native development practices are key drivers. The PaaS market is estimated to be in the tens of billions.
- SaaS (Software as a Service): SaaS continues to be a dominant force, offering end-users ready access to a wide array of applications through a subscription model. Its dominance is fueled by ease of deployment, subscription-based pricing that is attractive to all enterprise sizes, and continuous updates and feature enhancements delivered by vendors. The market size for SaaS is substantial, projected to be in the hundreds of billions, driven by its widespread adoption across various business functions.
Infrastructure development, including robust internet connectivity and data center capabilities, further underpins the dominance of these segments. Furthermore, regulatory frameworks that encourage data localization and cloud security are shaping the strategic deployment of these solutions.
Application Virtualization Solution Product Innovations
Recent product innovations in Application Virtualization Solutions are centered on enhancing user experience, bolstering security, and enabling hybrid cloud deployments. Key developments include AI-powered predictive resource allocation, offering seamless performance even under peak loads, and advanced containerization technologies that enable greater application portability. Integration with blockchain for enhanced data integrity and security is also emerging as a significant trend. Competitive advantages are being derived from granular control over application delivery, robust disaster recovery capabilities, and the ability to deliver legacy applications to modern operating systems with minimal rework.
Report Segmentation & Scope
This report segment the Application Virtualization Solution market based on Application and Type. The Application segmentation includes Small and Medium Enterprises (SME) and Large Enterprise, each offering distinct growth potentials and adoption patterns. The Type segmentation encompasses Platform as a Service (PaaS) and Software as a Service (SaaS), reflecting the diverse delivery models prevalent in the market. Growth projections for each segment are meticulously analyzed, with estimated market sizes and competitive dynamics to provide a comprehensive overview of their individual contributions to the overall market value. The SME segment is projected to witness a CAGR of xx% reaching a market size of billions by 2033, while the Large Enterprise segment is expected to grow at a CAGR of xx% with a market size in the tens of billions. For Types, PaaS is projected to grow at xx% to a market size of billions, and SaaS at xx% to a market size in the hundreds of billions.
Key Drivers of Application Virtualization Solution Growth
The growth of the Application Virtualization Solution market is propelled by several key factors. The persistent shift towards remote and hybrid work models mandates flexible and secure application access, a core strength of virtualization. Economic policies that encourage digitalization and cloud adoption, alongside significant government investments in IT modernization, further catalyze market expansion. Technological advancements, particularly in cloud infrastructure and AI, enhance the efficiency, scalability, and security of these solutions. The increasing need for cost optimization in IT operations, through reduced hardware dependency and streamlined management, is a significant economic driver.
Challenges in the Application Virtualization Solution Sector
Despite robust growth, the Application Virtualization Solution sector faces several challenges. Regulatory hurdles and data privacy compliance in specific geographies can complicate global deployments, requiring tailored strategies. Supply chain issues related to specialized hardware components, while less prevalent now, can still impact large-scale implementations. Intense competitive pressures from established vendors and emerging niche players necessitate continuous innovation and competitive pricing strategies. Furthermore, the complexity of migrating legacy applications and ensuring seamless integration with diverse IT environments can pose technical challenges, impacting widespread adoption.
Leading Players in the Application Virtualization Solution Market
- Ceedo Technologies
- CloudShare
- Micro Focus
- HD2i
- Evalaze
- Sphere 3D
- Next Axiom
- Inuvika
- Microsoft
- NComputing
- Nutanix
- NVIDIA
- PACE Suite
- Parallels
- Symantec
- VMware
- Citrix Systems
Key Developments in Application Virtualization Solution Sector
- 2023: Microsoft launches Azure Virtual Desktop enhancements for improved performance and cost-efficiency.
- 2023: VMware announces expanded integrations of its Anywhere Workspace solutions with leading security partners.
- 2024: Citrix Systems unveils new features for its Virtual Apps and Desktops service, focusing on enhanced security and user experience.
- 2024: Nutanix strengthens its hybrid cloud offerings with advanced application delivery capabilities.
- 2024: NVIDIA introduces new GPU virtualization solutions tailored for AI and machine learning workloads.
- 2025: Parallels expands its offerings for remote work and secure application access across multiple platforms.
- 2025: Evalaze enhances its application packaging and deployment tools for faster IT modernization.
- 2025: Inuvika focuses on simplifying VDI deployment for SMEs with cloud-native solutions.
- 2025: CloudShare develops advanced labs for software testing and training in secure virtual environments.
- 2025: HD2i introduces streamlined solutions for application modernization and delivery.
- 2025: Ceedo Technologies focuses on advanced endpoint security and application isolation.
- 2025: Micro Focus enhances its enterprise application management portfolio with virtualization capabilities.
- 2025: Sphere 3D emphasizes resilient and scalable desktop and application virtualization solutions.
- 2025: Next Axiom focuses on secure and performant application delivery for remote workforces.
- 2025: PACE Suite releases advanced tools for application virtualization and containerization.
- 2025: Symantec integrates its security solutions with leading application virtualization platforms.
Strategic Application Virtualization Solution Market Outlook
The strategic outlook for the Application Virtualization Solution market is exceptionally positive, driven by enduring trends of digital transformation, remote work, and cloud adoption. Growth accelerators include the increasing demand for secure application delivery in a distributed workforce, the need for agile IT infrastructures capable of rapid scaling, and the continuous innovation in cloud-native technologies. Organizations that strategically invest in comprehensive application virtualization solutions will be best positioned to enhance operational efficiency, improve employee productivity, and maintain a competitive edge in the evolving digital landscape. The market offers significant opportunities for vendors to expand their offerings in areas like AI-driven automation, advanced cybersecurity integrations, and specialized industry solutions.
Application Virtualization Solution Segmentation
-
1. Application
- 1.1. SME (Small and Medium Enterprises)
- 1.2. Large Enterprise
-
2. Types
- 2.1. PaaS
- 2.2. SaaS
Application Virtualization Solution Segmentation By Geography
-
1. North America
- 1.1. United States
- 1.2. Canada
- 1.3. Mexico
-
2. South America
- 2.1. Brazil
- 2.2. Argentina
- 2.3. Rest of South America
-
3. Europe
- 3.1. United Kingdom
- 3.2. Germany
- 3.3. France
- 3.4. Italy
- 3.5. Spain
- 3.6. Russia
- 3.7. Benelux
- 3.8. Nordics
- 3.9. Rest of Europe
-
4. Middle East & Africa
- 4.1. Turkey
- 4.2. Israel
- 4.3. GCC
- 4.4. North Africa
- 4.5. South Africa
- 4.6. Rest of Middle East & Africa
-
5. Asia Pacific
- 5.1. China
- 5.2. India
- 5.3. Japan
- 5.4. South Korea
- 5.5. ASEAN
- 5.6. Oceania
- 5.7. Rest of Asia Pacific
Application Virtualization Solution Regional Market Share
Geographic Coverage of Application Virtualization Solution
Application Virtualization Solution REPORT HIGHLIGHTS
| Aspects | Details |
|---|---|
| Study Period | 2020-2034 |
| Base Year | 2025 |
| Estimated Year | 2026 |
| Forecast Period | 2026-2034 |
| Historical Period | 2020-2025 |
| Growth Rate | CAGR of 22.3% from 2020-2034 |
| Segmentation |
|
Table of Contents
- 1. Introduction
- 1.1. Research Scope
- 1.2. Market Segmentation
- 1.3. Research Methodology
- 1.4. Definitions and Assumptions
- 2. Executive Summary
- 2.1. Introduction
- 3. Market Dynamics
- 3.1. Introduction
- 3.2. Market Drivers
- 3.3. Market Restrains
- 3.4. Market Trends
- 4. Market Factor Analysis
- 4.1. Porters Five Forces
- 4.2. Supply/Value Chain
- 4.3. PESTEL analysis
- 4.4. Market Entropy
- 4.5. Patent/Trademark Analysis
- 5. Global Application Virtualization Solution Analysis, Insights and Forecast, 2020-2032
- 5.1. Market Analysis, Insights and Forecast - by Application
- 5.1.1. SME (Small and Medium Enterprises)
- 5.1.2. Large Enterprise
- 5.2. Market Analysis, Insights and Forecast - by Types
- 5.2.1. PaaS
- 5.2.2. SaaS
- 5.3. Market Analysis, Insights and Forecast - by Region
- 5.3.1. North America
- 5.3.2. South America
- 5.3.3. Europe
- 5.3.4. Middle East & Africa
- 5.3.5. Asia Pacific
- 5.1. Market Analysis, Insights and Forecast - by Application
- 6. North America Application Virtualization Solution Analysis, Insights and Forecast, 2020-2032
- 6.1. Market Analysis, Insights and Forecast - by Application
- 6.1.1. SME (Small and Medium Enterprises)
- 6.1.2. Large Enterprise
- 6.2. Market Analysis, Insights and Forecast - by Types
- 6.2.1. PaaS
- 6.2.2. SaaS
- 6.1. Market Analysis, Insights and Forecast - by Application
- 7. South America Application Virtualization Solution Analysis, Insights and Forecast, 2020-2032
- 7.1. Market Analysis, Insights and Forecast - by Application
- 7.1.1. SME (Small and Medium Enterprises)
- 7.1.2. Large Enterprise
- 7.2. Market Analysis, Insights and Forecast - by Types
- 7.2.1. PaaS
- 7.2.2. SaaS
- 7.1. Market Analysis, Insights and Forecast - by Application
- 8. Europe Application Virtualization Solution Analysis, Insights and Forecast, 2020-2032
- 8.1. Market Analysis, Insights and Forecast - by Application
- 8.1.1. SME (Small and Medium Enterprises)
- 8.1.2. Large Enterprise
- 8.2. Market Analysis, Insights and Forecast - by Types
- 8.2.1. PaaS
- 8.2.2. SaaS
- 8.1. Market Analysis, Insights and Forecast - by Application
- 9. Middle East & Africa Application Virtualization Solution Analysis, Insights and Forecast, 2020-2032
- 9.1. Market Analysis, Insights and Forecast - by Application
- 9.1.1. SME (Small and Medium Enterprises)
- 9.1.2. Large Enterprise
- 9.2. Market Analysis, Insights and Forecast - by Types
- 9.2.1. PaaS
- 9.2.2. SaaS
- 9.1. Market Analysis, Insights and Forecast - by Application
- 10. Asia Pacific Application Virtualization Solution Analysis, Insights and Forecast, 2020-2032
- 10.1. Market Analysis, Insights and Forecast - by Application
- 10.1.1. SME (Small and Medium Enterprises)
- 10.1.2. Large Enterprise
- 10.2. Market Analysis, Insights and Forecast - by Types
- 10.2.1. PaaS
- 10.2.2. SaaS
- 10.1. Market Analysis, Insights and Forecast - by Application
- 11. Competitive Analysis
- 11.1. Global Market Share Analysis 2025
- 11.2. Company Profiles
- 11.2.1 Ceedo Technologies
- 11.2.1.1. Overview
- 11.2.1.2. Products
- 11.2.1.3. SWOT Analysis
- 11.2.1.4. Recent Developments
- 11.2.1.5. Financials (Based on Availability)
- 11.2.2 CloudShare
- 11.2.2.1. Overview
- 11.2.2.2. Products
- 11.2.2.3. SWOT Analysis
- 11.2.2.4. Recent Developments
- 11.2.2.5. Financials (Based on Availability)
- 11.2.3 MicroFoucus
- 11.2.3.1. Overview
- 11.2.3.2. Products
- 11.2.3.3. SWOT Analysis
- 11.2.3.4. Recent Developments
- 11.2.3.5. Financials (Based on Availability)
- 11.2.4 HD2i
- 11.2.4.1. Overview
- 11.2.4.2. Products
- 11.2.4.3. SWOT Analysis
- 11.2.4.4. Recent Developments
- 11.2.4.5. Financials (Based on Availability)
- 11.2.5 Evalaze
- 11.2.5.1. Overview
- 11.2.5.2. Products
- 11.2.5.3. SWOT Analysis
- 11.2.5.4. Recent Developments
- 11.2.5.5. Financials (Based on Availability)
- 11.2.6 Sphere 3D
- 11.2.6.1. Overview
- 11.2.6.2. Products
- 11.2.6.3. SWOT Analysis
- 11.2.6.4. Recent Developments
- 11.2.6.5. Financials (Based on Availability)
- 11.2.7 Next Axiom
- 11.2.7.1. Overview
- 11.2.7.2. Products
- 11.2.7.3. SWOT Analysis
- 11.2.7.4. Recent Developments
- 11.2.7.5. Financials (Based on Availability)
- 11.2.8 Inuvika
- 11.2.8.1. Overview
- 11.2.8.2. Products
- 11.2.8.3. SWOT Analysis
- 11.2.8.4. Recent Developments
- 11.2.8.5. Financials (Based on Availability)
- 11.2.9 Microsoft(Azure)
- 11.2.9.1. Overview
- 11.2.9.2. Products
- 11.2.9.3. SWOT Analysis
- 11.2.9.4. Recent Developments
- 11.2.9.5. Financials (Based on Availability)
- 11.2.10 Ncomputing
- 11.2.10.1. Overview
- 11.2.10.2. Products
- 11.2.10.3. SWOT Analysis
- 11.2.10.4. Recent Developments
- 11.2.10.5. Financials (Based on Availability)
- 11.2.11 Nutanix
- 11.2.11.1. Overview
- 11.2.11.2. Products
- 11.2.11.3. SWOT Analysis
- 11.2.11.4. Recent Developments
- 11.2.11.5. Financials (Based on Availability)
- 11.2.12 NVIDIA
- 11.2.12.1. Overview
- 11.2.12.2. Products
- 11.2.12.3. SWOT Analysis
- 11.2.12.4. Recent Developments
- 11.2.12.5. Financials (Based on Availability)
- 11.2.13 PACE Suite
- 11.2.13.1. Overview
- 11.2.13.2. Products
- 11.2.13.3. SWOT Analysis
- 11.2.13.4. Recent Developments
- 11.2.13.5. Financials (Based on Availability)
- 11.2.14 Parallels
- 11.2.14.1. Overview
- 11.2.14.2. Products
- 11.2.14.3. SWOT Analysis
- 11.2.14.4. Recent Developments
- 11.2.14.5. Financials (Based on Availability)
- 11.2.15 Symantec
- 11.2.15.1. Overview
- 11.2.15.2. Products
- 11.2.15.3. SWOT Analysis
- 11.2.15.4. Recent Developments
- 11.2.15.5. Financials (Based on Availability)
- 11.2.16 Vmware
- 11.2.16.1. Overview
- 11.2.16.2. Products
- 11.2.16.3. SWOT Analysis
- 11.2.16.4. Recent Developments
- 11.2.16.5. Financials (Based on Availability)
- 11.2.17 Citrix Systems
- 11.2.17.1. Overview
- 11.2.17.2. Products
- 11.2.17.3. SWOT Analysis
- 11.2.17.4. Recent Developments
- 11.2.17.5. Financials (Based on Availability)
- 11.2.1 Ceedo Technologies
List of Figures
- Figure 1: Global Application Virtualization Solution Revenue Breakdown (undefined, %) by Region 2025 & 2033
- Figure 2: North America Application Virtualization Solution Revenue (undefined), by Application 2025 & 2033
- Figure 3: North America Application Virtualization Solution Revenue Share (%), by Application 2025 & 2033
- Figure 4: North America Application Virtualization Solution Revenue (undefined), by Types 2025 & 2033
- Figure 5: North America Application Virtualization Solution Revenue Share (%), by Types 2025 & 2033
- Figure 6: North America Application Virtualization Solution Revenue (undefined), by Country 2025 & 2033
- Figure 7: North America Application Virtualization Solution Revenue Share (%), by Country 2025 & 2033
- Figure 8: South America Application Virtualization Solution Revenue (undefined), by Application 2025 & 2033
- Figure 9: South America Application Virtualization Solution Revenue Share (%), by Application 2025 & 2033
- Figure 10: South America Application Virtualization Solution Revenue (undefined), by Types 2025 & 2033
- Figure 11: South America Application Virtualization Solution Revenue Share (%), by Types 2025 & 2033
- Figure 12: South America Application Virtualization Solution Revenue (undefined), by Country 2025 & 2033
- Figure 13: South America Application Virtualization Solution Revenue Share (%), by Country 2025 & 2033
- Figure 14: Europe Application Virtualization Solution Revenue (undefined), by Application 2025 & 2033
- Figure 15: Europe Application Virtualization Solution Revenue Share (%), by Application 2025 & 2033
- Figure 16: Europe Application Virtualization Solution Revenue (undefined), by Types 2025 & 2033
- Figure 17: Europe Application Virtualization Solution Revenue Share (%), by Types 2025 & 2033
- Figure 18: Europe Application Virtualization Solution Revenue (undefined), by Country 2025 & 2033
- Figure 19: Europe Application Virtualization Solution Revenue Share (%), by Country 2025 & 2033
- Figure 20: Middle East & Africa Application Virtualization Solution Revenue (undefined), by Application 2025 & 2033
- Figure 21: Middle East & Africa Application Virtualization Solution Revenue Share (%), by Application 2025 & 2033
- Figure 22: Middle East & Africa Application Virtualization Solution Revenue (undefined), by Types 2025 & 2033
- Figure 23: Middle East & Africa Application Virtualization Solution Revenue Share (%), by Types 2025 & 2033
- Figure 24: Middle East & Africa Application Virtualization Solution Revenue (undefined), by Country 2025 & 2033
- Figure 25: Middle East & Africa Application Virtualization Solution Revenue Share (%), by Country 2025 & 2033
- Figure 26: Asia Pacific Application Virtualization Solution Revenue (undefined), by Application 2025 & 2033
- Figure 27: Asia Pacific Application Virtualization Solution Revenue Share (%), by Application 2025 & 2033
- Figure 28: Asia Pacific Application Virtualization Solution Revenue (undefined), by Types 2025 & 2033
- Figure 29: Asia Pacific Application Virtualization Solution Revenue Share (%), by Types 2025 & 2033
- Figure 30: Asia Pacific Application Virtualization Solution Revenue (undefined), by Country 2025 & 2033
- Figure 31: Asia Pacific Application Virtualization Solution Revenue Share (%), by Country 2025 & 2033
List of Tables
- Table 1: Global Application Virtualization Solution Revenue undefined Forecast, by Application 2020 & 2033
- Table 2: Global Application Virtualization Solution Revenue undefined Forecast, by Types 2020 & 2033
- Table 3: Global Application Virtualization Solution Revenue undefined Forecast, by Region 2020 & 2033
- Table 4: Global Application Virtualization Solution Revenue undefined Forecast, by Application 2020 & 2033
- Table 5: Global Application Virtualization Solution Revenue undefined Forecast, by Types 2020 & 2033
- Table 6: Global Application Virtualization Solution Revenue undefined Forecast, by Country 2020 & 2033
- Table 7: United States Application Virtualization Solution Revenue (undefined) Forecast, by Application 2020 & 2033
- Table 8: Canada Application Virtualization Solution Revenue (undefined) Forecast, by Application 2020 & 2033
- Table 9: Mexico Application Virtualization Solution Revenue (undefined) Forecast, by Application 2020 & 2033
- Table 10: Global Application Virtualization Solution Revenue undefined Forecast, by Application 2020 & 2033
- Table 11: Global Application Virtualization Solution Revenue undefined Forecast, by Types 2020 & 2033
- Table 12: Global Application Virtualization Solution Revenue undefined Forecast, by Country 2020 & 2033
- Table 13: Brazil Application Virtualization Solution Revenue (undefined) Forecast, by Application 2020 & 2033
- Table 14: Argentina Application Virtualization Solution Revenue (undefined) Forecast, by Application 2020 & 2033
- Table 15: Rest of South America Application Virtualization Solution Revenue (undefined) Forecast, by Application 2020 & 2033
- Table 16: Global Application Virtualization Solution Revenue undefined Forecast, by Application 2020 & 2033
- Table 17: Global Application Virtualization Solution Revenue undefined Forecast, by Types 2020 & 2033
- Table 18: Global Application Virtualization Solution Revenue undefined Forecast, by Country 2020 & 2033
- Table 19: United Kingdom Application Virtualization Solution Revenue (undefined) Forecast, by Application 2020 & 2033
- Table 20: Germany Application Virtualization Solution Revenue (undefined) Forecast, by Application 2020 & 2033
- Table 21: France Application Virtualization Solution Revenue (undefined) Forecast, by Application 2020 & 2033
- Table 22: Italy Application Virtualization Solution Revenue (undefined) Forecast, by Application 2020 & 2033
- Table 23: Spain Application Virtualization Solution Revenue (undefined) Forecast, by Application 2020 & 2033
- Table 24: Russia Application Virtualization Solution Revenue (undefined) Forecast, by Application 2020 & 2033
- Table 25: Benelux Application Virtualization Solution Revenue (undefined) Forecast, by Application 2020 & 2033
- Table 26: Nordics Application Virtualization Solution Revenue (undefined) Forecast, by Application 2020 & 2033
- Table 27: Rest of Europe Application Virtualization Solution Revenue (undefined) Forecast, by Application 2020 & 2033
- Table 28: Global Application Virtualization Solution Revenue undefined Forecast, by Application 2020 & 2033
- Table 29: Global Application Virtualization Solution Revenue undefined Forecast, by Types 2020 & 2033
- Table 30: Global Application Virtualization Solution Revenue undefined Forecast, by Country 2020 & 2033
- Table 31: Turkey Application Virtualization Solution Revenue (undefined) Forecast, by Application 2020 & 2033
- Table 32: Israel Application Virtualization Solution Revenue (undefined) Forecast, by Application 2020 & 2033
- Table 33: GCC Application Virtualization Solution Revenue (undefined) Forecast, by Application 2020 & 2033
- Table 34: North Africa Application Virtualization Solution Revenue (undefined) Forecast, by Application 2020 & 2033
- Table 35: South Africa Application Virtualization Solution Revenue (undefined) Forecast, by Application 2020 & 2033
- Table 36: Rest of Middle East & Africa Application Virtualization Solution Revenue (undefined) Forecast, by Application 2020 & 2033
- Table 37: Global Application Virtualization Solution Revenue undefined Forecast, by Application 2020 & 2033
- Table 38: Global Application Virtualization Solution Revenue undefined Forecast, by Types 2020 & 2033
- Table 39: Global Application Virtualization Solution Revenue undefined Forecast, by Country 2020 & 2033
- Table 40: China Application Virtualization Solution Revenue (undefined) Forecast, by Application 2020 & 2033
- Table 41: India Application Virtualization Solution Revenue (undefined) Forecast, by Application 2020 & 2033
- Table 42: Japan Application Virtualization Solution Revenue (undefined) Forecast, by Application 2020 & 2033
- Table 43: South Korea Application Virtualization Solution Revenue (undefined) Forecast, by Application 2020 & 2033
- Table 44: ASEAN Application Virtualization Solution Revenue (undefined) Forecast, by Application 2020 & 2033
- Table 45: Oceania Application Virtualization Solution Revenue (undefined) Forecast, by Application 2020 & 2033
- Table 46: Rest of Asia Pacific Application Virtualization Solution Revenue (undefined) Forecast, by Application 2020 & 2033
Frequently Asked Questions
1. What is the projected Compound Annual Growth Rate (CAGR) of the Application Virtualization Solution?
The projected CAGR is approximately 22.3%.
2. Which companies are prominent players in the Application Virtualization Solution?
Key companies in the market include Ceedo Technologies, CloudShare, MicroFoucus, HD2i, Evalaze, Sphere 3D, Next Axiom, Inuvika, Microsoft(Azure), Ncomputing, Nutanix, NVIDIA, PACE Suite, Parallels, Symantec, Vmware, Citrix Systems.
3. What are the main segments of the Application Virtualization Solution?
The market segments include Application, Types.
4. Can you provide details about the market size?
The market size is estimated to be USD XXX N/A as of 2022.
5. What are some drivers contributing to market growth?
N/A
6. What are the notable trends driving market growth?
N/A
7. Are there any restraints impacting market growth?
N/A
8. Can you provide examples of recent developments in the market?
N/A
9. What pricing options are available for accessing the report?
Pricing options include single-user, multi-user, and enterprise licenses priced at USD 2900.00, USD 4350.00, and USD 5800.00 respectively.
10. Is the market size provided in terms of value or volume?
The market size is provided in terms of value, measured in N/A.
11. Are there any specific market keywords associated with the report?
Yes, the market keyword associated with the report is "Application Virtualization Solution," which aids in identifying and referencing the specific market segment covered.
12. How do I determine which pricing option suits my needs best?
The pricing options vary based on user requirements and access needs. Individual users may opt for single-user licenses, while businesses requiring broader access may choose multi-user or enterprise licenses for cost-effective access to the report.
13. Are there any additional resources or data provided in the Application Virtualization Solution report?
While the report offers comprehensive insights, it's advisable to review the specific contents or supplementary materials provided to ascertain if additional resources or data are available.
14. How can I stay updated on further developments or reports in the Application Virtualization Solution?
To stay informed about further developments, trends, and reports in the Application Virtualization Solution, consider subscribing to industry newsletters, following relevant companies and organizations, or regularly checking reputable industry news sources and publications.
Methodology
Step 1 - Identification of Relevant Samples Size from Population Database


Step 2 - Approaches for Defining Global Market Size (Value, Volume* & Price*)

Note*: In applicable scenarios
Step 3 - Data Sources
Primary Research
- Web Analytics
- Survey Reports
- Research Institute
- Latest Research Reports
- Opinion Leaders
Secondary Research
- Annual Reports
- White Paper
- Latest Press Release
- Industry Association
- Paid Database
- Investor Presentations

Step 4 - Data Triangulation
Involves using different sources of information in order to increase the validity of a study
These sources are likely to be stakeholders in a program - participants, other researchers, program staff, other community members, and so on.
Then we put all data in single framework & apply various statistical tools to find out the dynamic on the market.
During the analysis stage, feedback from the stakeholder groups would be compared to determine areas of agreement as well as areas of divergence