
Key Insights
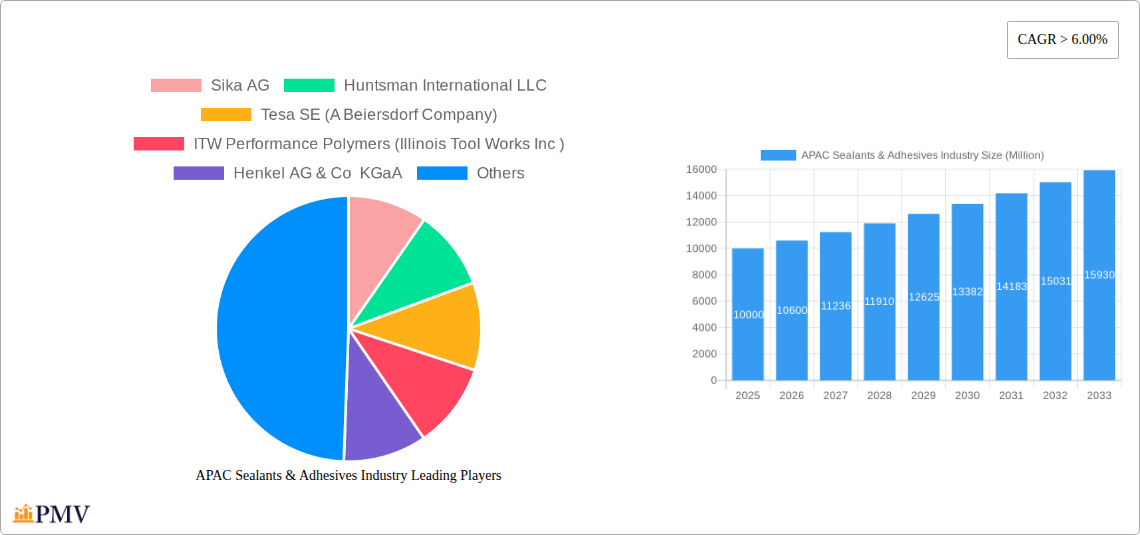
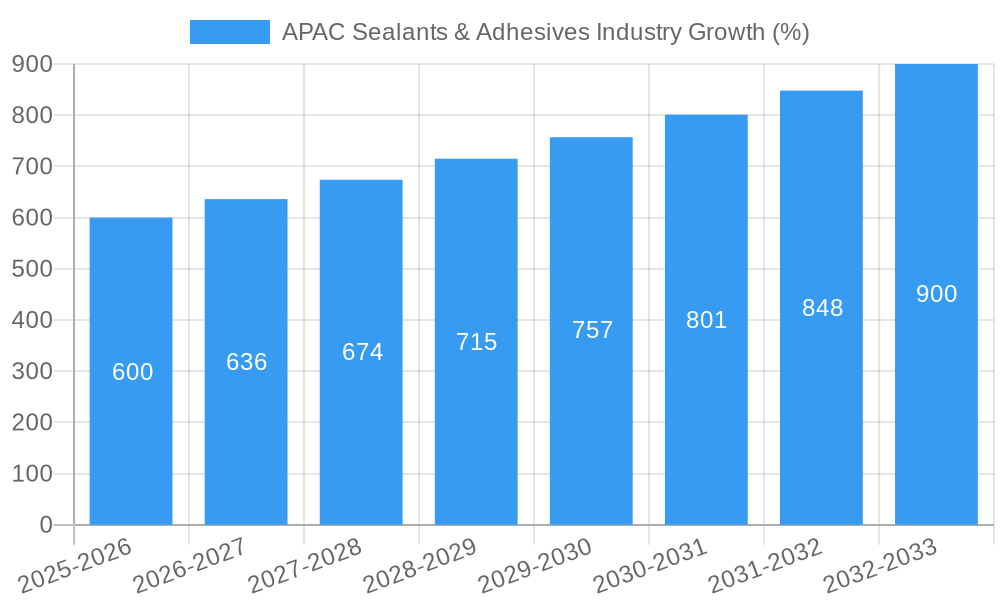
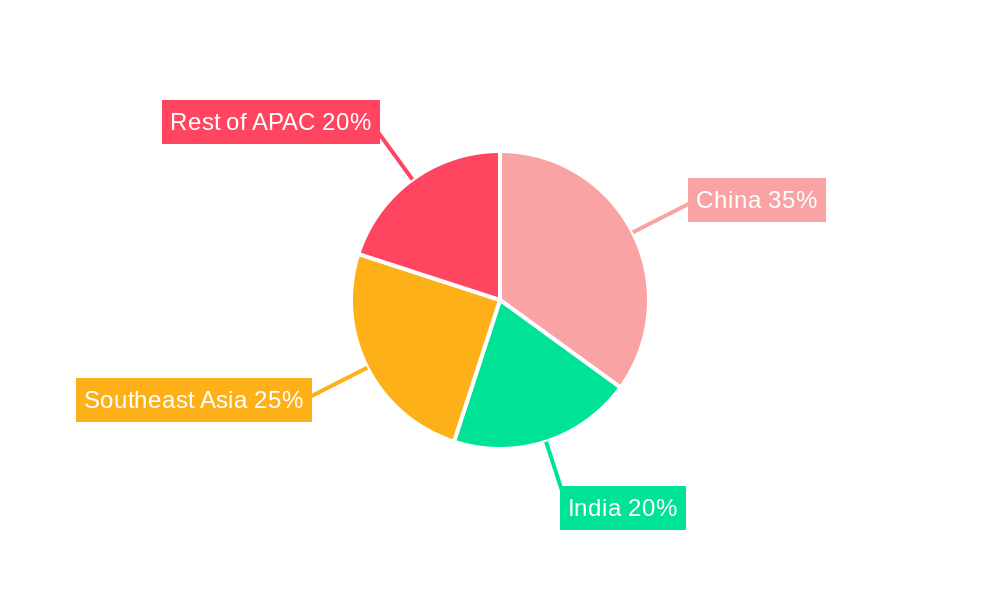
The Asia-Pacific (APAC) sealants and adhesives market presents a compelling investment opportunity, exhibiting robust growth fueled by rapid industrialization, infrastructure development, and a burgeoning construction sector. The region's expanding automotive, packaging, and electronics industries significantly contribute to this market expansion. A compound annual growth rate (CAGR) exceeding 6% suggests a substantial increase in market value over the forecast period (2025-2033). While precise figures for APAC's market share within the global 30.26 million value (in 2025) are unavailable, considering APAC's significant manufacturing output and infrastructure projects, a conservative estimate places its 2025 market size at approximately 10 million. This estimate considers the relatively high growth rates in developing economies within the region. Key drivers include the rising demand for high-performance adhesives in diverse applications, increasing adoption of advanced adhesive technologies (like UV-cured and water-borne adhesives), and government initiatives promoting sustainable construction practices. However, potential restraints include fluctuating raw material prices, stringent environmental regulations, and the competitive landscape characterized by established global players and regional manufacturers. The segment analysis shows significant growth potential in polyurethane and silicone-based sealants and adhesives, particularly within the building and construction, automotive, and packaging sectors. Growth will likely be uneven across the region, with China, India, and Southeast Asia leading the expansion due to their substantial infrastructure projects and manufacturing capacities.
Looking ahead to 2033, the APAC sealants and adhesives market is projected to experience continued expansion, driven by factors such as increasing disposable incomes, urbanization, and technological advancements. The construction industry's sustained growth will be a significant factor, alongside the increasing demand for lightweight and durable materials in automotive and aerospace applications. Companies will need to strategically adapt to evolving consumer preferences and regulatory frameworks while focusing on innovation and sustainable solutions to maintain market competitiveness. A focus on specialized adhesives for niche applications will also be key for growth, such as high-temperature applications in electronics and biocompatible adhesives in the healthcare sector. The increasing awareness of sustainable practices will further drive demand for eco-friendly sealants and adhesives, offering significant opportunities for companies focusing on green technologies.
APAC Sealants & Adhesives Industry: A Comprehensive Market Report (2019-2033)
This in-depth report provides a comprehensive analysis of the Asia-Pacific (APAC) sealants and adhesives industry, offering invaluable insights for businesses, investors, and stakeholders seeking to navigate this dynamic market. The report covers the period from 2019 to 2033, with a focus on 2025 as the base and estimated year. It meticulously examines market structure, competitive dynamics, prevailing trends, and future growth projections, incorporating detailed segmentations and key player analysis.
APAC Sealants & Adhesives Industry Market Structure & Competitive Dynamics
The APAC sealants and adhesives market is characterized by a mix of multinational giants and regional players. Market concentration is moderate, with the top five companies—Sika AG, Huntsman International LLC, Henkel AG & Co KGaA, 3M, and Pidilite Industries Ltd—holding an estimated xx% market share in 2025. However, the presence of numerous smaller players fosters competition, driving innovation and price sensitivity.
The regulatory landscape varies across APAC nations, impacting raw material sourcing and product compliance. Several countries are implementing stricter environmental regulations, favoring the adoption of eco-friendly adhesives and sealants. Product substitution is a significant factor, with increasing demand for high-performance, specialized materials like UV-cured adhesives. M&A activity has been steadily increasing, with deal values exceeding xx Million in 2024. Key examples include [Insert Specific M&A Examples if available, otherwise state "Specific details unavailable"]. End-user trends show a shift towards sustainable and high-performance solutions, particularly in the building and construction sector.
APAC Sealants & Adhesives Industry Industry Trends & Insights
The APAC sealants and adhesives market is experiencing robust growth, with a projected CAGR of xx% during 2025-2033. Key growth drivers include the burgeoning construction industry, particularly in rapidly developing economies, coupled with rising demand from the automotive and packaging sectors. Technological advancements, such as the development of bio-based adhesives and improved curing technologies, are also fueling market expansion. Market penetration of high-performance adhesives like UV-cured and reactive adhesives is steadily increasing, driven by the need for faster processing times and improved durability. Consumer preferences are shifting toward environmentally friendly and sustainable products, creating opportunities for manufacturers to develop and market green sealants and adhesives. However, fluctuating raw material prices and economic uncertainties pose some challenges.
Dominant Markets & Segments in APAC Sealants & Adhesives Industry
Leading Regions/Countries: China and India dominate the APAC sealants and adhesives market, driven by robust infrastructure development, rapid industrialization, and a large population base. Other key markets include South Korea, Japan, and Australia.
Dominant Segments:
- Adhesives Technology: The reactive adhesives segment holds the largest market share, followed by hot melt and water-borne adhesives. High demand from the packaging and construction industries drives this growth.
- Sealants Resin: Silicone sealants are currently the most prevalent type, primarily due to their versatility and durability. Polyurethane sealants show strong growth potential.
- End-User Industry: The building and construction sector remains the largest end-user, accounting for xx% of total market revenue in 2025. The automotive and packaging sectors also contribute significantly.
- Adhesives Resin: Polyurethane and epoxy resins are dominant, driven by strong performance characteristics and versatility in various applications.
Key Drivers:
- Rapid urbanization and infrastructure development: This is significantly boosting demand across all segments.
- Growing automotive and packaging industries: These industries require advanced adhesives and sealants.
- Favorable government policies and economic growth: These factors are driving construction and manufacturing activities.
APAC Sealants & Adhesives Industry Product Innovations
Recent product innovations focus on developing sustainable, high-performance, and specialized adhesives and sealants catering to various niche applications. This includes bio-based adhesives, eco-friendly sealants, and advanced curing technologies to enhance productivity. These innovations improve product efficacy, address environmental concerns, and meet growing consumer demand for specialized solutions. For instance, the development of UV-cured adhesives for electronics applications has led to faster assembly times and improved product quality.
Report Segmentation & Scope
This report segments the APAC sealants and adhesives market comprehensively based on adhesives technology (solvent-borne, reactive, hot melt, UV cured, water-borne), sealants resin (silicone, polyurethane, acrylic, epoxy, others), end-user industry (aerospace, automotive, building & construction, footwear & leather, healthcare, packaging, woodworking & joinery, others), and adhesives resin (polyurethane, epoxy, acrylic, silicone, cyanoacrylate, VAE/EVA, others). Each segment's growth projections, market size, and competitive landscape are detailed. The projected market size for each segment in 2033 varies significantly, with xx Million in building and construction, xx Million in automotive, and xx Million in packaging expected for example.
Key Drivers of APAC Sealants & Adhesives Industry Growth
The growth of the APAC sealants and adhesives market is driven by several factors. Firstly, rapid urbanization and infrastructure development in many APAC nations create vast demand. Secondly, the expansion of automotive and packaging industries necessitates high-performance adhesives and sealants. Finally, supportive government policies and consistent economic growth foster a conducive business environment.
Challenges in the APAC Sealants & Adhesives Industry Sector
The APAC sealants and adhesives market faces certain challenges. Fluctuating raw material prices significantly impact production costs. Stringent environmental regulations require manufacturers to adopt sustainable practices and formulations. Intense competition and price pressures from regional players also impact profitability.
Leading Players in the APAC Sealants & Adhesives Industry Market
- Sika AG
- Huntsman International LLC
- Tesa SE (A Beiersdorf Company)
- ITW Performance Polymers (Illinois Tool Works Inc)
- Henkel AG & Co KGaA
- Pidilite Industries Ltd
- Beardow Adams
- DuPont
- Dow
- Arkema
- H B Fuller Company
- 3M
- Mapei Inc
- Dymax Corporation
- Avery Dennison Corporation
- Wacker Chemie AG
- Jowat AG
- Ashland
- Franklin International
Key Developments in APAC Sealants & Adhesives Industry Sector
- [Year/Month]: [Insert specific development, e.g., Launch of a new bio-based adhesive by Company X]
- [Year/Month]: [Insert specific development, e.g., Merger between Company Y and Company Z]
- [Year/Month]: [Insert specific development, e.g., Introduction of a new solvent-free sealant by Company A]
- (Add more bullet points as needed with specific details)
Strategic APAC Sealants & Adhesives Industry Market Outlook
The APAC sealants and adhesives market presents significant growth opportunities. Continued infrastructure development, rising industrial activity, and the increasing adoption of sustainable products will drive market expansion. Strategic partnerships, product innovation, and expansion into emerging markets are crucial for success in this competitive landscape. Focusing on developing high-performance, specialized products that meet the specific needs of various end-user industries will be vital for achieving competitive advantage.
APAC Sealants & Adhesives Industry Segmentation
-
1. Adhesives Resin
- 1.1. Polyurethane
- 1.2. Epoxy
- 1.3. Acrylic
- 1.4. Silicone
- 1.5. Cyanoacrylate
- 1.6. VAE/EVA
- 1.7. Other Resins (Polyester, Rubber, etc.)
-
2. Adhesives Technology
- 2.1. Solvent-borne
- 2.2. Reactive
- 2.3. Hot Melt
- 2.4. UV Cured Adhesives
- 2.5. Water-borne
-
3. Sealants Resin
- 3.1. Silicone
- 3.2. Polyurethane
- 3.3. Acrylic
- 3.4. Epoxy
- 3.5. Other Re
-
4. End-User Industry
- 4.1. Aerospace
- 4.2. Automotive
- 4.3. Building and Construction
- 4.4. Footwear and Leather
- 4.5. Healthcare
- 4.6. Packaging
- 4.7. Woodworking And Joinery
- 4.8. Other En
-
5. Geography
- 5.1. China
- 5.2. India
- 5.3. Japan
- 5.4. South Korea
- 5.5. Indonesia
- 5.6. Malaysia
- 5.7. Thailand
- 5.8. Vietnam
- 5.9. Rest of Asia-Pacific
APAC Sealants & Adhesives Industry Segmentation By Geography
- 1. China
- 2. India
- 3. Japan
- 4. South Korea
- 5. Indonesia
- 6. Malaysia
- 7. Thailand
- 8. Vietnam
- 9. Rest of Asia Pacific
APAC Sealants & Adhesives Industry REPORT HIGHLIGHTS
| Aspects | Details |
|---|---|
| Study Period | 2019-2033 |
| Base Year | 2024 |
| Estimated Year | 2025 |
| Forecast Period | 2025-2033 |
| Historical Period | 2019-2024 |
| Growth Rate | CAGR of > 6.00% from 2019-2033 |
| Segmentation |
|
Table of Contents
- 1. Introduction
- 1.1. Research Scope
- 1.2. Market Segmentation
- 1.3. Research Methodology
- 1.4. Definitions and Assumptions
- 2. Executive Summary
- 2.1. Introduction
- 3. Market Dynamics
- 3.1. Introduction
- 3.2. Market Drivers
- 3.2.1. Growing Packaging Industry in South-East Asia Countries; Growing Demand in Construction Sector; Other Drivers
- 3.3. Market Restrains
- 3.3.1. Stringent Environmental Regulations Regarding VOC Emissions; High Fluctuations in Raw Material Pricing
- 3.4. Market Trends
- 3.4.1. Packaging Segment to Dominate the Market
- 4. Market Factor Analysis
- 4.1. Porters Five Forces
- 4.2. Supply/Value Chain
- 4.3. PESTEL analysis
- 4.4. Market Entropy
- 4.5. Patent/Trademark Analysis
- 5. Global APAC Sealants & Adhesives Industry Analysis, Insights and Forecast, 2019-2031
- 5.1. Market Analysis, Insights and Forecast - by Adhesives Resin
- 5.1.1. Polyurethane
- 5.1.2. Epoxy
- 5.1.3. Acrylic
- 5.1.4. Silicone
- 5.1.5. Cyanoacrylate
- 5.1.6. VAE/EVA
- 5.1.7. Other Resins (Polyester, Rubber, etc.)
- 5.2. Market Analysis, Insights and Forecast - by Adhesives Technology
- 5.2.1. Solvent-borne
- 5.2.2. Reactive
- 5.2.3. Hot Melt
- 5.2.4. UV Cured Adhesives
- 5.2.5. Water-borne
- 5.3. Market Analysis, Insights and Forecast - by Sealants Resin
- 5.3.1. Silicone
- 5.3.2. Polyurethane
- 5.3.3. Acrylic
- 5.3.4. Epoxy
- 5.3.5. Other Re
- 5.4. Market Analysis, Insights and Forecast - by End-User Industry
- 5.4.1. Aerospace
- 5.4.2. Automotive
- 5.4.3. Building and Construction
- 5.4.4. Footwear and Leather
- 5.4.5. Healthcare
- 5.4.6. Packaging
- 5.4.7. Woodworking And Joinery
- 5.4.8. Other En
- 5.5. Market Analysis, Insights and Forecast - by Geography
- 5.5.1. China
- 5.5.2. India
- 5.5.3. Japan
- 5.5.4. South Korea
- 5.5.5. Indonesia
- 5.5.6. Malaysia
- 5.5.7. Thailand
- 5.5.8. Vietnam
- 5.5.9. Rest of Asia-Pacific
- 5.6. Market Analysis, Insights and Forecast - by Region
- 5.6.1. China
- 5.6.2. India
- 5.6.3. Japan
- 5.6.4. South Korea
- 5.6.5. Indonesia
- 5.6.6. Malaysia
- 5.6.7. Thailand
- 5.6.8. Vietnam
- 5.6.9. Rest of Asia Pacific
- 5.1. Market Analysis, Insights and Forecast - by Adhesives Resin
- 6. China APAC Sealants & Adhesives Industry Analysis, Insights and Forecast, 2019-2031
- 6.1. Market Analysis, Insights and Forecast - by Adhesives Resin
- 6.1.1. Polyurethane
- 6.1.2. Epoxy
- 6.1.3. Acrylic
- 6.1.4. Silicone
- 6.1.5. Cyanoacrylate
- 6.1.6. VAE/EVA
- 6.1.7. Other Resins (Polyester, Rubber, etc.)
- 6.2. Market Analysis, Insights and Forecast - by Adhesives Technology
- 6.2.1. Solvent-borne
- 6.2.2. Reactive
- 6.2.3. Hot Melt
- 6.2.4. UV Cured Adhesives
- 6.2.5. Water-borne
- 6.3. Market Analysis, Insights and Forecast - by Sealants Resin
- 6.3.1. Silicone
- 6.3.2. Polyurethane
- 6.3.3. Acrylic
- 6.3.4. Epoxy
- 6.3.5. Other Re
- 6.4. Market Analysis, Insights and Forecast - by End-User Industry
- 6.4.1. Aerospace
- 6.4.2. Automotive
- 6.4.3. Building and Construction
- 6.4.4. Footwear and Leather
- 6.4.5. Healthcare
- 6.4.6. Packaging
- 6.4.7. Woodworking And Joinery
- 6.4.8. Other En
- 6.5. Market Analysis, Insights and Forecast - by Geography
- 6.5.1. China
- 6.5.2. India
- 6.5.3. Japan
- 6.5.4. South Korea
- 6.5.5. Indonesia
- 6.5.6. Malaysia
- 6.5.7. Thailand
- 6.5.8. Vietnam
- 6.5.9. Rest of Asia-Pacific
- 6.1. Market Analysis, Insights and Forecast - by Adhesives Resin
- 7. India APAC Sealants & Adhesives Industry Analysis, Insights and Forecast, 2019-2031
- 7.1. Market Analysis, Insights and Forecast - by Adhesives Resin
- 7.1.1. Polyurethane
- 7.1.2. Epoxy
- 7.1.3. Acrylic
- 7.1.4. Silicone
- 7.1.5. Cyanoacrylate
- 7.1.6. VAE/EVA
- 7.1.7. Other Resins (Polyester, Rubber, etc.)
- 7.2. Market Analysis, Insights and Forecast - by Adhesives Technology
- 7.2.1. Solvent-borne
- 7.2.2. Reactive
- 7.2.3. Hot Melt
- 7.2.4. UV Cured Adhesives
- 7.2.5. Water-borne
- 7.3. Market Analysis, Insights and Forecast - by Sealants Resin
- 7.3.1. Silicone
- 7.3.2. Polyurethane
- 7.3.3. Acrylic
- 7.3.4. Epoxy
- 7.3.5. Other Re
- 7.4. Market Analysis, Insights and Forecast - by End-User Industry
- 7.4.1. Aerospace
- 7.4.2. Automotive
- 7.4.3. Building and Construction
- 7.4.4. Footwear and Leather
- 7.4.5. Healthcare
- 7.4.6. Packaging
- 7.4.7. Woodworking And Joinery
- 7.4.8. Other En
- 7.5. Market Analysis, Insights and Forecast - by Geography
- 7.5.1. China
- 7.5.2. India
- 7.5.3. Japan
- 7.5.4. South Korea
- 7.5.5. Indonesia
- 7.5.6. Malaysia
- 7.5.7. Thailand
- 7.5.8. Vietnam
- 7.5.9. Rest of Asia-Pacific
- 7.1. Market Analysis, Insights and Forecast - by Adhesives Resin
- 8. Japan APAC Sealants & Adhesives Industry Analysis, Insights and Forecast, 2019-2031
- 8.1. Market Analysis, Insights and Forecast - by Adhesives Resin
- 8.1.1. Polyurethane
- 8.1.2. Epoxy
- 8.1.3. Acrylic
- 8.1.4. Silicone
- 8.1.5. Cyanoacrylate
- 8.1.6. VAE/EVA
- 8.1.7. Other Resins (Polyester, Rubber, etc.)
- 8.2. Market Analysis, Insights and Forecast - by Adhesives Technology
- 8.2.1. Solvent-borne
- 8.2.2. Reactive
- 8.2.3. Hot Melt
- 8.2.4. UV Cured Adhesives
- 8.2.5. Water-borne
- 8.3. Market Analysis, Insights and Forecast - by Sealants Resin
- 8.3.1. Silicone
- 8.3.2. Polyurethane
- 8.3.3. Acrylic
- 8.3.4. Epoxy
- 8.3.5. Other Re
- 8.4. Market Analysis, Insights and Forecast - by End-User Industry
- 8.4.1. Aerospace
- 8.4.2. Automotive
- 8.4.3. Building and Construction
- 8.4.4. Footwear and Leather
- 8.4.5. Healthcare
- 8.4.6. Packaging
- 8.4.7. Woodworking And Joinery
- 8.4.8. Other En
- 8.5. Market Analysis, Insights and Forecast - by Geography
- 8.5.1. China
- 8.5.2. India
- 8.5.3. Japan
- 8.5.4. South Korea
- 8.5.5. Indonesia
- 8.5.6. Malaysia
- 8.5.7. Thailand
- 8.5.8. Vietnam
- 8.5.9. Rest of Asia-Pacific
- 8.1. Market Analysis, Insights and Forecast - by Adhesives Resin
- 9. South Korea APAC Sealants & Adhesives Industry Analysis, Insights and Forecast, 2019-2031
- 9.1. Market Analysis, Insights and Forecast - by Adhesives Resin
- 9.1.1. Polyurethane
- 9.1.2. Epoxy
- 9.1.3. Acrylic
- 9.1.4. Silicone
- 9.1.5. Cyanoacrylate
- 9.1.6. VAE/EVA
- 9.1.7. Other Resins (Polyester, Rubber, etc.)
- 9.2. Market Analysis, Insights and Forecast - by Adhesives Technology
- 9.2.1. Solvent-borne
- 9.2.2. Reactive
- 9.2.3. Hot Melt
- 9.2.4. UV Cured Adhesives
- 9.2.5. Water-borne
- 9.3. Market Analysis, Insights and Forecast - by Sealants Resin
- 9.3.1. Silicone
- 9.3.2. Polyurethane
- 9.3.3. Acrylic
- 9.3.4. Epoxy
- 9.3.5. Other Re
- 9.4. Market Analysis, Insights and Forecast - by End-User Industry
- 9.4.1. Aerospace
- 9.4.2. Automotive
- 9.4.3. Building and Construction
- 9.4.4. Footwear and Leather
- 9.4.5. Healthcare
- 9.4.6. Packaging
- 9.4.7. Woodworking And Joinery
- 9.4.8. Other En
- 9.5. Market Analysis, Insights and Forecast - by Geography
- 9.5.1. China
- 9.5.2. India
- 9.5.3. Japan
- 9.5.4. South Korea
- 9.5.5. Indonesia
- 9.5.6. Malaysia
- 9.5.7. Thailand
- 9.5.8. Vietnam
- 9.5.9. Rest of Asia-Pacific
- 9.1. Market Analysis, Insights and Forecast - by Adhesives Resin
- 10. Indonesia APAC Sealants & Adhesives Industry Analysis, Insights and Forecast, 2019-2031
- 10.1. Market Analysis, Insights and Forecast - by Adhesives Resin
- 10.1.1. Polyurethane
- 10.1.2. Epoxy
- 10.1.3. Acrylic
- 10.1.4. Silicone
- 10.1.5. Cyanoacrylate
- 10.1.6. VAE/EVA
- 10.1.7. Other Resins (Polyester, Rubber, etc.)
- 10.2. Market Analysis, Insights and Forecast - by Adhesives Technology
- 10.2.1. Solvent-borne
- 10.2.2. Reactive
- 10.2.3. Hot Melt
- 10.2.4. UV Cured Adhesives
- 10.2.5. Water-borne
- 10.3. Market Analysis, Insights and Forecast - by Sealants Resin
- 10.3.1. Silicone
- 10.3.2. Polyurethane
- 10.3.3. Acrylic
- 10.3.4. Epoxy
- 10.3.5. Other Re
- 10.4. Market Analysis, Insights and Forecast - by End-User Industry
- 10.4.1. Aerospace
- 10.4.2. Automotive
- 10.4.3. Building and Construction
- 10.4.4. Footwear and Leather
- 10.4.5. Healthcare
- 10.4.6. Packaging
- 10.4.7. Woodworking And Joinery
- 10.4.8. Other En
- 10.5. Market Analysis, Insights and Forecast - by Geography
- 10.5.1. China
- 10.5.2. India
- 10.5.3. Japan
- 10.5.4. South Korea
- 10.5.5. Indonesia
- 10.5.6. Malaysia
- 10.5.7. Thailand
- 10.5.8. Vietnam
- 10.5.9. Rest of Asia-Pacific
- 10.1. Market Analysis, Insights and Forecast - by Adhesives Resin
- 11. Malaysia APAC Sealants & Adhesives Industry Analysis, Insights and Forecast, 2019-2031
- 11.1. Market Analysis, Insights and Forecast - by Adhesives Resin
- 11.1.1. Polyurethane
- 11.1.2. Epoxy
- 11.1.3. Acrylic
- 11.1.4. Silicone
- 11.1.5. Cyanoacrylate
- 11.1.6. VAE/EVA
- 11.1.7. Other Resins (Polyester, Rubber, etc.)
- 11.2. Market Analysis, Insights and Forecast - by Adhesives Technology
- 11.2.1. Solvent-borne
- 11.2.2. Reactive
- 11.2.3. Hot Melt
- 11.2.4. UV Cured Adhesives
- 11.2.5. Water-borne
- 11.3. Market Analysis, Insights and Forecast - by Sealants Resin
- 11.3.1. Silicone
- 11.3.2. Polyurethane
- 11.3.3. Acrylic
- 11.3.4. Epoxy
- 11.3.5. Other Re
- 11.4. Market Analysis, Insights and Forecast - by End-User Industry
- 11.4.1. Aerospace
- 11.4.2. Automotive
- 11.4.3. Building and Construction
- 11.4.4. Footwear and Leather
- 11.4.5. Healthcare
- 11.4.6. Packaging
- 11.4.7. Woodworking And Joinery
- 11.4.8. Other En
- 11.5. Market Analysis, Insights and Forecast - by Geography
- 11.5.1. China
- 11.5.2. India
- 11.5.3. Japan
- 11.5.4. South Korea
- 11.5.5. Indonesia
- 11.5.6. Malaysia
- 11.5.7. Thailand
- 11.5.8. Vietnam
- 11.5.9. Rest of Asia-Pacific
- 11.1. Market Analysis, Insights and Forecast - by Adhesives Resin
- 12. Thailand APAC Sealants & Adhesives Industry Analysis, Insights and Forecast, 2019-2031
- 12.1. Market Analysis, Insights and Forecast - by Adhesives Resin
- 12.1.1. Polyurethane
- 12.1.2. Epoxy
- 12.1.3. Acrylic
- 12.1.4. Silicone
- 12.1.5. Cyanoacrylate
- 12.1.6. VAE/EVA
- 12.1.7. Other Resins (Polyester, Rubber, etc.)
- 12.2. Market Analysis, Insights and Forecast - by Adhesives Technology
- 12.2.1. Solvent-borne
- 12.2.2. Reactive
- 12.2.3. Hot Melt
- 12.2.4. UV Cured Adhesives
- 12.2.5. Water-borne
- 12.3. Market Analysis, Insights and Forecast - by Sealants Resin
- 12.3.1. Silicone
- 12.3.2. Polyurethane
- 12.3.3. Acrylic
- 12.3.4. Epoxy
- 12.3.5. Other Re
- 12.4. Market Analysis, Insights and Forecast - by End-User Industry
- 12.4.1. Aerospace
- 12.4.2. Automotive
- 12.4.3. Building and Construction
- 12.4.4. Footwear and Leather
- 12.4.5. Healthcare
- 12.4.6. Packaging
- 12.4.7. Woodworking And Joinery
- 12.4.8. Other En
- 12.5. Market Analysis, Insights and Forecast - by Geography
- 12.5.1. China
- 12.5.2. India
- 12.5.3. Japan
- 12.5.4. South Korea
- 12.5.5. Indonesia
- 12.5.6. Malaysia
- 12.5.7. Thailand
- 12.5.8. Vietnam
- 12.5.9. Rest of Asia-Pacific
- 12.1. Market Analysis, Insights and Forecast - by Adhesives Resin
- 13. Vietnam APAC Sealants & Adhesives Industry Analysis, Insights and Forecast, 2019-2031
- 13.1. Market Analysis, Insights and Forecast - by Adhesives Resin
- 13.1.1. Polyurethane
- 13.1.2. Epoxy
- 13.1.3. Acrylic
- 13.1.4. Silicone
- 13.1.5. Cyanoacrylate
- 13.1.6. VAE/EVA
- 13.1.7. Other Resins (Polyester, Rubber, etc.)
- 13.2. Market Analysis, Insights and Forecast - by Adhesives Technology
- 13.2.1. Solvent-borne
- 13.2.2. Reactive
- 13.2.3. Hot Melt
- 13.2.4. UV Cured Adhesives
- 13.2.5. Water-borne
- 13.3. Market Analysis, Insights and Forecast - by Sealants Resin
- 13.3.1. Silicone
- 13.3.2. Polyurethane
- 13.3.3. Acrylic
- 13.3.4. Epoxy
- 13.3.5. Other Re
- 13.4. Market Analysis, Insights and Forecast - by End-User Industry
- 13.4.1. Aerospace
- 13.4.2. Automotive
- 13.4.3. Building and Construction
- 13.4.4. Footwear and Leather
- 13.4.5. Healthcare
- 13.4.6. Packaging
- 13.4.7. Woodworking And Joinery
- 13.4.8. Other En
- 13.5. Market Analysis, Insights and Forecast - by Geography
- 13.5.1. China
- 13.5.2. India
- 13.5.3. Japan
- 13.5.4. South Korea
- 13.5.5. Indonesia
- 13.5.6. Malaysia
- 13.5.7. Thailand
- 13.5.8. Vietnam
- 13.5.9. Rest of Asia-Pacific
- 13.1. Market Analysis, Insights and Forecast - by Adhesives Resin
- 14. Rest of Asia Pacific APAC Sealants & Adhesives Industry Analysis, Insights and Forecast, 2019-2031
- 14.1. Market Analysis, Insights and Forecast - by Adhesives Resin
- 14.1.1. Polyurethane
- 14.1.2. Epoxy
- 14.1.3. Acrylic
- 14.1.4. Silicone
- 14.1.5. Cyanoacrylate
- 14.1.6. VAE/EVA
- 14.1.7. Other Resins (Polyester, Rubber, etc.)
- 14.2. Market Analysis, Insights and Forecast - by Adhesives Technology
- 14.2.1. Solvent-borne
- 14.2.2. Reactive
- 14.2.3. Hot Melt
- 14.2.4. UV Cured Adhesives
- 14.2.5. Water-borne
- 14.3. Market Analysis, Insights and Forecast - by Sealants Resin
- 14.3.1. Silicone
- 14.3.2. Polyurethane
- 14.3.3. Acrylic
- 14.3.4. Epoxy
- 14.3.5. Other Re
- 14.4. Market Analysis, Insights and Forecast - by End-User Industry
- 14.4.1. Aerospace
- 14.4.2. Automotive
- 14.4.3. Building and Construction
- 14.4.4. Footwear and Leather
- 14.4.5. Healthcare
- 14.4.6. Packaging
- 14.4.7. Woodworking And Joinery
- 14.4.8. Other En
- 14.5. Market Analysis, Insights and Forecast - by Geography
- 14.5.1. China
- 14.5.2. India
- 14.5.3. Japan
- 14.5.4. South Korea
- 14.5.5. Indonesia
- 14.5.6. Malaysia
- 14.5.7. Thailand
- 14.5.8. Vietnam
- 14.5.9. Rest of Asia-Pacific
- 14.1. Market Analysis, Insights and Forecast - by Adhesives Resin
- 15. North America APAC Sealants & Adhesives Industry Analysis, Insights and Forecast, 2019-2031
- 15.1. Market Analysis, Insights and Forecast - By Country/Sub-region
- 15.1.1 United States
- 15.1.2 Canada
- 15.1.3 Mexico
- 16. Europe APAC Sealants & Adhesives Industry Analysis, Insights and Forecast, 2019-2031
- 16.1. Market Analysis, Insights and Forecast - By Country/Sub-region
- 16.1.1 Germany
- 16.1.2 United Kingdom
- 16.1.3 France
- 16.1.4 Spain
- 16.1.5 Italy
- 16.1.6 Spain
- 16.1.7 Belgium
- 16.1.8 Netherland
- 16.1.9 Nordics
- 16.1.10 Rest of Europe
- 17. Asia Pacific APAC Sealants & Adhesives Industry Analysis, Insights and Forecast, 2019-2031
- 17.1. Market Analysis, Insights and Forecast - By Country/Sub-region
- 17.1.1 China
- 17.1.2 Japan
- 17.1.3 India
- 17.1.4 South Korea
- 17.1.5 Southeast Asia
- 17.1.6 Australia
- 17.1.7 Indonesia
- 17.1.8 Phillipes
- 17.1.9 Singapore
- 17.1.10 Thailandc
- 17.1.11 Rest of Asia Pacific
- 18. South America APAC Sealants & Adhesives Industry Analysis, Insights and Forecast, 2019-2031
- 18.1. Market Analysis, Insights and Forecast - By Country/Sub-region
- 18.1.1 Brazil
- 18.1.2 Argentina
- 18.1.3 Peru
- 18.1.4 Chile
- 18.1.5 Colombia
- 18.1.6 Ecuador
- 18.1.7 Venezuela
- 18.1.8 Rest of South America
- 19. North America APAC Sealants & Adhesives Industry Analysis, Insights and Forecast, 2019-2031
- 19.1. Market Analysis, Insights and Forecast - By Country/Sub-region
- 19.1.1 United States
- 19.1.2 Canada
- 19.1.3 Mexico
- 20. MEA APAC Sealants & Adhesives Industry Analysis, Insights and Forecast, 2019-2031
- 20.1. Market Analysis, Insights and Forecast - By Country/Sub-region
- 20.1.1 United Arab Emirates
- 20.1.2 Saudi Arabia
- 20.1.3 South Africa
- 20.1.4 Rest of Middle East and Africa
- 21. Competitive Analysis
- 21.1. Global Market Share Analysis 2024
- 21.2. Company Profiles
- 21.2.1 Sika AG
- 21.2.1.1. Overview
- 21.2.1.2. Products
- 21.2.1.3. SWOT Analysis
- 21.2.1.4. Recent Developments
- 21.2.1.5. Financials (Based on Availability)
- 21.2.2 Huntsman International LLC
- 21.2.2.1. Overview
- 21.2.2.2. Products
- 21.2.2.3. SWOT Analysis
- 21.2.2.4. Recent Developments
- 21.2.2.5. Financials (Based on Availability)
- 21.2.3 Tesa SE (A Beiersdorf Company)
- 21.2.3.1. Overview
- 21.2.3.2. Products
- 21.2.3.3. SWOT Analysis
- 21.2.3.4. Recent Developments
- 21.2.3.5. Financials (Based on Availability)
- 21.2.4 ITW Performance Polymers (Illinois Tool Works Inc )
- 21.2.4.1. Overview
- 21.2.4.2. Products
- 21.2.4.3. SWOT Analysis
- 21.2.4.4. Recent Developments
- 21.2.4.5. Financials (Based on Availability)
- 21.2.5 Henkel AG & Co KGaA
- 21.2.5.1. Overview
- 21.2.5.2. Products
- 21.2.5.3. SWOT Analysis
- 21.2.5.4. Recent Developments
- 21.2.5.5. Financials (Based on Availability)
- 21.2.6 Pidilite Industries Ltd
- 21.2.6.1. Overview
- 21.2.6.2. Products
- 21.2.6.3. SWOT Analysis
- 21.2.6.4. Recent Developments
- 21.2.6.5. Financials (Based on Availability)
- 21.2.7 Beardow Adams
- 21.2.7.1. Overview
- 21.2.7.2. Products
- 21.2.7.3. SWOT Analysis
- 21.2.7.4. Recent Developments
- 21.2.7.5. Financials (Based on Availability)
- 21.2.8 DuPont
- 21.2.8.1. Overview
- 21.2.8.2. Products
- 21.2.8.3. SWOT Analysis
- 21.2.8.4. Recent Developments
- 21.2.8.5. Financials (Based on Availability)
- 21.2.9 Dow
- 21.2.9.1. Overview
- 21.2.9.2. Products
- 21.2.9.3. SWOT Analysis
- 21.2.9.4. Recent Developments
- 21.2.9.5. Financials (Based on Availability)
- 21.2.10 Arkema
- 21.2.10.1. Overview
- 21.2.10.2. Products
- 21.2.10.3. SWOT Analysis
- 21.2.10.4. Recent Developments
- 21.2.10.5. Financials (Based on Availability)
- 21.2.11 H B Fuller Company
- 21.2.11.1. Overview
- 21.2.11.2. Products
- 21.2.11.3. SWOT Analysis
- 21.2.11.4. Recent Developments
- 21.2.11.5. Financials (Based on Availability)
- 21.2.12 3M
- 21.2.12.1. Overview
- 21.2.12.2. Products
- 21.2.12.3. SWOT Analysis
- 21.2.12.4. Recent Developments
- 21.2.12.5. Financials (Based on Availability)
- 21.2.13 Mapei Inc
- 21.2.13.1. Overview
- 21.2.13.2. Products
- 21.2.13.3. SWOT Analysis
- 21.2.13.4. Recent Developments
- 21.2.13.5. Financials (Based on Availability)
- 21.2.14 Dymax Corporation
- 21.2.14.1. Overview
- 21.2.14.2. Products
- 21.2.14.3. SWOT Analysis
- 21.2.14.4. Recent Developments
- 21.2.14.5. Financials (Based on Availability)
- 21.2.15 Avery Dennison Corporation
- 21.2.15.1. Overview
- 21.2.15.2. Products
- 21.2.15.3. SWOT Analysis
- 21.2.15.4. Recent Developments
- 21.2.15.5. Financials (Based on Availability)
- 21.2.16 Wacker Chemie AG*List Not Exhaustive
- 21.2.16.1. Overview
- 21.2.16.2. Products
- 21.2.16.3. SWOT Analysis
- 21.2.16.4. Recent Developments
- 21.2.16.5. Financials (Based on Availability)
- 21.2.17 Jowat AG
- 21.2.17.1. Overview
- 21.2.17.2. Products
- 21.2.17.3. SWOT Analysis
- 21.2.17.4. Recent Developments
- 21.2.17.5. Financials (Based on Availability)
- 21.2.18 Ashland
- 21.2.18.1. Overview
- 21.2.18.2. Products
- 21.2.18.3. SWOT Analysis
- 21.2.18.4. Recent Developments
- 21.2.18.5. Financials (Based on Availability)
- 21.2.19 Franklin International
- 21.2.19.1. Overview
- 21.2.19.2. Products
- 21.2.19.3. SWOT Analysis
- 21.2.19.4. Recent Developments
- 21.2.19.5. Financials (Based on Availability)
- 21.2.1 Sika AG
List of Figures
- Figure 1: Global APAC Sealants & Adhesives Industry Revenue Breakdown (Million, %) by Region 2024 & 2032
- Figure 2: North America APAC Sealants & Adhesives Industry Revenue (Million), by Country 2024 & 2032
- Figure 3: North America APAC Sealants & Adhesives Industry Revenue Share (%), by Country 2024 & 2032
- Figure 4: Europe APAC Sealants & Adhesives Industry Revenue (Million), by Country 2024 & 2032
- Figure 5: Europe APAC Sealants & Adhesives Industry Revenue Share (%), by Country 2024 & 2032
- Figure 6: Asia Pacific APAC Sealants & Adhesives Industry Revenue (Million), by Country 2024 & 2032
- Figure 7: Asia Pacific APAC Sealants & Adhesives Industry Revenue Share (%), by Country 2024 & 2032
- Figure 8: South America APAC Sealants & Adhesives Industry Revenue (Million), by Country 2024 & 2032
- Figure 9: South America APAC Sealants & Adhesives Industry Revenue Share (%), by Country 2024 & 2032
- Figure 10: North America APAC Sealants & Adhesives Industry Revenue (Million), by Country 2024 & 2032
- Figure 11: North America APAC Sealants & Adhesives Industry Revenue Share (%), by Country 2024 & 2032
- Figure 12: MEA APAC Sealants & Adhesives Industry Revenue (Million), by Country 2024 & 2032
- Figure 13: MEA APAC Sealants & Adhesives Industry Revenue Share (%), by Country 2024 & 2032
- Figure 14: China APAC Sealants & Adhesives Industry Revenue (Million), by Adhesives Resin 2024 & 2032
- Figure 15: China APAC Sealants & Adhesives Industry Revenue Share (%), by Adhesives Resin 2024 & 2032
- Figure 16: China APAC Sealants & Adhesives Industry Revenue (Million), by Adhesives Technology 2024 & 2032
- Figure 17: China APAC Sealants & Adhesives Industry Revenue Share (%), by Adhesives Technology 2024 & 2032
- Figure 18: China APAC Sealants & Adhesives Industry Revenue (Million), by Sealants Resin 2024 & 2032
- Figure 19: China APAC Sealants & Adhesives Industry Revenue Share (%), by Sealants Resin 2024 & 2032
- Figure 20: China APAC Sealants & Adhesives Industry Revenue (Million), by End-User Industry 2024 & 2032
- Figure 21: China APAC Sealants & Adhesives Industry Revenue Share (%), by End-User Industry 2024 & 2032
- Figure 22: China APAC Sealants & Adhesives Industry Revenue (Million), by Geography 2024 & 2032
- Figure 23: China APAC Sealants & Adhesives Industry Revenue Share (%), by Geography 2024 & 2032
- Figure 24: China APAC Sealants & Adhesives Industry Revenue (Million), by Country 2024 & 2032
- Figure 25: China APAC Sealants & Adhesives Industry Revenue Share (%), by Country 2024 & 2032
- Figure 26: India APAC Sealants & Adhesives Industry Revenue (Million), by Adhesives Resin 2024 & 2032
- Figure 27: India APAC Sealants & Adhesives Industry Revenue Share (%), by Adhesives Resin 2024 & 2032
- Figure 28: India APAC Sealants & Adhesives Industry Revenue (Million), by Adhesives Technology 2024 & 2032
- Figure 29: India APAC Sealants & Adhesives Industry Revenue Share (%), by Adhesives Technology 2024 & 2032
- Figure 30: India APAC Sealants & Adhesives Industry Revenue (Million), by Sealants Resin 2024 & 2032
- Figure 31: India APAC Sealants & Adhesives Industry Revenue Share (%), by Sealants Resin 2024 & 2032
- Figure 32: India APAC Sealants & Adhesives Industry Revenue (Million), by End-User Industry 2024 & 2032
- Figure 33: India APAC Sealants & Adhesives Industry Revenue Share (%), by End-User Industry 2024 & 2032
- Figure 34: India APAC Sealants & Adhesives Industry Revenue (Million), by Geography 2024 & 2032
- Figure 35: India APAC Sealants & Adhesives Industry Revenue Share (%), by Geography 2024 & 2032
- Figure 36: India APAC Sealants & Adhesives Industry Revenue (Million), by Country 2024 & 2032
- Figure 37: India APAC Sealants & Adhesives Industry Revenue Share (%), by Country 2024 & 2032
- Figure 38: Japan APAC Sealants & Adhesives Industry Revenue (Million), by Adhesives Resin 2024 & 2032
- Figure 39: Japan APAC Sealants & Adhesives Industry Revenue Share (%), by Adhesives Resin 2024 & 2032
- Figure 40: Japan APAC Sealants & Adhesives Industry Revenue (Million), by Adhesives Technology 2024 & 2032
- Figure 41: Japan APAC Sealants & Adhesives Industry Revenue Share (%), by Adhesives Technology 2024 & 2032
- Figure 42: Japan APAC Sealants & Adhesives Industry Revenue (Million), by Sealants Resin 2024 & 2032
- Figure 43: Japan APAC Sealants & Adhesives Industry Revenue Share (%), by Sealants Resin 2024 & 2032
- Figure 44: Japan APAC Sealants & Adhesives Industry Revenue (Million), by End-User Industry 2024 & 2032
- Figure 45: Japan APAC Sealants & Adhesives Industry Revenue Share (%), by End-User Industry 2024 & 2032
- Figure 46: Japan APAC Sealants & Adhesives Industry Revenue (Million), by Geography 2024 & 2032
- Figure 47: Japan APAC Sealants & Adhesives Industry Revenue Share (%), by Geography 2024 & 2032
- Figure 48: Japan APAC Sealants & Adhesives Industry Revenue (Million), by Country 2024 & 2032
- Figure 49: Japan APAC Sealants & Adhesives Industry Revenue Share (%), by Country 2024 & 2032
- Figure 50: South Korea APAC Sealants & Adhesives Industry Revenue (Million), by Adhesives Resin 2024 & 2032
- Figure 51: South Korea APAC Sealants & Adhesives Industry Revenue Share (%), by Adhesives Resin 2024 & 2032
- Figure 52: South Korea APAC Sealants & Adhesives Industry Revenue (Million), by Adhesives Technology 2024 & 2032
- Figure 53: South Korea APAC Sealants & Adhesives Industry Revenue Share (%), by Adhesives Technology 2024 & 2032
- Figure 54: South Korea APAC Sealants & Adhesives Industry Revenue (Million), by Sealants Resin 2024 & 2032
- Figure 55: South Korea APAC Sealants & Adhesives Industry Revenue Share (%), by Sealants Resin 2024 & 2032
- Figure 56: South Korea APAC Sealants & Adhesives Industry Revenue (Million), by End-User Industry 2024 & 2032
- Figure 57: South Korea APAC Sealants & Adhesives Industry Revenue Share (%), by End-User Industry 2024 & 2032
- Figure 58: South Korea APAC Sealants & Adhesives Industry Revenue (Million), by Geography 2024 & 2032
- Figure 59: South Korea APAC Sealants & Adhesives Industry Revenue Share (%), by Geography 2024 & 2032
- Figure 60: South Korea APAC Sealants & Adhesives Industry Revenue (Million), by Country 2024 & 2032
- Figure 61: South Korea APAC Sealants & Adhesives Industry Revenue Share (%), by Country 2024 & 2032
- Figure 62: Indonesia APAC Sealants & Adhesives Industry Revenue (Million), by Adhesives Resin 2024 & 2032
- Figure 63: Indonesia APAC Sealants & Adhesives Industry Revenue Share (%), by Adhesives Resin 2024 & 2032
- Figure 64: Indonesia APAC Sealants & Adhesives Industry Revenue (Million), by Adhesives Technology 2024 & 2032
- Figure 65: Indonesia APAC Sealants & Adhesives Industry Revenue Share (%), by Adhesives Technology 2024 & 2032
- Figure 66: Indonesia APAC Sealants & Adhesives Industry Revenue (Million), by Sealants Resin 2024 & 2032
- Figure 67: Indonesia APAC Sealants & Adhesives Industry Revenue Share (%), by Sealants Resin 2024 & 2032
- Figure 68: Indonesia APAC Sealants & Adhesives Industry Revenue (Million), by End-User Industry 2024 & 2032
- Figure 69: Indonesia APAC Sealants & Adhesives Industry Revenue Share (%), by End-User Industry 2024 & 2032
- Figure 70: Indonesia APAC Sealants & Adhesives Industry Revenue (Million), by Geography 2024 & 2032
- Figure 71: Indonesia APAC Sealants & Adhesives Industry Revenue Share (%), by Geography 2024 & 2032
- Figure 72: Indonesia APAC Sealants & Adhesives Industry Revenue (Million), by Country 2024 & 2032
- Figure 73: Indonesia APAC Sealants & Adhesives Industry Revenue Share (%), by Country 2024 & 2032
- Figure 74: Malaysia APAC Sealants & Adhesives Industry Revenue (Million), by Adhesives Resin 2024 & 2032
- Figure 75: Malaysia APAC Sealants & Adhesives Industry Revenue Share (%), by Adhesives Resin 2024 & 2032
- Figure 76: Malaysia APAC Sealants & Adhesives Industry Revenue (Million), by Adhesives Technology 2024 & 2032
- Figure 77: Malaysia APAC Sealants & Adhesives Industry Revenue Share (%), by Adhesives Technology 2024 & 2032
- Figure 78: Malaysia APAC Sealants & Adhesives Industry Revenue (Million), by Sealants Resin 2024 & 2032
- Figure 79: Malaysia APAC Sealants & Adhesives Industry Revenue Share (%), by Sealants Resin 2024 & 2032
- Figure 80: Malaysia APAC Sealants & Adhesives Industry Revenue (Million), by End-User Industry 2024 & 2032
- Figure 81: Malaysia APAC Sealants & Adhesives Industry Revenue Share (%), by End-User Industry 2024 & 2032
- Figure 82: Malaysia APAC Sealants & Adhesives Industry Revenue (Million), by Geography 2024 & 2032
- Figure 83: Malaysia APAC Sealants & Adhesives Industry Revenue Share (%), by Geography 2024 & 2032
- Figure 84: Malaysia APAC Sealants & Adhesives Industry Revenue (Million), by Country 2024 & 2032
- Figure 85: Malaysia APAC Sealants & Adhesives Industry Revenue Share (%), by Country 2024 & 2032
- Figure 86: Thailand APAC Sealants & Adhesives Industry Revenue (Million), by Adhesives Resin 2024 & 2032
- Figure 87: Thailand APAC Sealants & Adhesives Industry Revenue Share (%), by Adhesives Resin 2024 & 2032
- Figure 88: Thailand APAC Sealants & Adhesives Industry Revenue (Million), by Adhesives Technology 2024 & 2032
- Figure 89: Thailand APAC Sealants & Adhesives Industry Revenue Share (%), by Adhesives Technology 2024 & 2032
- Figure 90: Thailand APAC Sealants & Adhesives Industry Revenue (Million), by Sealants Resin 2024 & 2032
- Figure 91: Thailand APAC Sealants & Adhesives Industry Revenue Share (%), by Sealants Resin 2024 & 2032
- Figure 92: Thailand APAC Sealants & Adhesives Industry Revenue (Million), by End-User Industry 2024 & 2032
- Figure 93: Thailand APAC Sealants & Adhesives Industry Revenue Share (%), by End-User Industry 2024 & 2032
- Figure 94: Thailand APAC Sealants & Adhesives Industry Revenue (Million), by Geography 2024 & 2032
- Figure 95: Thailand APAC Sealants & Adhesives Industry Revenue Share (%), by Geography 2024 & 2032
- Figure 96: Thailand APAC Sealants & Adhesives Industry Revenue (Million), by Country 2024 & 2032
- Figure 97: Thailand APAC Sealants & Adhesives Industry Revenue Share (%), by Country 2024 & 2032
- Figure 98: Vietnam APAC Sealants & Adhesives Industry Revenue (Million), by Adhesives Resin 2024 & 2032
- Figure 99: Vietnam APAC Sealants & Adhesives Industry Revenue Share (%), by Adhesives Resin 2024 & 2032
- Figure 100: Vietnam APAC Sealants & Adhesives Industry Revenue (Million), by Adhesives Technology 2024 & 2032
- Figure 101: Vietnam APAC Sealants & Adhesives Industry Revenue Share (%), by Adhesives Technology 2024 & 2032
- Figure 102: Vietnam APAC Sealants & Adhesives Industry Revenue (Million), by Sealants Resin 2024 & 2032
- Figure 103: Vietnam APAC Sealants & Adhesives Industry Revenue Share (%), by Sealants Resin 2024 & 2032
- Figure 104: Vietnam APAC Sealants & Adhesives Industry Revenue (Million), by End-User Industry 2024 & 2032
- Figure 105: Vietnam APAC Sealants & Adhesives Industry Revenue Share (%), by End-User Industry 2024 & 2032
- Figure 106: Vietnam APAC Sealants & Adhesives Industry Revenue (Million), by Geography 2024 & 2032
- Figure 107: Vietnam APAC Sealants & Adhesives Industry Revenue Share (%), by Geography 2024 & 2032
- Figure 108: Vietnam APAC Sealants & Adhesives Industry Revenue (Million), by Country 2024 & 2032
- Figure 109: Vietnam APAC Sealants & Adhesives Industry Revenue Share (%), by Country 2024 & 2032
- Figure 110: Rest of Asia Pacific APAC Sealants & Adhesives Industry Revenue (Million), by Adhesives Resin 2024 & 2032
- Figure 111: Rest of Asia Pacific APAC Sealants & Adhesives Industry Revenue Share (%), by Adhesives Resin 2024 & 2032
- Figure 112: Rest of Asia Pacific APAC Sealants & Adhesives Industry Revenue (Million), by Adhesives Technology 2024 & 2032
- Figure 113: Rest of Asia Pacific APAC Sealants & Adhesives Industry Revenue Share (%), by Adhesives Technology 2024 & 2032
- Figure 114: Rest of Asia Pacific APAC Sealants & Adhesives Industry Revenue (Million), by Sealants Resin 2024 & 2032
- Figure 115: Rest of Asia Pacific APAC Sealants & Adhesives Industry Revenue Share (%), by Sealants Resin 2024 & 2032
- Figure 116: Rest of Asia Pacific APAC Sealants & Adhesives Industry Revenue (Million), by End-User Industry 2024 & 2032
- Figure 117: Rest of Asia Pacific APAC Sealants & Adhesives Industry Revenue Share (%), by End-User Industry 2024 & 2032
- Figure 118: Rest of Asia Pacific APAC Sealants & Adhesives Industry Revenue (Million), by Geography 2024 & 2032
- Figure 119: Rest of Asia Pacific APAC Sealants & Adhesives Industry Revenue Share (%), by Geography 2024 & 2032
- Figure 120: Rest of Asia Pacific APAC Sealants & Adhesives Industry Revenue (Million), by Country 2024 & 2032
- Figure 121: Rest of Asia Pacific APAC Sealants & Adhesives Industry Revenue Share (%), by Country 2024 & 2032
List of Tables
- Table 1: Global APAC Sealants & Adhesives Industry Revenue Million Forecast, by Region 2019 & 2032
- Table 2: Global APAC Sealants & Adhesives Industry Revenue Million Forecast, by Adhesives Resin 2019 & 2032
- Table 3: Global APAC Sealants & Adhesives Industry Revenue Million Forecast, by Adhesives Technology 2019 & 2032
- Table 4: Global APAC Sealants & Adhesives Industry Revenue Million Forecast, by Sealants Resin 2019 & 2032
- Table 5: Global APAC Sealants & Adhesives Industry Revenue Million Forecast, by End-User Industry 2019 & 2032
- Table 6: Global APAC Sealants & Adhesives Industry Revenue Million Forecast, by Geography 2019 & 2032
- Table 7: Global APAC Sealants & Adhesives Industry Revenue Million Forecast, by Region 2019 & 2032
- Table 8: Global APAC Sealants & Adhesives Industry Revenue Million Forecast, by Country 2019 & 2032
- Table 9: United States APAC Sealants & Adhesives Industry Revenue (Million) Forecast, by Application 2019 & 2032
- Table 10: Canada APAC Sealants & Adhesives Industry Revenue (Million) Forecast, by Application 2019 & 2032
- Table 11: Mexico APAC Sealants & Adhesives Industry Revenue (Million) Forecast, by Application 2019 & 2032
- Table 12: Global APAC Sealants & Adhesives Industry Revenue Million Forecast, by Country 2019 & 2032
- Table 13: Germany APAC Sealants & Adhesives Industry Revenue (Million) Forecast, by Application 2019 & 2032
- Table 14: United Kingdom APAC Sealants & Adhesives Industry Revenue (Million) Forecast, by Application 2019 & 2032
- Table 15: France APAC Sealants & Adhesives Industry Revenue (Million) Forecast, by Application 2019 & 2032
- Table 16: Spain APAC Sealants & Adhesives Industry Revenue (Million) Forecast, by Application 2019 & 2032
- Table 17: Italy APAC Sealants & Adhesives Industry Revenue (Million) Forecast, by Application 2019 & 2032
- Table 18: Spain APAC Sealants & Adhesives Industry Revenue (Million) Forecast, by Application 2019 & 2032
- Table 19: Belgium APAC Sealants & Adhesives Industry Revenue (Million) Forecast, by Application 2019 & 2032
- Table 20: Netherland APAC Sealants & Adhesives Industry Revenue (Million) Forecast, by Application 2019 & 2032
- Table 21: Nordics APAC Sealants & Adhesives Industry Revenue (Million) Forecast, by Application 2019 & 2032
- Table 22: Rest of Europe APAC Sealants & Adhesives Industry Revenue (Million) Forecast, by Application 2019 & 2032
- Table 23: Global APAC Sealants & Adhesives Industry Revenue Million Forecast, by Country 2019 & 2032
- Table 24: China APAC Sealants & Adhesives Industry Revenue (Million) Forecast, by Application 2019 & 2032
- Table 25: Japan APAC Sealants & Adhesives Industry Revenue (Million) Forecast, by Application 2019 & 2032
- Table 26: India APAC Sealants & Adhesives Industry Revenue (Million) Forecast, by Application 2019 & 2032
- Table 27: South Korea APAC Sealants & Adhesives Industry Revenue (Million) Forecast, by Application 2019 & 2032
- Table 28: Southeast Asia APAC Sealants & Adhesives Industry Revenue (Million) Forecast, by Application 2019 & 2032
- Table 29: Australia APAC Sealants & Adhesives Industry Revenue (Million) Forecast, by Application 2019 & 2032
- Table 30: Indonesia APAC Sealants & Adhesives Industry Revenue (Million) Forecast, by Application 2019 & 2032
- Table 31: Phillipes APAC Sealants & Adhesives Industry Revenue (Million) Forecast, by Application 2019 & 2032
- Table 32: Singapore APAC Sealants & Adhesives Industry Revenue (Million) Forecast, by Application 2019 & 2032
- Table 33: Thailandc APAC Sealants & Adhesives Industry Revenue (Million) Forecast, by Application 2019 & 2032
- Table 34: Rest of Asia Pacific APAC Sealants & Adhesives Industry Revenue (Million) Forecast, by Application 2019 & 2032
- Table 35: Global APAC Sealants & Adhesives Industry Revenue Million Forecast, by Country 2019 & 2032
- Table 36: Brazil APAC Sealants & Adhesives Industry Revenue (Million) Forecast, by Application 2019 & 2032
- Table 37: Argentina APAC Sealants & Adhesives Industry Revenue (Million) Forecast, by Application 2019 & 2032
- Table 38: Peru APAC Sealants & Adhesives Industry Revenue (Million) Forecast, by Application 2019 & 2032
- Table 39: Chile APAC Sealants & Adhesives Industry Revenue (Million) Forecast, by Application 2019 & 2032
- Table 40: Colombia APAC Sealants & Adhesives Industry Revenue (Million) Forecast, by Application 2019 & 2032
- Table 41: Ecuador APAC Sealants & Adhesives Industry Revenue (Million) Forecast, by Application 2019 & 2032
- Table 42: Venezuela APAC Sealants & Adhesives Industry Revenue (Million) Forecast, by Application 2019 & 2032
- Table 43: Rest of South America APAC Sealants & Adhesives Industry Revenue (Million) Forecast, by Application 2019 & 2032
- Table 44: Global APAC Sealants & Adhesives Industry Revenue Million Forecast, by Country 2019 & 2032
- Table 45: United States APAC Sealants & Adhesives Industry Revenue (Million) Forecast, by Application 2019 & 2032
- Table 46: Canada APAC Sealants & Adhesives Industry Revenue (Million) Forecast, by Application 2019 & 2032
- Table 47: Mexico APAC Sealants & Adhesives Industry Revenue (Million) Forecast, by Application 2019 & 2032
- Table 48: Global APAC Sealants & Adhesives Industry Revenue Million Forecast, by Country 2019 & 2032
- Table 49: United Arab Emirates APAC Sealants & Adhesives Industry Revenue (Million) Forecast, by Application 2019 & 2032
- Table 50: Saudi Arabia APAC Sealants & Adhesives Industry Revenue (Million) Forecast, by Application 2019 & 2032
- Table 51: South Africa APAC Sealants & Adhesives Industry Revenue (Million) Forecast, by Application 2019 & 2032
- Table 52: Rest of Middle East and Africa APAC Sealants & Adhesives Industry Revenue (Million) Forecast, by Application 2019 & 2032
- Table 53: Global APAC Sealants & Adhesives Industry Revenue Million Forecast, by Adhesives Resin 2019 & 2032
- Table 54: Global APAC Sealants & Adhesives Industry Revenue Million Forecast, by Adhesives Technology 2019 & 2032
- Table 55: Global APAC Sealants & Adhesives Industry Revenue Million Forecast, by Sealants Resin 2019 & 2032
- Table 56: Global APAC Sealants & Adhesives Industry Revenue Million Forecast, by End-User Industry 2019 & 2032
- Table 57: Global APAC Sealants & Adhesives Industry Revenue Million Forecast, by Geography 2019 & 2032
- Table 58: Global APAC Sealants & Adhesives Industry Revenue Million Forecast, by Country 2019 & 2032
- Table 59: Global APAC Sealants & Adhesives Industry Revenue Million Forecast, by Adhesives Resin 2019 & 2032
- Table 60: Global APAC Sealants & Adhesives Industry Revenue Million Forecast, by Adhesives Technology 2019 & 2032
- Table 61: Global APAC Sealants & Adhesives Industry Revenue Million Forecast, by Sealants Resin 2019 & 2032
- Table 62: Global APAC Sealants & Adhesives Industry Revenue Million Forecast, by End-User Industry 2019 & 2032
- Table 63: Global APAC Sealants & Adhesives Industry Revenue Million Forecast, by Geography 2019 & 2032
- Table 64: Global APAC Sealants & Adhesives Industry Revenue Million Forecast, by Country 2019 & 2032
- Table 65: Global APAC Sealants & Adhesives Industry Revenue Million Forecast, by Adhesives Resin 2019 & 2032
- Table 66: Global APAC Sealants & Adhesives Industry Revenue Million Forecast, by Adhesives Technology 2019 & 2032
- Table 67: Global APAC Sealants & Adhesives Industry Revenue Million Forecast, by Sealants Resin 2019 & 2032
- Table 68: Global APAC Sealants & Adhesives Industry Revenue Million Forecast, by End-User Industry 2019 & 2032
- Table 69: Global APAC Sealants & Adhesives Industry Revenue Million Forecast, by Geography 2019 & 2032
- Table 70: Global APAC Sealants & Adhesives Industry Revenue Million Forecast, by Country 2019 & 2032
- Table 71: Global APAC Sealants & Adhesives Industry Revenue Million Forecast, by Adhesives Resin 2019 & 2032
- Table 72: Global APAC Sealants & Adhesives Industry Revenue Million Forecast, by Adhesives Technology 2019 & 2032
- Table 73: Global APAC Sealants & Adhesives Industry Revenue Million Forecast, by Sealants Resin 2019 & 2032
- Table 74: Global APAC Sealants & Adhesives Industry Revenue Million Forecast, by End-User Industry 2019 & 2032
- Table 75: Global APAC Sealants & Adhesives Industry Revenue Million Forecast, by Geography 2019 & 2032
- Table 76: Global APAC Sealants & Adhesives Industry Revenue Million Forecast, by Country 2019 & 2032
- Table 77: Global APAC Sealants & Adhesives Industry Revenue Million Forecast, by Adhesives Resin 2019 & 2032
- Table 78: Global APAC Sealants & Adhesives Industry Revenue Million Forecast, by Adhesives Technology 2019 & 2032
- Table 79: Global APAC Sealants & Adhesives Industry Revenue Million Forecast, by Sealants Resin 2019 & 2032
- Table 80: Global APAC Sealants & Adhesives Industry Revenue Million Forecast, by End-User Industry 2019 & 2032
- Table 81: Global APAC Sealants & Adhesives Industry Revenue Million Forecast, by Geography 2019 & 2032
- Table 82: Global APAC Sealants & Adhesives Industry Revenue Million Forecast, by Country 2019 & 2032
- Table 83: Global APAC Sealants & Adhesives Industry Revenue Million Forecast, by Adhesives Resin 2019 & 2032
- Table 84: Global APAC Sealants & Adhesives Industry Revenue Million Forecast, by Adhesives Technology 2019 & 2032
- Table 85: Global APAC Sealants & Adhesives Industry Revenue Million Forecast, by Sealants Resin 2019 & 2032
- Table 86: Global APAC Sealants & Adhesives Industry Revenue Million Forecast, by End-User Industry 2019 & 2032
- Table 87: Global APAC Sealants & Adhesives Industry Revenue Million Forecast, by Geography 2019 & 2032
- Table 88: Global APAC Sealants & Adhesives Industry Revenue Million Forecast, by Country 2019 & 2032
- Table 89: Global APAC Sealants & Adhesives Industry Revenue Million Forecast, by Adhesives Resin 2019 & 2032
- Table 90: Global APAC Sealants & Adhesives Industry Revenue Million Forecast, by Adhesives Technology 2019 & 2032
- Table 91: Global APAC Sealants & Adhesives Industry Revenue Million Forecast, by Sealants Resin 2019 & 2032
- Table 92: Global APAC Sealants & Adhesives Industry Revenue Million Forecast, by End-User Industry 2019 & 2032
- Table 93: Global APAC Sealants & Adhesives Industry Revenue Million Forecast, by Geography 2019 & 2032
- Table 94: Global APAC Sealants & Adhesives Industry Revenue Million Forecast, by Country 2019 & 2032
- Table 95: Global APAC Sealants & Adhesives Industry Revenue Million Forecast, by Adhesives Resin 2019 & 2032
- Table 96: Global APAC Sealants & Adhesives Industry Revenue Million Forecast, by Adhesives Technology 2019 & 2032
- Table 97: Global APAC Sealants & Adhesives Industry Revenue Million Forecast, by Sealants Resin 2019 & 2032
- Table 98: Global APAC Sealants & Adhesives Industry Revenue Million Forecast, by End-User Industry 2019 & 2032
- Table 99: Global APAC Sealants & Adhesives Industry Revenue Million Forecast, by Geography 2019 & 2032
- Table 100: Global APAC Sealants & Adhesives Industry Revenue Million Forecast, by Country 2019 & 2032
- Table 101: Global APAC Sealants & Adhesives Industry Revenue Million Forecast, by Adhesives Resin 2019 & 2032
- Table 102: Global APAC Sealants & Adhesives Industry Revenue Million Forecast, by Adhesives Technology 2019 & 2032
- Table 103: Global APAC Sealants & Adhesives Industry Revenue Million Forecast, by Sealants Resin 2019 & 2032
- Table 104: Global APAC Sealants & Adhesives Industry Revenue Million Forecast, by End-User Industry 2019 & 2032
- Table 105: Global APAC Sealants & Adhesives Industry Revenue Million Forecast, by Geography 2019 & 2032
- Table 106: Global APAC Sealants & Adhesives Industry Revenue Million Forecast, by Country 2019 & 2032
Frequently Asked Questions
1. What is the projected Compound Annual Growth Rate (CAGR) of the APAC Sealants & Adhesives Industry?
The projected CAGR is approximately > 6.00%.
2. Which companies are prominent players in the APAC Sealants & Adhesives Industry?
Key companies in the market include Sika AG, Huntsman International LLC, Tesa SE (A Beiersdorf Company), ITW Performance Polymers (Illinois Tool Works Inc ), Henkel AG & Co KGaA, Pidilite Industries Ltd, Beardow Adams, DuPont, Dow, Arkema, H B Fuller Company, 3M, Mapei Inc, Dymax Corporation, Avery Dennison Corporation, Wacker Chemie AG*List Not Exhaustive, Jowat AG, Ashland, Franklin International.
3. What are the main segments of the APAC Sealants & Adhesives Industry?
The market segments include Adhesives Resin, Adhesives Technology, Sealants Resin, End-User Industry, Geography.
4. Can you provide details about the market size?
The market size is estimated to be USD 30.26 Million as of 2022.
5. What are some drivers contributing to market growth?
Growing Packaging Industry in South-East Asia Countries; Growing Demand in Construction Sector; Other Drivers.
6. What are the notable trends driving market growth?
Packaging Segment to Dominate the Market.
7. Are there any restraints impacting market growth?
Stringent Environmental Regulations Regarding VOC Emissions; High Fluctuations in Raw Material Pricing.
8. Can you provide examples of recent developments in the market?
N/A
9. What pricing options are available for accessing the report?
Pricing options include single-user, multi-user, and enterprise licenses priced at USD 4750, USD 5250, and USD 8750 respectively.
10. Is the market size provided in terms of value or volume?
The market size is provided in terms of value, measured in Million.
11. Are there any specific market keywords associated with the report?
Yes, the market keyword associated with the report is "APAC Sealants & Adhesives Industry," which aids in identifying and referencing the specific market segment covered.
12. How do I determine which pricing option suits my needs best?
The pricing options vary based on user requirements and access needs. Individual users may opt for single-user licenses, while businesses requiring broader access may choose multi-user or enterprise licenses for cost-effective access to the report.
13. Are there any additional resources or data provided in the APAC Sealants & Adhesives Industry report?
While the report offers comprehensive insights, it's advisable to review the specific contents or supplementary materials provided to ascertain if additional resources or data are available.
14. How can I stay updated on further developments or reports in the APAC Sealants & Adhesives Industry?
To stay informed about further developments, trends, and reports in the APAC Sealants & Adhesives Industry, consider subscribing to industry newsletters, following relevant companies and organizations, or regularly checking reputable industry news sources and publications.
Methodology
Step 1 - Identification of Relevant Samples Size from Population Database


Step 2 - Approaches for Defining Global Market Size (Value, Volume* & Price*)

Note*: In applicable scenarios
Step 3 - Data Sources
Primary Research
- Web Analytics
- Survey Reports
- Research Institute
- Latest Research Reports
- Opinion Leaders
Secondary Research
- Annual Reports
- White Paper
- Latest Press Release
- Industry Association
- Paid Database
- Investor Presentations

Step 4 - Data Triangulation
Involves using different sources of information in order to increase the validity of a study
These sources are likely to be stakeholders in a program - participants, other researchers, program staff, other community members, and so on.
Then we put all data in single framework & apply various statistical tools to find out the dynamic on the market.
During the analysis stage, feedback from the stakeholder groups would be compared to determine areas of agreement as well as areas of divergence


