
Key Insights
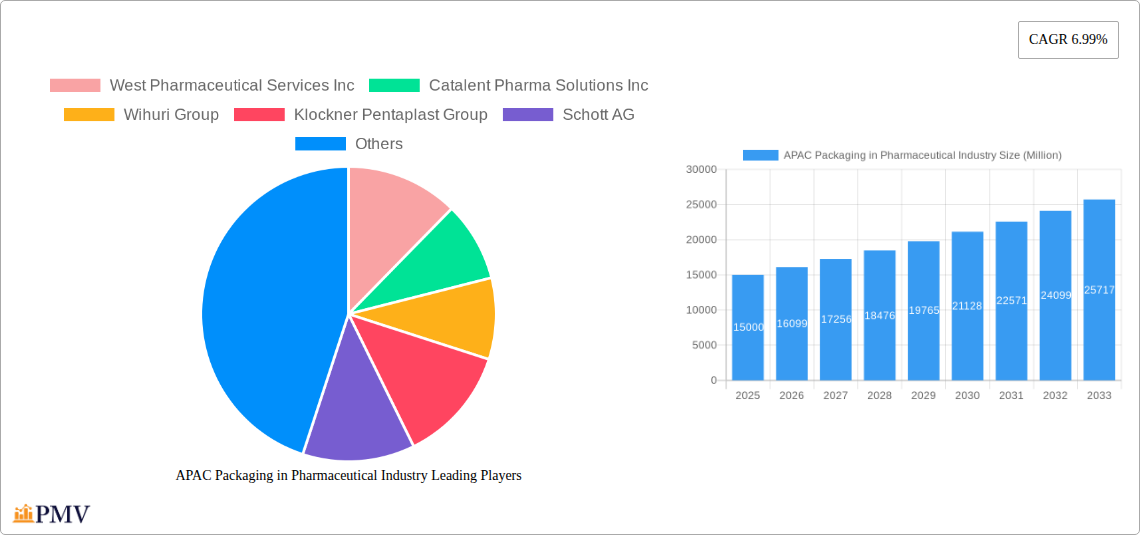
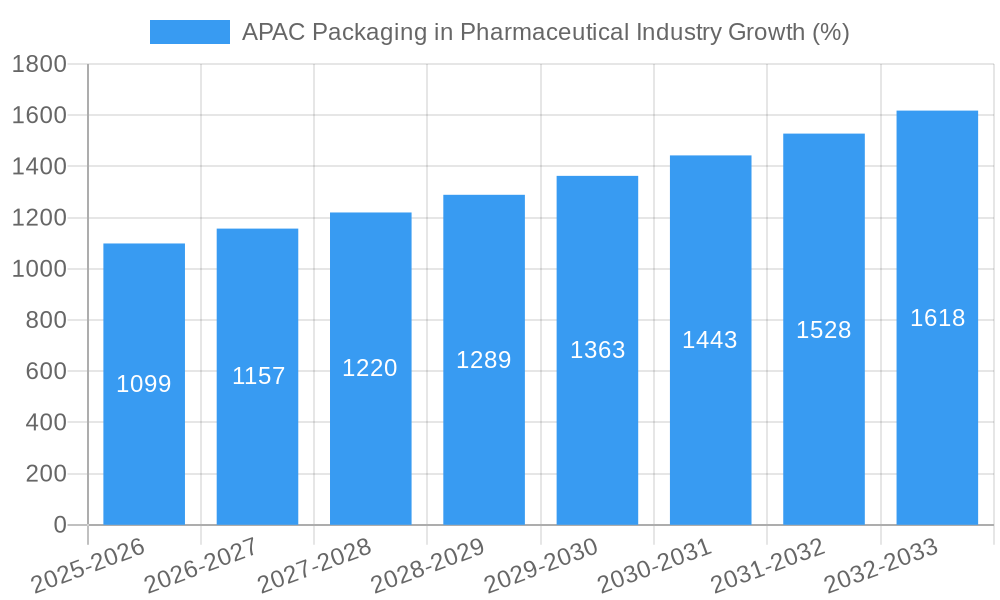
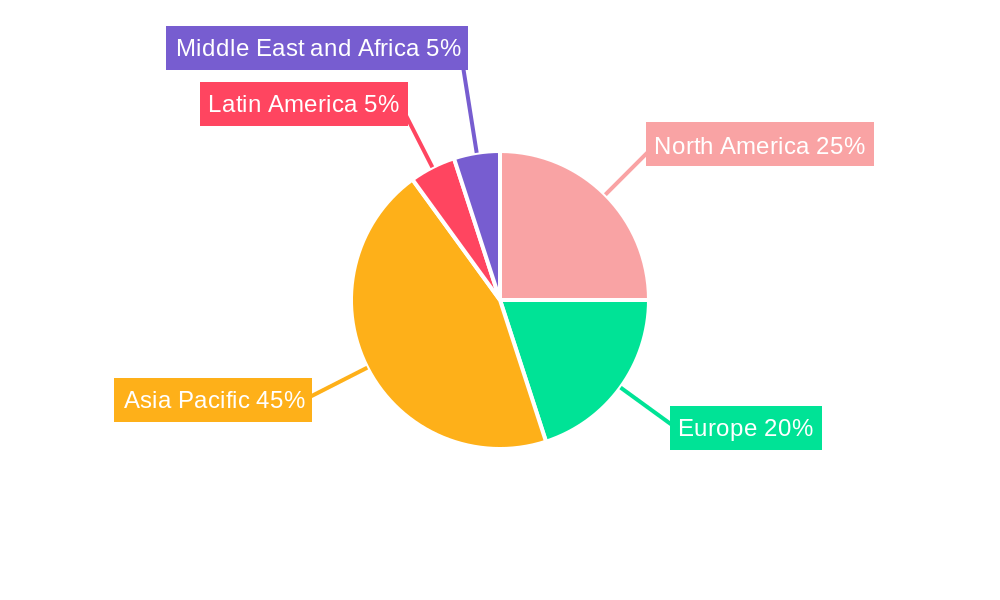
The Asia-Pacific (APAC) pharmaceutical packaging market is experiencing robust growth, driven by factors such as rising healthcare expenditure, a growing geriatric population requiring more medications, and increasing demand for advanced drug delivery systems. The market, valued at approximately $15 billion in 2025, is projected to expand at a Compound Annual Growth Rate (CAGR) of 6.99% from 2025 to 2033, reaching an estimated value exceeding $28 billion. This growth is significantly fueled by the large and rapidly developing pharmaceutical industries in countries like India and China, which are major consumers and manufacturers of pharmaceutical products. Further expansion is propelled by the increasing adoption of innovative packaging materials like modified-atmosphere packaging and blister packs designed to enhance drug stability and patient compliance. Growth within the region is further segmented by drug delivery modes (oral, injectable, pulmonary), materials (plastic, glass, paperboard), and packaging types (ampoules, vials, syringes, blister packs). Specific growth drivers vary by country; for example, the rise in chronic diseases in India drives demand for oral medication packaging, whereas Japan's advanced healthcare infrastructure supports higher adoption of sophisticated injectable drug packaging.
However, challenges persist. Regulatory hurdles related to packaging materials and stringent quality control standards can hinder market expansion. Moreover, fluctuating raw material prices and the increasing competition from regional manufacturers impact profit margins. Nevertheless, the long-term outlook remains optimistic, driven by a continuous rise in pharmaceutical production and distribution across the APAC region, coupled with rising government initiatives promoting pharmaceutical advancements. The increasing focus on cold chain logistics to ensure the integrity of temperature-sensitive drugs also offers promising growth opportunities for specialized packaging solutions within this rapidly evolving market. Specific regional growth rates within APAC will vary, reflecting differences in economic development, healthcare infrastructure, and regulatory frameworks across individual countries.
APAC Packaging in Pharmaceutical Industry: Market Report 2019-2033
This comprehensive report provides an in-depth analysis of the Asia-Pacific (APAC) pharmaceutical packaging market, covering the period 2019-2033. With a focus on key trends, leading players, and future growth opportunities, this report is an essential resource for industry stakeholders, investors, and strategic decision-makers. The report analyzes a market valued at xx Million in 2025, projecting significant growth to xx Million by 2033.
APAC Packaging in Pharmaceutical Industry Market Structure & Competitive Dynamics
The APAC pharmaceutical packaging market exhibits a moderately concentrated structure, with several multinational corporations holding significant market share. Key players such as West Pharmaceutical Services Inc, Catalent Pharma Solutions Inc, and Amcor Ltd compete intensely, driving innovation and consolidation. The market’s competitive landscape is further shaped by regional players and specialized packaging providers catering to niche drug delivery systems. Mergers and acquisitions (M&A) activity has been notable, with deal values exceeding xx Million in recent years, primarily focused on expanding geographic reach and technological capabilities. Regulatory frameworks, varying across APAC countries, impact market entry and product approval. Furthermore, the industry faces pressure from substitute materials and evolving end-user preferences toward sustainable and cost-effective packaging solutions.
- Market Concentration: Moderately concentrated, with top 5 players holding approximately xx% market share in 2025.
- Innovation Ecosystems: Strong presence of R&D facilities and collaborations, particularly in India and China.
- Regulatory Frameworks: Varying regulations across countries, impacting product approval and market entry.
- M&A Activity: Significant activity observed in recent years, exceeding xx Million in total deal value. Examples include the Gerresheimer AG and Corning Incorporated collaboration (February 2023).
- Product Substitutes: Growing demand for sustainable packaging options such as biodegradable plastics and recycled materials.
- End-User Trends: Increasing focus on patient convenience, tamper-evidence, and supply chain security.
APAC Packaging in Pharmaceutical Industry Industry Trends & Insights
The APAC pharmaceutical packaging market is experiencing robust growth, driven by factors such as the rising prevalence of chronic diseases, increasing pharmaceutical production, and government initiatives promoting healthcare infrastructure development. The market's Compound Annual Growth Rate (CAGR) is projected to be xx% during the forecast period (2025-2033). Technological advancements, particularly in advanced materials and smart packaging solutions, are reshaping the industry. Market penetration of innovative packaging types like blister packs and pre-filled syringes continues to increase, reflecting changing drug delivery methods and patient preferences. The competitive landscape remains dynamic, characterized by both organic growth and strategic acquisitions.
Dominant Markets & Segments in APAC Packaging in Pharmaceutical Industry
By Country: China and India represent the largest markets, driven by expanding healthcare infrastructure and rising pharmaceutical manufacturing. Japan maintains a significant market share due to its advanced healthcare sector and stringent regulatory standards. Australia contributes moderately, showcasing a mature pharmaceutical market. The "Rest of Asia-Pacific" exhibits significant growth potential.
By Drug Delivery Mode: Injectable drug packaging holds the largest market share, driven by the increasing demand for injectable therapies. Oral drug packaging remains substantial, while pulmonary drug packaging is witnessing considerable growth due to the rising prevalence of respiratory diseases.
By Material: Plastic dominates the market due to its cost-effectiveness and versatility. Glass retains significance in applications requiring high barrier properties and sterility. Paper and paperboard are gaining traction due to increasing sustainability concerns.
By Type: Vials, ampoules, and blister packs are the leading packaging types, driven by their widespread use in various drug delivery systems. Syringes are experiencing strong growth due to the rising popularity of pre-filled syringes.
Key Drivers:
- Economic Growth: Rapid economic expansion in several APAC countries fuels healthcare spending.
- Healthcare Infrastructure Development: Government investments in healthcare facilities boost demand.
- Pharmaceutical Production Growth: The increasing pharmaceutical manufacturing capacity fuels packaging requirements.
- Rising Prevalence of Chronic Diseases: An aging population and lifestyle changes increase demand for medicines.
APAC Packaging in Pharmaceutical Industry Product Innovations
Recent product innovations focus on enhancing drug stability, improving patient compliance, and reducing environmental impact. Advancements in materials science, such as the development of biodegradable plastics and active packaging, are shaping the industry. Smart packaging technologies, incorporating features like track-and-trace capabilities and temperature sensors, are gaining traction. These innovations cater to rising demands for enhanced supply chain security and patient safety.
Report Segmentation & Scope
This report segments the APAC pharmaceutical packaging market by drug delivery mode (oral, injectable, pulmonary, others), country (India, Japan, China, Australia, Rest of Asia-Pacific), material (plastic, paper and paperboard, glass, aluminum foil), and type (ampoules, blister packs, plastic bottles, syringes, vials, IV fluids, others). Each segment's growth projections, market size, and competitive dynamics are analyzed in detail within the report, with detailed market value estimations for each segment provided for the historical period (2019-2024), base year (2025), and forecast period (2025-2033).
Key Drivers of APAC Packaging in Pharmaceutical Industry Growth
The market's growth is fueled by the expansion of the pharmaceutical industry within the region, increasing demand for effective and safe drug delivery systems, and advancements in packaging technologies. Government regulations promoting pharmaceutical production and improved healthcare infrastructure also contribute to market expansion. The rising prevalence of chronic diseases and aging populations further drive demand for pharmaceuticals and their associated packaging.
Challenges in the APAC Packaging in Pharmaceutical Industry Sector
Significant challenges include stringent regulatory compliance requirements, the increasing need for sustainable packaging solutions, and the potential for supply chain disruptions. Maintaining high quality standards while balancing cost-effectiveness and environmental concerns presents ongoing challenges. Competition from both established and emerging players adds pressure on pricing and innovation. The impact of these challenges is estimated to reduce the overall market CAGR by approximately xx% during the forecast period.
Leading Players in the APAC Packaging in Pharmaceutical Industry Market
- West Pharmaceutical Services Inc
- Catalent Pharma Solutions Inc
- Wihuri Group
- Klockner Pentaplast Group
- Schott AG
- NIPRO Corporation
- CCL Industries Inc
- Gerresheimer AG
- Berry Global Group Inc
- Amcor Ltd
Key Developments in APAC Packaging in Pharmaceutical Industry Sector
October 2023: Sonoco ThermoSafe's Pegasus ULD significantly enhances pharmaceutical cold chain logistics in APAC, extending temperature control to 13 days without human intervention. This development addresses a critical challenge in regional pharmaceutical shipments, boosting market growth.
February 2023: Gerresheimer AG's collaboration with Corning Incorporated accelerates the production and availability of high-quality Velocity Vials, improving access to injectable therapies across APAC. This partnership boosts efficiency and product quality within the market.
Strategic APAC Packaging in Pharmaceutical Industry Market Outlook
The APAC pharmaceutical packaging market presents significant growth opportunities for companies focusing on sustainable, innovative, and cost-effective solutions. The rising demand for advanced packaging technologies, coupled with increasing government support for healthcare infrastructure, positions the market for substantial expansion. Companies investing in R&D, strategic partnerships, and expansion into key growth markets within the region are poised to capitalize on future market potential.
APAC Packaging in Pharmaceutical Industry Segmentation
-
1. Material
- 1.1. Plastic
- 1.2. Paper and Paper Board
- 1.3. Glass
- 1.4. Aluminum Foil
-
2. Type
- 2.1. Ampoules
- 2.2. Blister Packs
- 2.3. Plastic Bottles
- 2.4. Syringes
- 2.5. Vials
- 2.6. IV fluids
- 2.7. Other Types
-
3. Drug Delivery Mode
- 3.1. Oral Drug packaging
- 3.2. Injectable Drug packaging
- 3.3. Pulmonary Drug Packaging
- 3.4. Other Drug Delivery Modes
APAC Packaging in Pharmaceutical Industry Segmentation By Geography
-
1. North America
- 1.1. United States
- 1.2. Canada
- 1.3. Mexico
-
2. South America
- 2.1. Brazil
- 2.2. Argentina
- 2.3. Rest of South America
-
3. Europe
- 3.1. United Kingdom
- 3.2. Germany
- 3.3. France
- 3.4. Italy
- 3.5. Spain
- 3.6. Russia
- 3.7. Benelux
- 3.8. Nordics
- 3.9. Rest of Europe
-
4. Middle East & Africa
- 4.1. Turkey
- 4.2. Israel
- 4.3. GCC
- 4.4. North Africa
- 4.5. South Africa
- 4.6. Rest of Middle East & Africa
-
5. Asia Pacific
- 5.1. China
- 5.2. India
- 5.3. Japan
- 5.4. South Korea
- 5.5. ASEAN
- 5.6. Oceania
- 5.7. Rest of Asia Pacific
APAC Packaging in Pharmaceutical Industry REPORT HIGHLIGHTS
| Aspects | Details |
|---|---|
| Study Period | 2019-2033 |
| Base Year | 2024 |
| Estimated Year | 2025 |
| Forecast Period | 2025-2033 |
| Historical Period | 2019-2024 |
| Growth Rate | CAGR of 6.99% from 2019-2033 |
| Segmentation |
|
Table of Contents
- 1. Introduction
- 1.1. Research Scope
- 1.2. Market Segmentation
- 1.3. Research Methodology
- 1.4. Definitions and Assumptions
- 2. Executive Summary
- 2.1. Introduction
- 3. Market Dynamics
- 3.1. Introduction
- 3.2. Market Drivers
- 3.2.1. Increasing Adoption of Pharmaceutical Packaging in Emerging Economies
- 3.3. Market Restrains
- 3.3.1. Fluctuations in Raw Material Cost
- 3.4. Market Trends
- 3.4.1. Glass Packaging is Expected to Witness Significant Growth
- 4. Market Factor Analysis
- 4.1. Porters Five Forces
- 4.2. Supply/Value Chain
- 4.3. PESTEL analysis
- 4.4. Market Entropy
- 4.5. Patent/Trademark Analysis
- 5. Global APAC Packaging in Pharmaceutical Industry Analysis, Insights and Forecast, 2019-2031
- 5.1. Market Analysis, Insights and Forecast - by Material
- 5.1.1. Plastic
- 5.1.2. Paper and Paper Board
- 5.1.3. Glass
- 5.1.4. Aluminum Foil
- 5.2. Market Analysis, Insights and Forecast - by Type
- 5.2.1. Ampoules
- 5.2.2. Blister Packs
- 5.2.3. Plastic Bottles
- 5.2.4. Syringes
- 5.2.5. Vials
- 5.2.6. IV fluids
- 5.2.7. Other Types
- 5.3. Market Analysis, Insights and Forecast - by Drug Delivery Mode
- 5.3.1. Oral Drug packaging
- 5.3.2. Injectable Drug packaging
- 5.3.3. Pulmonary Drug Packaging
- 5.3.4. Other Drug Delivery Modes
- 5.4. Market Analysis, Insights and Forecast - by Region
- 5.4.1. North America
- 5.4.2. South America
- 5.4.3. Europe
- 5.4.4. Middle East & Africa
- 5.4.5. Asia Pacific
- 5.1. Market Analysis, Insights and Forecast - by Material
- 6. North America APAC Packaging in Pharmaceutical Industry Analysis, Insights and Forecast, 2019-2031
- 6.1. Market Analysis, Insights and Forecast - by Material
- 6.1.1. Plastic
- 6.1.2. Paper and Paper Board
- 6.1.3. Glass
- 6.1.4. Aluminum Foil
- 6.2. Market Analysis, Insights and Forecast - by Type
- 6.2.1. Ampoules
- 6.2.2. Blister Packs
- 6.2.3. Plastic Bottles
- 6.2.4. Syringes
- 6.2.5. Vials
- 6.2.6. IV fluids
- 6.2.7. Other Types
- 6.3. Market Analysis, Insights and Forecast - by Drug Delivery Mode
- 6.3.1. Oral Drug packaging
- 6.3.2. Injectable Drug packaging
- 6.3.3. Pulmonary Drug Packaging
- 6.3.4. Other Drug Delivery Modes
- 6.1. Market Analysis, Insights and Forecast - by Material
- 7. South America APAC Packaging in Pharmaceutical Industry Analysis, Insights and Forecast, 2019-2031
- 7.1. Market Analysis, Insights and Forecast - by Material
- 7.1.1. Plastic
- 7.1.2. Paper and Paper Board
- 7.1.3. Glass
- 7.1.4. Aluminum Foil
- 7.2. Market Analysis, Insights and Forecast - by Type
- 7.2.1. Ampoules
- 7.2.2. Blister Packs
- 7.2.3. Plastic Bottles
- 7.2.4. Syringes
- 7.2.5. Vials
- 7.2.6. IV fluids
- 7.2.7. Other Types
- 7.3. Market Analysis, Insights and Forecast - by Drug Delivery Mode
- 7.3.1. Oral Drug packaging
- 7.3.2. Injectable Drug packaging
- 7.3.3. Pulmonary Drug Packaging
- 7.3.4. Other Drug Delivery Modes
- 7.1. Market Analysis, Insights and Forecast - by Material
- 8. Europe APAC Packaging in Pharmaceutical Industry Analysis, Insights and Forecast, 2019-2031
- 8.1. Market Analysis, Insights and Forecast - by Material
- 8.1.1. Plastic
- 8.1.2. Paper and Paper Board
- 8.1.3. Glass
- 8.1.4. Aluminum Foil
- 8.2. Market Analysis, Insights and Forecast - by Type
- 8.2.1. Ampoules
- 8.2.2. Blister Packs
- 8.2.3. Plastic Bottles
- 8.2.4. Syringes
- 8.2.5. Vials
- 8.2.6. IV fluids
- 8.2.7. Other Types
- 8.3. Market Analysis, Insights and Forecast - by Drug Delivery Mode
- 8.3.1. Oral Drug packaging
- 8.3.2. Injectable Drug packaging
- 8.3.3. Pulmonary Drug Packaging
- 8.3.4. Other Drug Delivery Modes
- 8.1. Market Analysis, Insights and Forecast - by Material
- 9. Middle East & Africa APAC Packaging in Pharmaceutical Industry Analysis, Insights and Forecast, 2019-2031
- 9.1. Market Analysis, Insights and Forecast - by Material
- 9.1.1. Plastic
- 9.1.2. Paper and Paper Board
- 9.1.3. Glass
- 9.1.4. Aluminum Foil
- 9.2. Market Analysis, Insights and Forecast - by Type
- 9.2.1. Ampoules
- 9.2.2. Blister Packs
- 9.2.3. Plastic Bottles
- 9.2.4. Syringes
- 9.2.5. Vials
- 9.2.6. IV fluids
- 9.2.7. Other Types
- 9.3. Market Analysis, Insights and Forecast - by Drug Delivery Mode
- 9.3.1. Oral Drug packaging
- 9.3.2. Injectable Drug packaging
- 9.3.3. Pulmonary Drug Packaging
- 9.3.4. Other Drug Delivery Modes
- 9.1. Market Analysis, Insights and Forecast - by Material
- 10. Asia Pacific APAC Packaging in Pharmaceutical Industry Analysis, Insights and Forecast, 2019-2031
- 10.1. Market Analysis, Insights and Forecast - by Material
- 10.1.1. Plastic
- 10.1.2. Paper and Paper Board
- 10.1.3. Glass
- 10.1.4. Aluminum Foil
- 10.2. Market Analysis, Insights and Forecast - by Type
- 10.2.1. Ampoules
- 10.2.2. Blister Packs
- 10.2.3. Plastic Bottles
- 10.2.4. Syringes
- 10.2.5. Vials
- 10.2.6. IV fluids
- 10.2.7. Other Types
- 10.3. Market Analysis, Insights and Forecast - by Drug Delivery Mode
- 10.3.1. Oral Drug packaging
- 10.3.2. Injectable Drug packaging
- 10.3.3. Pulmonary Drug Packaging
- 10.3.4. Other Drug Delivery Modes
- 10.1. Market Analysis, Insights and Forecast - by Material
- 11. North America APAC Packaging in Pharmaceutical Industry Analysis, Insights and Forecast, 2019-2031
- 11.1. Market Analysis, Insights and Forecast - By Country/Sub-region
- 11.1.1.
- 12. Europe APAC Packaging in Pharmaceutical Industry Analysis, Insights and Forecast, 2019-2031
- 12.1. Market Analysis, Insights and Forecast - By Country/Sub-region
- 12.1.1.
- 13. Asia Pacific APAC Packaging in Pharmaceutical Industry Analysis, Insights and Forecast, 2019-2031
- 13.1. Market Analysis, Insights and Forecast - By Country/Sub-region
- 13.1.1.
- 14. Latin America APAC Packaging in Pharmaceutical Industry Analysis, Insights and Forecast, 2019-2031
- 14.1. Market Analysis, Insights and Forecast - By Country/Sub-region
- 14.1.1.
- 15. Middle East and Africa APAC Packaging in Pharmaceutical Industry Analysis, Insights and Forecast, 2019-2031
- 15.1. Market Analysis, Insights and Forecast - By Country/Sub-region
- 15.1.1.
- 16. Competitive Analysis
- 16.1. Global Market Share Analysis 2024
- 16.2. Company Profiles
- 16.2.1 West Pharmaceutical Services Inc
- 16.2.1.1. Overview
- 16.2.1.2. Products
- 16.2.1.3. SWOT Analysis
- 16.2.1.4. Recent Developments
- 16.2.1.5. Financials (Based on Availability)
- 16.2.2 Catalent Pharma Solutions Inc
- 16.2.2.1. Overview
- 16.2.2.2. Products
- 16.2.2.3. SWOT Analysis
- 16.2.2.4. Recent Developments
- 16.2.2.5. Financials (Based on Availability)
- 16.2.3 Wihuri Group
- 16.2.3.1. Overview
- 16.2.3.2. Products
- 16.2.3.3. SWOT Analysis
- 16.2.3.4. Recent Developments
- 16.2.3.5. Financials (Based on Availability)
- 16.2.4 Klockner Pentaplast Group
- 16.2.4.1. Overview
- 16.2.4.2. Products
- 16.2.4.3. SWOT Analysis
- 16.2.4.4. Recent Developments
- 16.2.4.5. Financials (Based on Availability)
- 16.2.5 Schott AG
- 16.2.5.1. Overview
- 16.2.5.2. Products
- 16.2.5.3. SWOT Analysis
- 16.2.5.4. Recent Developments
- 16.2.5.5. Financials (Based on Availability)
- 16.2.6 NIPRO Corporation
- 16.2.6.1. Overview
- 16.2.6.2. Products
- 16.2.6.3. SWOT Analysis
- 16.2.6.4. Recent Developments
- 16.2.6.5. Financials (Based on Availability)
- 16.2.7 CCL Industries Inc
- 16.2.7.1. Overview
- 16.2.7.2. Products
- 16.2.7.3. SWOT Analysis
- 16.2.7.4. Recent Developments
- 16.2.7.5. Financials (Based on Availability)
- 16.2.8 Gerresheimer AG
- 16.2.8.1. Overview
- 16.2.8.2. Products
- 16.2.8.3. SWOT Analysis
- 16.2.8.4. Recent Developments
- 16.2.8.5. Financials (Based on Availability)
- 16.2.9 Berry Global Group Inc *List Not Exhaustive
- 16.2.9.1. Overview
- 16.2.9.2. Products
- 16.2.9.3. SWOT Analysis
- 16.2.9.4. Recent Developments
- 16.2.9.5. Financials (Based on Availability)
- 16.2.10 Amcor Ltd
- 16.2.10.1. Overview
- 16.2.10.2. Products
- 16.2.10.3. SWOT Analysis
- 16.2.10.4. Recent Developments
- 16.2.10.5. Financials (Based on Availability)
- 16.2.1 West Pharmaceutical Services Inc
List of Figures
- Figure 1: Global APAC Packaging in Pharmaceutical Industry Revenue Breakdown (Million, %) by Region 2024 & 2032
- Figure 2: North America APAC Packaging in Pharmaceutical Industry Revenue (Million), by Country 2024 & 2032
- Figure 3: North America APAC Packaging in Pharmaceutical Industry Revenue Share (%), by Country 2024 & 2032
- Figure 4: Europe APAC Packaging in Pharmaceutical Industry Revenue (Million), by Country 2024 & 2032
- Figure 5: Europe APAC Packaging in Pharmaceutical Industry Revenue Share (%), by Country 2024 & 2032
- Figure 6: Asia Pacific APAC Packaging in Pharmaceutical Industry Revenue (Million), by Country 2024 & 2032
- Figure 7: Asia Pacific APAC Packaging in Pharmaceutical Industry Revenue Share (%), by Country 2024 & 2032
- Figure 8: Latin America APAC Packaging in Pharmaceutical Industry Revenue (Million), by Country 2024 & 2032
- Figure 9: Latin America APAC Packaging in Pharmaceutical Industry Revenue Share (%), by Country 2024 & 2032
- Figure 10: Middle East and Africa APAC Packaging in Pharmaceutical Industry Revenue (Million), by Country 2024 & 2032
- Figure 11: Middle East and Africa APAC Packaging in Pharmaceutical Industry Revenue Share (%), by Country 2024 & 2032
- Figure 12: North America APAC Packaging in Pharmaceutical Industry Revenue (Million), by Material 2024 & 2032
- Figure 13: North America APAC Packaging in Pharmaceutical Industry Revenue Share (%), by Material 2024 & 2032
- Figure 14: North America APAC Packaging in Pharmaceutical Industry Revenue (Million), by Type 2024 & 2032
- Figure 15: North America APAC Packaging in Pharmaceutical Industry Revenue Share (%), by Type 2024 & 2032
- Figure 16: North America APAC Packaging in Pharmaceutical Industry Revenue (Million), by Drug Delivery Mode 2024 & 2032
- Figure 17: North America APAC Packaging in Pharmaceutical Industry Revenue Share (%), by Drug Delivery Mode 2024 & 2032
- Figure 18: North America APAC Packaging in Pharmaceutical Industry Revenue (Million), by Country 2024 & 2032
- Figure 19: North America APAC Packaging in Pharmaceutical Industry Revenue Share (%), by Country 2024 & 2032
- Figure 20: South America APAC Packaging in Pharmaceutical Industry Revenue (Million), by Material 2024 & 2032
- Figure 21: South America APAC Packaging in Pharmaceutical Industry Revenue Share (%), by Material 2024 & 2032
- Figure 22: South America APAC Packaging in Pharmaceutical Industry Revenue (Million), by Type 2024 & 2032
- Figure 23: South America APAC Packaging in Pharmaceutical Industry Revenue Share (%), by Type 2024 & 2032
- Figure 24: South America APAC Packaging in Pharmaceutical Industry Revenue (Million), by Drug Delivery Mode 2024 & 2032
- Figure 25: South America APAC Packaging in Pharmaceutical Industry Revenue Share (%), by Drug Delivery Mode 2024 & 2032
- Figure 26: South America APAC Packaging in Pharmaceutical Industry Revenue (Million), by Country 2024 & 2032
- Figure 27: South America APAC Packaging in Pharmaceutical Industry Revenue Share (%), by Country 2024 & 2032
- Figure 28: Europe APAC Packaging in Pharmaceutical Industry Revenue (Million), by Material 2024 & 2032
- Figure 29: Europe APAC Packaging in Pharmaceutical Industry Revenue Share (%), by Material 2024 & 2032
- Figure 30: Europe APAC Packaging in Pharmaceutical Industry Revenue (Million), by Type 2024 & 2032
- Figure 31: Europe APAC Packaging in Pharmaceutical Industry Revenue Share (%), by Type 2024 & 2032
- Figure 32: Europe APAC Packaging in Pharmaceutical Industry Revenue (Million), by Drug Delivery Mode 2024 & 2032
- Figure 33: Europe APAC Packaging in Pharmaceutical Industry Revenue Share (%), by Drug Delivery Mode 2024 & 2032
- Figure 34: Europe APAC Packaging in Pharmaceutical Industry Revenue (Million), by Country 2024 & 2032
- Figure 35: Europe APAC Packaging in Pharmaceutical Industry Revenue Share (%), by Country 2024 & 2032
- Figure 36: Middle East & Africa APAC Packaging in Pharmaceutical Industry Revenue (Million), by Material 2024 & 2032
- Figure 37: Middle East & Africa APAC Packaging in Pharmaceutical Industry Revenue Share (%), by Material 2024 & 2032
- Figure 38: Middle East & Africa APAC Packaging in Pharmaceutical Industry Revenue (Million), by Type 2024 & 2032
- Figure 39: Middle East & Africa APAC Packaging in Pharmaceutical Industry Revenue Share (%), by Type 2024 & 2032
- Figure 40: Middle East & Africa APAC Packaging in Pharmaceutical Industry Revenue (Million), by Drug Delivery Mode 2024 & 2032
- Figure 41: Middle East & Africa APAC Packaging in Pharmaceutical Industry Revenue Share (%), by Drug Delivery Mode 2024 & 2032
- Figure 42: Middle East & Africa APAC Packaging in Pharmaceutical Industry Revenue (Million), by Country 2024 & 2032
- Figure 43: Middle East & Africa APAC Packaging in Pharmaceutical Industry Revenue Share (%), by Country 2024 & 2032
- Figure 44: Asia Pacific APAC Packaging in Pharmaceutical Industry Revenue (Million), by Material 2024 & 2032
- Figure 45: Asia Pacific APAC Packaging in Pharmaceutical Industry Revenue Share (%), by Material 2024 & 2032
- Figure 46: Asia Pacific APAC Packaging in Pharmaceutical Industry Revenue (Million), by Type 2024 & 2032
- Figure 47: Asia Pacific APAC Packaging in Pharmaceutical Industry Revenue Share (%), by Type 2024 & 2032
- Figure 48: Asia Pacific APAC Packaging in Pharmaceutical Industry Revenue (Million), by Drug Delivery Mode 2024 & 2032
- Figure 49: Asia Pacific APAC Packaging in Pharmaceutical Industry Revenue Share (%), by Drug Delivery Mode 2024 & 2032
- Figure 50: Asia Pacific APAC Packaging in Pharmaceutical Industry Revenue (Million), by Country 2024 & 2032
- Figure 51: Asia Pacific APAC Packaging in Pharmaceutical Industry Revenue Share (%), by Country 2024 & 2032
List of Tables
- Table 1: Global APAC Packaging in Pharmaceutical Industry Revenue Million Forecast, by Region 2019 & 2032
- Table 2: Global APAC Packaging in Pharmaceutical Industry Revenue Million Forecast, by Material 2019 & 2032
- Table 3: Global APAC Packaging in Pharmaceutical Industry Revenue Million Forecast, by Type 2019 & 2032
- Table 4: Global APAC Packaging in Pharmaceutical Industry Revenue Million Forecast, by Drug Delivery Mode 2019 & 2032
- Table 5: Global APAC Packaging in Pharmaceutical Industry Revenue Million Forecast, by Region 2019 & 2032
- Table 6: Global APAC Packaging in Pharmaceutical Industry Revenue Million Forecast, by Country 2019 & 2032
- Table 7: APAC Packaging in Pharmaceutical Industry Revenue (Million) Forecast, by Application 2019 & 2032
- Table 8: Global APAC Packaging in Pharmaceutical Industry Revenue Million Forecast, by Country 2019 & 2032
- Table 9: APAC Packaging in Pharmaceutical Industry Revenue (Million) Forecast, by Application 2019 & 2032
- Table 10: Global APAC Packaging in Pharmaceutical Industry Revenue Million Forecast, by Country 2019 & 2032
- Table 11: APAC Packaging in Pharmaceutical Industry Revenue (Million) Forecast, by Application 2019 & 2032
- Table 12: Global APAC Packaging in Pharmaceutical Industry Revenue Million Forecast, by Country 2019 & 2032
- Table 13: APAC Packaging in Pharmaceutical Industry Revenue (Million) Forecast, by Application 2019 & 2032
- Table 14: Global APAC Packaging in Pharmaceutical Industry Revenue Million Forecast, by Country 2019 & 2032
- Table 15: APAC Packaging in Pharmaceutical Industry Revenue (Million) Forecast, by Application 2019 & 2032
- Table 16: Global APAC Packaging in Pharmaceutical Industry Revenue Million Forecast, by Material 2019 & 2032
- Table 17: Global APAC Packaging in Pharmaceutical Industry Revenue Million Forecast, by Type 2019 & 2032
- Table 18: Global APAC Packaging in Pharmaceutical Industry Revenue Million Forecast, by Drug Delivery Mode 2019 & 2032
- Table 19: Global APAC Packaging in Pharmaceutical Industry Revenue Million Forecast, by Country 2019 & 2032
- Table 20: United States APAC Packaging in Pharmaceutical Industry Revenue (Million) Forecast, by Application 2019 & 2032
- Table 21: Canada APAC Packaging in Pharmaceutical Industry Revenue (Million) Forecast, by Application 2019 & 2032
- Table 22: Mexico APAC Packaging in Pharmaceutical Industry Revenue (Million) Forecast, by Application 2019 & 2032
- Table 23: Global APAC Packaging in Pharmaceutical Industry Revenue Million Forecast, by Material 2019 & 2032
- Table 24: Global APAC Packaging in Pharmaceutical Industry Revenue Million Forecast, by Type 2019 & 2032
- Table 25: Global APAC Packaging in Pharmaceutical Industry Revenue Million Forecast, by Drug Delivery Mode 2019 & 2032
- Table 26: Global APAC Packaging in Pharmaceutical Industry Revenue Million Forecast, by Country 2019 & 2032
- Table 27: Brazil APAC Packaging in Pharmaceutical Industry Revenue (Million) Forecast, by Application 2019 & 2032
- Table 28: Argentina APAC Packaging in Pharmaceutical Industry Revenue (Million) Forecast, by Application 2019 & 2032
- Table 29: Rest of South America APAC Packaging in Pharmaceutical Industry Revenue (Million) Forecast, by Application 2019 & 2032
- Table 30: Global APAC Packaging in Pharmaceutical Industry Revenue Million Forecast, by Material 2019 & 2032
- Table 31: Global APAC Packaging in Pharmaceutical Industry Revenue Million Forecast, by Type 2019 & 2032
- Table 32: Global APAC Packaging in Pharmaceutical Industry Revenue Million Forecast, by Drug Delivery Mode 2019 & 2032
- Table 33: Global APAC Packaging in Pharmaceutical Industry Revenue Million Forecast, by Country 2019 & 2032
- Table 34: United Kingdom APAC Packaging in Pharmaceutical Industry Revenue (Million) Forecast, by Application 2019 & 2032
- Table 35: Germany APAC Packaging in Pharmaceutical Industry Revenue (Million) Forecast, by Application 2019 & 2032
- Table 36: France APAC Packaging in Pharmaceutical Industry Revenue (Million) Forecast, by Application 2019 & 2032
- Table 37: Italy APAC Packaging in Pharmaceutical Industry Revenue (Million) Forecast, by Application 2019 & 2032
- Table 38: Spain APAC Packaging in Pharmaceutical Industry Revenue (Million) Forecast, by Application 2019 & 2032
- Table 39: Russia APAC Packaging in Pharmaceutical Industry Revenue (Million) Forecast, by Application 2019 & 2032
- Table 40: Benelux APAC Packaging in Pharmaceutical Industry Revenue (Million) Forecast, by Application 2019 & 2032
- Table 41: Nordics APAC Packaging in Pharmaceutical Industry Revenue (Million) Forecast, by Application 2019 & 2032
- Table 42: Rest of Europe APAC Packaging in Pharmaceutical Industry Revenue (Million) Forecast, by Application 2019 & 2032
- Table 43: Global APAC Packaging in Pharmaceutical Industry Revenue Million Forecast, by Material 2019 & 2032
- Table 44: Global APAC Packaging in Pharmaceutical Industry Revenue Million Forecast, by Type 2019 & 2032
- Table 45: Global APAC Packaging in Pharmaceutical Industry Revenue Million Forecast, by Drug Delivery Mode 2019 & 2032
- Table 46: Global APAC Packaging in Pharmaceutical Industry Revenue Million Forecast, by Country 2019 & 2032
- Table 47: Turkey APAC Packaging in Pharmaceutical Industry Revenue (Million) Forecast, by Application 2019 & 2032
- Table 48: Israel APAC Packaging in Pharmaceutical Industry Revenue (Million) Forecast, by Application 2019 & 2032
- Table 49: GCC APAC Packaging in Pharmaceutical Industry Revenue (Million) Forecast, by Application 2019 & 2032
- Table 50: North Africa APAC Packaging in Pharmaceutical Industry Revenue (Million) Forecast, by Application 2019 & 2032
- Table 51: South Africa APAC Packaging in Pharmaceutical Industry Revenue (Million) Forecast, by Application 2019 & 2032
- Table 52: Rest of Middle East & Africa APAC Packaging in Pharmaceutical Industry Revenue (Million) Forecast, by Application 2019 & 2032
- Table 53: Global APAC Packaging in Pharmaceutical Industry Revenue Million Forecast, by Material 2019 & 2032
- Table 54: Global APAC Packaging in Pharmaceutical Industry Revenue Million Forecast, by Type 2019 & 2032
- Table 55: Global APAC Packaging in Pharmaceutical Industry Revenue Million Forecast, by Drug Delivery Mode 2019 & 2032
- Table 56: Global APAC Packaging in Pharmaceutical Industry Revenue Million Forecast, by Country 2019 & 2032
- Table 57: China APAC Packaging in Pharmaceutical Industry Revenue (Million) Forecast, by Application 2019 & 2032
- Table 58: India APAC Packaging in Pharmaceutical Industry Revenue (Million) Forecast, by Application 2019 & 2032
- Table 59: Japan APAC Packaging in Pharmaceutical Industry Revenue (Million) Forecast, by Application 2019 & 2032
- Table 60: South Korea APAC Packaging in Pharmaceutical Industry Revenue (Million) Forecast, by Application 2019 & 2032
- Table 61: ASEAN APAC Packaging in Pharmaceutical Industry Revenue (Million) Forecast, by Application 2019 & 2032
- Table 62: Oceania APAC Packaging in Pharmaceutical Industry Revenue (Million) Forecast, by Application 2019 & 2032
- Table 63: Rest of Asia Pacific APAC Packaging in Pharmaceutical Industry Revenue (Million) Forecast, by Application 2019 & 2032
Frequently Asked Questions
1. What is the projected Compound Annual Growth Rate (CAGR) of the APAC Packaging in Pharmaceutical Industry?
The projected CAGR is approximately 6.99%.
2. Which companies are prominent players in the APAC Packaging in Pharmaceutical Industry?
Key companies in the market include West Pharmaceutical Services Inc, Catalent Pharma Solutions Inc, Wihuri Group, Klockner Pentaplast Group, Schott AG, NIPRO Corporation, CCL Industries Inc, Gerresheimer AG, Berry Global Group Inc *List Not Exhaustive, Amcor Ltd.
3. What are the main segments of the APAC Packaging in Pharmaceutical Industry?
The market segments include Material, Type, Drug Delivery Mode.
4. Can you provide details about the market size?
The market size is estimated to be USD 41.66 Million as of 2022.
5. What are some drivers contributing to market growth?
Increasing Adoption of Pharmaceutical Packaging in Emerging Economies.
6. What are the notable trends driving market growth?
Glass Packaging is Expected to Witness Significant Growth.
7. Are there any restraints impacting market growth?
Fluctuations in Raw Material Cost.
8. Can you provide examples of recent developments in the market?
October 2023 - Sonoco ThermoSafe’s branded product has played a role in increasing pharmaceutical shipments in/out of the Asia Pacific (APAC) region. According to the temperature assurance packaging company, the Pegasus ULD performs up to 300+ hours, equivalent to 13 days without human intervention, providing temperature control for 2-8°C payloads.
9. What pricing options are available for accessing the report?
Pricing options include single-user, multi-user, and enterprise licenses priced at USD 4750, USD 4950, and USD 6800 respectively.
10. Is the market size provided in terms of value or volume?
The market size is provided in terms of value, measured in Million.
11. Are there any specific market keywords associated with the report?
Yes, the market keyword associated with the report is "APAC Packaging in Pharmaceutical Industry," which aids in identifying and referencing the specific market segment covered.
12. How do I determine which pricing option suits my needs best?
The pricing options vary based on user requirements and access needs. Individual users may opt for single-user licenses, while businesses requiring broader access may choose multi-user or enterprise licenses for cost-effective access to the report.
13. Are there any additional resources or data provided in the APAC Packaging in Pharmaceutical Industry report?
While the report offers comprehensive insights, it's advisable to review the specific contents or supplementary materials provided to ascertain if additional resources or data are available.
14. How can I stay updated on further developments or reports in the APAC Packaging in Pharmaceutical Industry?
To stay informed about further developments, trends, and reports in the APAC Packaging in Pharmaceutical Industry, consider subscribing to industry newsletters, following relevant companies and organizations, or regularly checking reputable industry news sources and publications.
Methodology
Step 1 - Identification of Relevant Samples Size from Population Database


Step 2 - Approaches for Defining Global Market Size (Value, Volume* & Price*)

Note*: In applicable scenarios
Step 3 - Data Sources
Primary Research
- Web Analytics
- Survey Reports
- Research Institute
- Latest Research Reports
- Opinion Leaders
Secondary Research
- Annual Reports
- White Paper
- Latest Press Release
- Industry Association
- Paid Database
- Investor Presentations

Step 4 - Data Triangulation
Involves using different sources of information in order to increase the validity of a study
These sources are likely to be stakeholders in a program - participants, other researchers, program staff, other community members, and so on.
Then we put all data in single framework & apply various statistical tools to find out the dynamic on the market.
During the analysis stage, feedback from the stakeholder groups would be compared to determine areas of agreement as well as areas of divergence


