
Key Insights
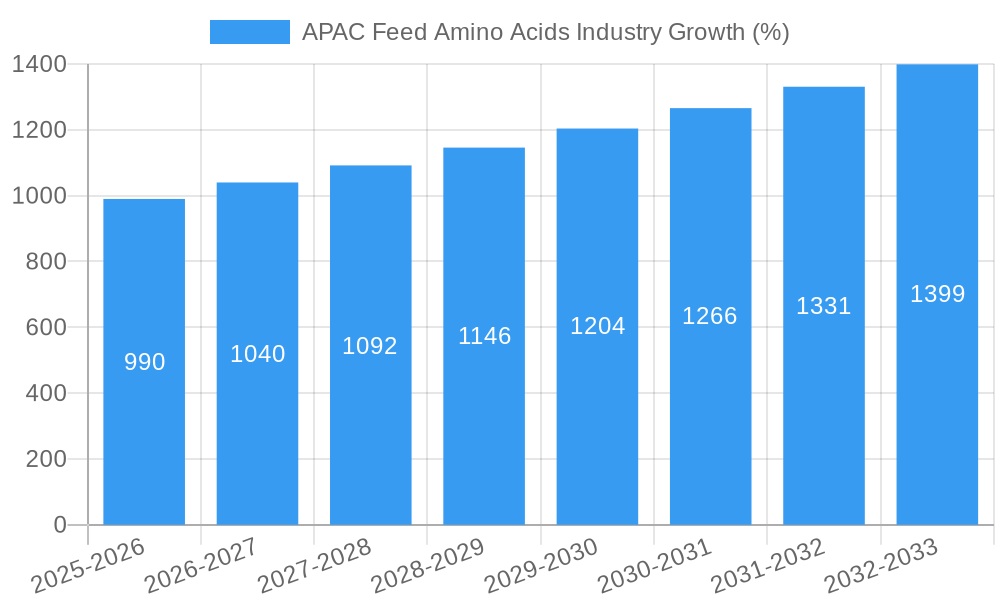
The Asia-Pacific (APAC) feed amino acids market is experiencing robust growth, driven by the region's expanding livestock and aquaculture sectors. A compound annual growth rate (CAGR) of 6.40% from 2019 to 2024 suggests a significant market expansion. This growth is fueled by increasing demand for animal protein, rising incomes leading to higher meat consumption, and advancements in animal feed formulation to improve feed efficiency and animal health. Key segments within the market include swine, poultry, and aquaculture, with significant contributions from countries like China, India, and Vietnam due to their large livestock populations and rapidly developing agricultural industries. The market is characterized by the use of essential amino acids such as lysine, methionine, and threonine, which are critical for optimizing animal growth and productivity. While challenges such as fluctuations in raw material prices and stringent regulatory requirements exist, the long-term outlook for the APAC feed amino acids market remains positive, driven by ongoing investments in animal agriculture and the increasing adoption of advanced feed technologies.
The competitive landscape is marked by both international and regional players. Major companies like Evonik, Ajinomoto, and Nutreco are key players, offering a diverse portfolio of amino acid products catering to specific animal needs. The market is also characterized by consolidation and strategic partnerships, with companies actively investing in research and development to enhance product efficacy and explore new market applications. The future will likely see increased focus on sustainable production practices and the development of innovative amino acid formulations tailored to specific animal species and dietary requirements. This will lead to greater efficiency and reduced environmental impact, contributing to the continued growth and sustainability of the APAC feed amino acids market. Further market segmentation by specific animal types (e.g., broiler chickens versus layer chickens) and geographic sub-regions would provide more granular insights and support more precise market forecasting.
APAC Feed Amino Acids Industry: A Comprehensive Market Report (2019-2033)
This comprehensive report provides a detailed analysis of the Asia-Pacific (APAC) feed amino acids industry, covering the period from 2019 to 2033. It offers invaluable insights into market dynamics, competitive landscapes, growth drivers, and future opportunities, equipping stakeholders with the knowledge to make informed strategic decisions. The report leverages extensive data analysis and industry expertise to offer actionable intelligence. The base year is 2025, with a forecast period spanning 2025-2033 and a historical period covering 2019-2024. The total market size in 2025 is estimated at xx Million.
APAC Feed Amino Acids Industry Market Structure & Competitive Dynamics
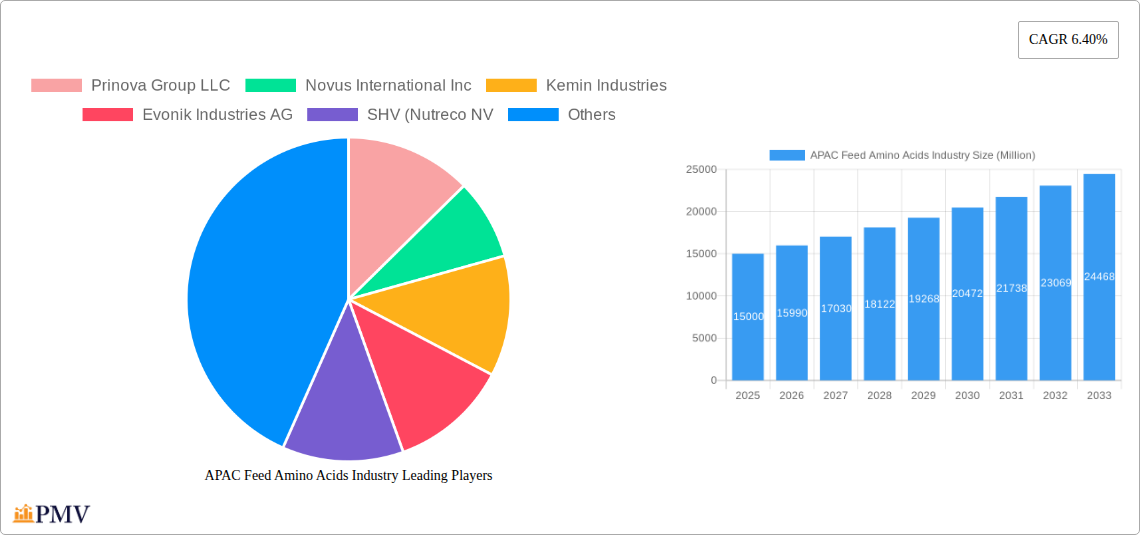
This section analyzes the APAC feed amino acids market structure, encompassing market concentration, innovation, regulatory aspects, substitute products, end-user trends, and mergers & acquisitions (M&A) activities. The market is characterized by a moderately concentrated structure, with key players like Prinova Group LLC, Novus International Inc, Kemin Industries, Evonik Industries AG, SHV (Nutreco NV), Ajinomoto Co Inc, Archer Daniel Midland Co, Lonza Group Ltd, Alltech Inc, and Adisseo holding significant market share. Market share distribution varies across different amino acid types and animal feed segments.
- Market Concentration: The Herfindahl-Hirschman Index (HHI) is estimated at xx, indicating a moderately concentrated market.
- Innovation Ecosystems: Significant investments are observed in R&D, leading to advancements in amino acid production technologies and novel feed additives.
- Regulatory Frameworks: Regulations concerning feed safety and environmental impact vary across APAC countries, influencing market dynamics.
- Product Substitutes: Plant-based protein sources and alternative feed ingredients pose a moderate threat to amino acid demand.
- End-User Trends: The growing demand for sustainable and efficient animal farming practices is driving the adoption of high-quality feed amino acids.
- M&A Activities: Recent M&A activity, including the acquisition of Agrivida by Novus International, reflects the industry’s focus on expanding product portfolios and enhancing technological capabilities. The total value of M&A deals in the past five years is estimated at xx Million.
APAC Feed Amino Acids Industry Industry Trends & Insights
The APAC feed amino acids market exhibits robust growth, driven by several factors. Rising demand for animal protein, coupled with increasing awareness of the importance of balanced nutrition in animal feed, is a primary driver. Technological advancements in amino acid production and improved feed formulations contribute to enhanced efficiency and profitability in livestock and aquaculture operations. The market is witnessing a shift towards liquid amino acids due to their improved bioavailability and handling advantages. The CAGR for the forecast period (2025-2033) is estimated at xx%. Market penetration of liquid methionine, for instance, is steadily increasing due to factors like the new Adisseo plant in Nanjing. Competitive dynamics are characterized by both price competition and product differentiation, with companies investing in R&D to create specialized amino acid solutions for specific animal species and production systems.
Dominant Markets & Segments in APAC Feed Amino Acids Industry
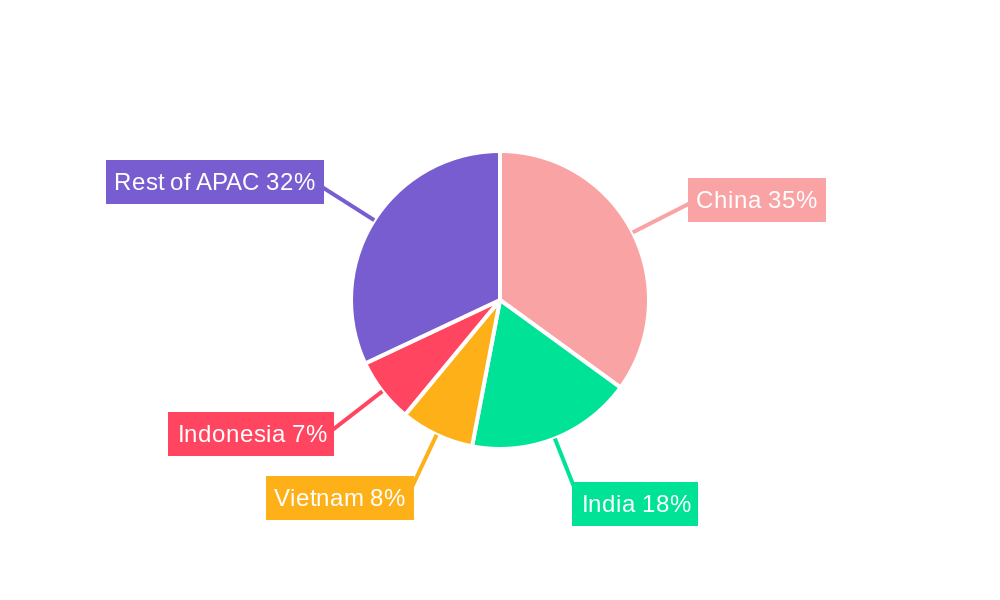
China dominates the APAC feed amino acids market, driven by its large livestock and aquaculture sectors. Other significant markets include India, Vietnam, and Indonesia.
Leading Regions/Countries:
- China: Largest market share due to its massive livestock and aquaculture industries, and expanding feed processing sector.
- India: Rapid economic growth and increasing meat consumption drive the demand.
- Vietnam: Significant growth in aquaculture and poultry sectors fuels market expansion.
- Indonesia: Growing population and rising meat consumption contribute to market growth.
Dominant Segments:
- Animal Feed Segments: Swine and poultry segments lead due to high amino acid requirements and intensive farming practices. Aquaculture is also exhibiting significant growth.
- Amino Acid Sub-Additives: Lysine and methionine account for a substantial market share due to high demand and wider application.
Key Drivers:
- Favorable economic policies promoting animal agriculture.
- Development of efficient feed processing and distribution infrastructure.
- Rising consumer incomes and changing dietary preferences.
APAC Feed Amino Acids Industry Product Innovations
Recent innovations focus on developing specialized amino acid formulations tailored to specific animal needs, enhancing digestibility, and improving feed efficiency. Technological advancements in fermentation and enzymatic processes have led to more sustainable and cost-effective production methods. Liquid amino acids are gaining traction due to their ease of handling and improved bioavailability. The market is also seeing the emergence of novel amino acid blends that optimize nutrient delivery and support animal health.
Report Segmentation & Scope
This report segments the APAC feed amino acids market by:
Animal Type: Aquaculture, Swine, Poultry, Other Ruminants, Other Animals. Growth projections vary across segments, with aquaculture and poultry demonstrating strong potential. Market sizes are provided for each segment based on volume and value. Competitive intensity varies among these segments.
Country: Australia, China, India, Indonesia, Japan, Philippines, South Korea, Thailand, Vietnam, and Rest of Asia-Pacific. Each country's analysis covers market size, growth drivers, regulatory landscape, and key players.
Amino Acid Type: Lysine, Methionine, Threonine, Tryptophan, and Other Amino Acids. Growth prospects for each amino acid type are influenced by factors like demand from various animal feed segments, technological advancements in production, and price fluctuations. Competitive intensity differs among these amino acid types.
Key Drivers of APAC Feed Amino Acids Industry Growth
Growth in the APAC feed amino acids market is primarily driven by the expansion of the livestock and aquaculture sectors, increasing consumer demand for animal protein, government initiatives to improve animal farming practices, and technological advancements in amino acid production. The rising adoption of efficient and sustainable farming practices also contributes to the growth of the market.
Challenges in the APAC Feed Amino Acids Industry Sector
The APAC feed amino acids market faces challenges, including fluctuating raw material prices, stringent regulatory requirements, potential supply chain disruptions, and intense competition among existing and emerging players. These factors can impact profitability and market stability.
Leading Players in the APAC Feed Amino Acids Industry Market
- Prinova Group LLC
- Novus International Inc
- Kemin Industries
- Evonik Industries AG
- SHV (Nutreco NV)
- Ajinomoto Co Inc
- Archer Daniel Midland Co
- Lonza Group Ltd
- Alltech Inc
- Adisseo
Key Developments in APAC Feed Amino Acids Industry Sector
- September 2022: Adisseo's new 180,000-ton liquid methionine plant in Nanjing, China, commenced operations, significantly expanding its global production capacity.
- October 2022: Evonik and BASF partnered, granting Evonik non-exclusive licensing rights to OpteinicsTM, a digital solution for improved animal feed efficiency and environmental sustainability.
- January 2023: Novus International acquired Agrivida, a biotech company specializing in feed additives, to bolster its product portfolio and innovation capabilities.
Strategic APAC Feed Amino Acids Industry Market Outlook
The APAC feed amino acids market holds significant growth potential, driven by increasing demand for animal protein, rising incomes, and technological advancements. Strategic opportunities lie in developing innovative amino acid formulations, expanding into emerging markets, and investing in sustainable production practices. Companies with strong R&D capabilities and a focus on customer needs are well-positioned to capture market share in this dynamic industry.
APAC Feed Amino Acids Industry Segmentation
-
1. Sub Additive
- 1.1. Lysine
- 1.2. Methionine
- 1.3. Threonine
- 1.4. Tryptophan
- 1.5. Other Amino Acids
-
2. Animal
-
2.1. Aquaculture
-
2.1.1. By Sub Animal
- 2.1.1.1. Fish
- 2.1.1.2. Shrimp
- 2.1.1.3. Other Aquaculture Species
-
2.1.1. By Sub Animal
-
2.2. Poultry
- 2.2.1. Broiler
- 2.2.2. Layer
- 2.2.3. Other Poultry Birds
-
2.3. Ruminants
- 2.3.1. Beef Cattle
- 2.3.2. Dairy Cattle
- 2.3.3. Other Ruminants
- 2.4. Swine
- 2.5. Other Animals
-
2.1. Aquaculture
APAC Feed Amino Acids Industry Segmentation By Geography
-
1. North America
- 1.1. United States
- 1.2. Canada
- 1.3. Mexico
-
2. South America
- 2.1. Brazil
- 2.2. Argentina
- 2.3. Rest of South America
-
3. Europe
- 3.1. United Kingdom
- 3.2. Germany
- 3.3. France
- 3.4. Italy
- 3.5. Spain
- 3.6. Russia
- 3.7. Benelux
- 3.8. Nordics
- 3.9. Rest of Europe
-
4. Middle East & Africa
- 4.1. Turkey
- 4.2. Israel
- 4.3. GCC
- 4.4. North Africa
- 4.5. South Africa
- 4.6. Rest of Middle East & Africa
-
5. Asia Pacific
- 5.1. China
- 5.2. India
- 5.3. Japan
- 5.4. South Korea
- 5.5. ASEAN
- 5.6. Oceania
- 5.7. Rest of Asia Pacific
APAC Feed Amino Acids Industry REPORT HIGHLIGHTS
| Aspects | Details |
|---|---|
| Study Period | 2019-2033 |
| Base Year | 2024 |
| Estimated Year | 2025 |
| Forecast Period | 2025-2033 |
| Historical Period | 2019-2024 |
| Growth Rate | CAGR of 6.40% from 2019-2033 |
| Segmentation |
|
Table of Contents
- 1. Introduction
- 1.1. Research Scope
- 1.2. Market Segmentation
- 1.3. Research Methodology
- 1.4. Definitions and Assumptions
- 2. Executive Summary
- 2.1. Introduction
- 3. Market Dynamics
- 3.1. Introduction
- 3.2. Market Drivers
- 3.2.1. Growing Livestock Population; Area Under Forage Production is Increasing; Increasing Demand for Animal Products
- 3.3. Market Restrains
- 3.3.1. Competition Amongst Industries and High Input Prices; Growing Shift Toward Vegan-Based Diet
- 3.4. Market Trends
- 3.4.1. OTHER KEY INDUSTRY TRENDS COVERED IN THE REPORT
- 4. Market Factor Analysis
- 4.1. Porters Five Forces
- 4.2. Supply/Value Chain
- 4.3. PESTEL analysis
- 4.4. Market Entropy
- 4.5. Patent/Trademark Analysis
- 5. Global APAC Feed Amino Acids Industry Analysis, Insights and Forecast, 2019-2031
- 5.1. Market Analysis, Insights and Forecast - by Sub Additive
- 5.1.1. Lysine
- 5.1.2. Methionine
- 5.1.3. Threonine
- 5.1.4. Tryptophan
- 5.1.5. Other Amino Acids
- 5.2. Market Analysis, Insights and Forecast - by Animal
- 5.2.1. Aquaculture
- 5.2.1.1. By Sub Animal
- 5.2.1.1.1. Fish
- 5.2.1.1.2. Shrimp
- 5.2.1.1.3. Other Aquaculture Species
- 5.2.1.1. By Sub Animal
- 5.2.2. Poultry
- 5.2.2.1. Broiler
- 5.2.2.2. Layer
- 5.2.2.3. Other Poultry Birds
- 5.2.3. Ruminants
- 5.2.3.1. Beef Cattle
- 5.2.3.2. Dairy Cattle
- 5.2.3.3. Other Ruminants
- 5.2.4. Swine
- 5.2.5. Other Animals
- 5.2.1. Aquaculture
- 5.3. Market Analysis, Insights and Forecast - by Region
- 5.3.1. North America
- 5.3.2. South America
- 5.3.3. Europe
- 5.3.4. Middle East & Africa
- 5.3.5. Asia Pacific
- 5.1. Market Analysis, Insights and Forecast - by Sub Additive
- 6. North America APAC Feed Amino Acids Industry Analysis, Insights and Forecast, 2019-2031
- 6.1. Market Analysis, Insights and Forecast - by Sub Additive
- 6.1.1. Lysine
- 6.1.2. Methionine
- 6.1.3. Threonine
- 6.1.4. Tryptophan
- 6.1.5. Other Amino Acids
- 6.2. Market Analysis, Insights and Forecast - by Animal
- 6.2.1. Aquaculture
- 6.2.1.1. By Sub Animal
- 6.2.1.1.1. Fish
- 6.2.1.1.2. Shrimp
- 6.2.1.1.3. Other Aquaculture Species
- 6.2.1.1. By Sub Animal
- 6.2.2. Poultry
- 6.2.2.1. Broiler
- 6.2.2.2. Layer
- 6.2.2.3. Other Poultry Birds
- 6.2.3. Ruminants
- 6.2.3.1. Beef Cattle
- 6.2.3.2. Dairy Cattle
- 6.2.3.3. Other Ruminants
- 6.2.4. Swine
- 6.2.5. Other Animals
- 6.2.1. Aquaculture
- 6.1. Market Analysis, Insights and Forecast - by Sub Additive
- 7. South America APAC Feed Amino Acids Industry Analysis, Insights and Forecast, 2019-2031
- 7.1. Market Analysis, Insights and Forecast - by Sub Additive
- 7.1.1. Lysine
- 7.1.2. Methionine
- 7.1.3. Threonine
- 7.1.4. Tryptophan
- 7.1.5. Other Amino Acids
- 7.2. Market Analysis, Insights and Forecast - by Animal
- 7.2.1. Aquaculture
- 7.2.1.1. By Sub Animal
- 7.2.1.1.1. Fish
- 7.2.1.1.2. Shrimp
- 7.2.1.1.3. Other Aquaculture Species
- 7.2.1.1. By Sub Animal
- 7.2.2. Poultry
- 7.2.2.1. Broiler
- 7.2.2.2. Layer
- 7.2.2.3. Other Poultry Birds
- 7.2.3. Ruminants
- 7.2.3.1. Beef Cattle
- 7.2.3.2. Dairy Cattle
- 7.2.3.3. Other Ruminants
- 7.2.4. Swine
- 7.2.5. Other Animals
- 7.2.1. Aquaculture
- 7.1. Market Analysis, Insights and Forecast - by Sub Additive
- 8. Europe APAC Feed Amino Acids Industry Analysis, Insights and Forecast, 2019-2031
- 8.1. Market Analysis, Insights and Forecast - by Sub Additive
- 8.1.1. Lysine
- 8.1.2. Methionine
- 8.1.3. Threonine
- 8.1.4. Tryptophan
- 8.1.5. Other Amino Acids
- 8.2. Market Analysis, Insights and Forecast - by Animal
- 8.2.1. Aquaculture
- 8.2.1.1. By Sub Animal
- 8.2.1.1.1. Fish
- 8.2.1.1.2. Shrimp
- 8.2.1.1.3. Other Aquaculture Species
- 8.2.1.1. By Sub Animal
- 8.2.2. Poultry
- 8.2.2.1. Broiler
- 8.2.2.2. Layer
- 8.2.2.3. Other Poultry Birds
- 8.2.3. Ruminants
- 8.2.3.1. Beef Cattle
- 8.2.3.2. Dairy Cattle
- 8.2.3.3. Other Ruminants
- 8.2.4. Swine
- 8.2.5. Other Animals
- 8.2.1. Aquaculture
- 8.1. Market Analysis, Insights and Forecast - by Sub Additive
- 9. Middle East & Africa APAC Feed Amino Acids Industry Analysis, Insights and Forecast, 2019-2031
- 9.1. Market Analysis, Insights and Forecast - by Sub Additive
- 9.1.1. Lysine
- 9.1.2. Methionine
- 9.1.3. Threonine
- 9.1.4. Tryptophan
- 9.1.5. Other Amino Acids
- 9.2. Market Analysis, Insights and Forecast - by Animal
- 9.2.1. Aquaculture
- 9.2.1.1. By Sub Animal
- 9.2.1.1.1. Fish
- 9.2.1.1.2. Shrimp
- 9.2.1.1.3. Other Aquaculture Species
- 9.2.1.1. By Sub Animal
- 9.2.2. Poultry
- 9.2.2.1. Broiler
- 9.2.2.2. Layer
- 9.2.2.3. Other Poultry Birds
- 9.2.3. Ruminants
- 9.2.3.1. Beef Cattle
- 9.2.3.2. Dairy Cattle
- 9.2.3.3. Other Ruminants
- 9.2.4. Swine
- 9.2.5. Other Animals
- 9.2.1. Aquaculture
- 9.1. Market Analysis, Insights and Forecast - by Sub Additive
- 10. Asia Pacific APAC Feed Amino Acids Industry Analysis, Insights and Forecast, 2019-2031
- 10.1. Market Analysis, Insights and Forecast - by Sub Additive
- 10.1.1. Lysine
- 10.1.2. Methionine
- 10.1.3. Threonine
- 10.1.4. Tryptophan
- 10.1.5. Other Amino Acids
- 10.2. Market Analysis, Insights and Forecast - by Animal
- 10.2.1. Aquaculture
- 10.2.1.1. By Sub Animal
- 10.2.1.1.1. Fish
- 10.2.1.1.2. Shrimp
- 10.2.1.1.3. Other Aquaculture Species
- 10.2.1.1. By Sub Animal
- 10.2.2. Poultry
- 10.2.2.1. Broiler
- 10.2.2.2. Layer
- 10.2.2.3. Other Poultry Birds
- 10.2.3. Ruminants
- 10.2.3.1. Beef Cattle
- 10.2.3.2. Dairy Cattle
- 10.2.3.3. Other Ruminants
- 10.2.4. Swine
- 10.2.5. Other Animals
- 10.2.1. Aquaculture
- 10.1. Market Analysis, Insights and Forecast - by Sub Additive
- 11. Competitive Analysis
- 11.1. Global Market Share Analysis 2024
- 11.2. Company Profiles
- 11.2.1 Prinova Group LLC
- 11.2.1.1. Overview
- 11.2.1.2. Products
- 11.2.1.3. SWOT Analysis
- 11.2.1.4. Recent Developments
- 11.2.1.5. Financials (Based on Availability)
- 11.2.2 Novus International Inc
- 11.2.2.1. Overview
- 11.2.2.2. Products
- 11.2.2.3. SWOT Analysis
- 11.2.2.4. Recent Developments
- 11.2.2.5. Financials (Based on Availability)
- 11.2.3 Kemin Industries
- 11.2.3.1. Overview
- 11.2.3.2. Products
- 11.2.3.3. SWOT Analysis
- 11.2.3.4. Recent Developments
- 11.2.3.5. Financials (Based on Availability)
- 11.2.4 Evonik Industries AG
- 11.2.4.1. Overview
- 11.2.4.2. Products
- 11.2.4.3. SWOT Analysis
- 11.2.4.4. Recent Developments
- 11.2.4.5. Financials (Based on Availability)
- 11.2.5 SHV (Nutreco NV
- 11.2.5.1. Overview
- 11.2.5.2. Products
- 11.2.5.3. SWOT Analysis
- 11.2.5.4. Recent Developments
- 11.2.5.5. Financials (Based on Availability)
- 11.2.6 Ajinomoto Co Inc
- 11.2.6.1. Overview
- 11.2.6.2. Products
- 11.2.6.3. SWOT Analysis
- 11.2.6.4. Recent Developments
- 11.2.6.5. Financials (Based on Availability)
- 11.2.7 Archer Daniel Midland Co
- 11.2.7.1. Overview
- 11.2.7.2. Products
- 11.2.7.3. SWOT Analysis
- 11.2.7.4. Recent Developments
- 11.2.7.5. Financials (Based on Availability)
- 11.2.8 Lonza Group Ltd
- 11.2.8.1. Overview
- 11.2.8.2. Products
- 11.2.8.3. SWOT Analysis
- 11.2.8.4. Recent Developments
- 11.2.8.5. Financials (Based on Availability)
- 11.2.9 Alltech Inc
- 11.2.9.1. Overview
- 11.2.9.2. Products
- 11.2.9.3. SWOT Analysis
- 11.2.9.4. Recent Developments
- 11.2.9.5. Financials (Based on Availability)
- 11.2.10 Adisseo
- 11.2.10.1. Overview
- 11.2.10.2. Products
- 11.2.10.3. SWOT Analysis
- 11.2.10.4. Recent Developments
- 11.2.10.5. Financials (Based on Availability)
- 11.2.1 Prinova Group LLC
List of Figures
- Figure 1: Global APAC Feed Amino Acids Industry Revenue Breakdown (Million, %) by Region 2024 & 2032
- Figure 2: North America APAC Feed Amino Acids Industry Revenue (Million), by Sub Additive 2024 & 2032
- Figure 3: North America APAC Feed Amino Acids Industry Revenue Share (%), by Sub Additive 2024 & 2032
- Figure 4: North America APAC Feed Amino Acids Industry Revenue (Million), by Animal 2024 & 2032
- Figure 5: North America APAC Feed Amino Acids Industry Revenue Share (%), by Animal 2024 & 2032
- Figure 6: North America APAC Feed Amino Acids Industry Revenue (Million), by Country 2024 & 2032
- Figure 7: North America APAC Feed Amino Acids Industry Revenue Share (%), by Country 2024 & 2032
- Figure 8: South America APAC Feed Amino Acids Industry Revenue (Million), by Sub Additive 2024 & 2032
- Figure 9: South America APAC Feed Amino Acids Industry Revenue Share (%), by Sub Additive 2024 & 2032
- Figure 10: South America APAC Feed Amino Acids Industry Revenue (Million), by Animal 2024 & 2032
- Figure 11: South America APAC Feed Amino Acids Industry Revenue Share (%), by Animal 2024 & 2032
- Figure 12: South America APAC Feed Amino Acids Industry Revenue (Million), by Country 2024 & 2032
- Figure 13: South America APAC Feed Amino Acids Industry Revenue Share (%), by Country 2024 & 2032
- Figure 14: Europe APAC Feed Amino Acids Industry Revenue (Million), by Sub Additive 2024 & 2032
- Figure 15: Europe APAC Feed Amino Acids Industry Revenue Share (%), by Sub Additive 2024 & 2032
- Figure 16: Europe APAC Feed Amino Acids Industry Revenue (Million), by Animal 2024 & 2032
- Figure 17: Europe APAC Feed Amino Acids Industry Revenue Share (%), by Animal 2024 & 2032
- Figure 18: Europe APAC Feed Amino Acids Industry Revenue (Million), by Country 2024 & 2032
- Figure 19: Europe APAC Feed Amino Acids Industry Revenue Share (%), by Country 2024 & 2032
- Figure 20: Middle East & Africa APAC Feed Amino Acids Industry Revenue (Million), by Sub Additive 2024 & 2032
- Figure 21: Middle East & Africa APAC Feed Amino Acids Industry Revenue Share (%), by Sub Additive 2024 & 2032
- Figure 22: Middle East & Africa APAC Feed Amino Acids Industry Revenue (Million), by Animal 2024 & 2032
- Figure 23: Middle East & Africa APAC Feed Amino Acids Industry Revenue Share (%), by Animal 2024 & 2032
- Figure 24: Middle East & Africa APAC Feed Amino Acids Industry Revenue (Million), by Country 2024 & 2032
- Figure 25: Middle East & Africa APAC Feed Amino Acids Industry Revenue Share (%), by Country 2024 & 2032
- Figure 26: Asia Pacific APAC Feed Amino Acids Industry Revenue (Million), by Sub Additive 2024 & 2032
- Figure 27: Asia Pacific APAC Feed Amino Acids Industry Revenue Share (%), by Sub Additive 2024 & 2032
- Figure 28: Asia Pacific APAC Feed Amino Acids Industry Revenue (Million), by Animal 2024 & 2032
- Figure 29: Asia Pacific APAC Feed Amino Acids Industry Revenue Share (%), by Animal 2024 & 2032
- Figure 30: Asia Pacific APAC Feed Amino Acids Industry Revenue (Million), by Country 2024 & 2032
- Figure 31: Asia Pacific APAC Feed Amino Acids Industry Revenue Share (%), by Country 2024 & 2032
List of Tables
- Table 1: Global APAC Feed Amino Acids Industry Revenue Million Forecast, by Region 2019 & 2032
- Table 2: Global APAC Feed Amino Acids Industry Revenue Million Forecast, by Sub Additive 2019 & 2032
- Table 3: Global APAC Feed Amino Acids Industry Revenue Million Forecast, by Animal 2019 & 2032
- Table 4: Global APAC Feed Amino Acids Industry Revenue Million Forecast, by Region 2019 & 2032
- Table 5: Global APAC Feed Amino Acids Industry Revenue Million Forecast, by Sub Additive 2019 & 2032
- Table 6: Global APAC Feed Amino Acids Industry Revenue Million Forecast, by Animal 2019 & 2032
- Table 7: Global APAC Feed Amino Acids Industry Revenue Million Forecast, by Country 2019 & 2032
- Table 8: United States APAC Feed Amino Acids Industry Revenue (Million) Forecast, by Application 2019 & 2032
- Table 9: Canada APAC Feed Amino Acids Industry Revenue (Million) Forecast, by Application 2019 & 2032
- Table 10: Mexico APAC Feed Amino Acids Industry Revenue (Million) Forecast, by Application 2019 & 2032
- Table 11: Global APAC Feed Amino Acids Industry Revenue Million Forecast, by Sub Additive 2019 & 2032
- Table 12: Global APAC Feed Amino Acids Industry Revenue Million Forecast, by Animal 2019 & 2032
- Table 13: Global APAC Feed Amino Acids Industry Revenue Million Forecast, by Country 2019 & 2032
- Table 14: Brazil APAC Feed Amino Acids Industry Revenue (Million) Forecast, by Application 2019 & 2032
- Table 15: Argentina APAC Feed Amino Acids Industry Revenue (Million) Forecast, by Application 2019 & 2032
- Table 16: Rest of South America APAC Feed Amino Acids Industry Revenue (Million) Forecast, by Application 2019 & 2032
- Table 17: Global APAC Feed Amino Acids Industry Revenue Million Forecast, by Sub Additive 2019 & 2032
- Table 18: Global APAC Feed Amino Acids Industry Revenue Million Forecast, by Animal 2019 & 2032
- Table 19: Global APAC Feed Amino Acids Industry Revenue Million Forecast, by Country 2019 & 2032
- Table 20: United Kingdom APAC Feed Amino Acids Industry Revenue (Million) Forecast, by Application 2019 & 2032
- Table 21: Germany APAC Feed Amino Acids Industry Revenue (Million) Forecast, by Application 2019 & 2032
- Table 22: France APAC Feed Amino Acids Industry Revenue (Million) Forecast, by Application 2019 & 2032
- Table 23: Italy APAC Feed Amino Acids Industry Revenue (Million) Forecast, by Application 2019 & 2032
- Table 24: Spain APAC Feed Amino Acids Industry Revenue (Million) Forecast, by Application 2019 & 2032
- Table 25: Russia APAC Feed Amino Acids Industry Revenue (Million) Forecast, by Application 2019 & 2032
- Table 26: Benelux APAC Feed Amino Acids Industry Revenue (Million) Forecast, by Application 2019 & 2032
- Table 27: Nordics APAC Feed Amino Acids Industry Revenue (Million) Forecast, by Application 2019 & 2032
- Table 28: Rest of Europe APAC Feed Amino Acids Industry Revenue (Million) Forecast, by Application 2019 & 2032
- Table 29: Global APAC Feed Amino Acids Industry Revenue Million Forecast, by Sub Additive 2019 & 2032
- Table 30: Global APAC Feed Amino Acids Industry Revenue Million Forecast, by Animal 2019 & 2032
- Table 31: Global APAC Feed Amino Acids Industry Revenue Million Forecast, by Country 2019 & 2032
- Table 32: Turkey APAC Feed Amino Acids Industry Revenue (Million) Forecast, by Application 2019 & 2032
- Table 33: Israel APAC Feed Amino Acids Industry Revenue (Million) Forecast, by Application 2019 & 2032
- Table 34: GCC APAC Feed Amino Acids Industry Revenue (Million) Forecast, by Application 2019 & 2032
- Table 35: North Africa APAC Feed Amino Acids Industry Revenue (Million) Forecast, by Application 2019 & 2032
- Table 36: South Africa APAC Feed Amino Acids Industry Revenue (Million) Forecast, by Application 2019 & 2032
- Table 37: Rest of Middle East & Africa APAC Feed Amino Acids Industry Revenue (Million) Forecast, by Application 2019 & 2032
- Table 38: Global APAC Feed Amino Acids Industry Revenue Million Forecast, by Sub Additive 2019 & 2032
- Table 39: Global APAC Feed Amino Acids Industry Revenue Million Forecast, by Animal 2019 & 2032
- Table 40: Global APAC Feed Amino Acids Industry Revenue Million Forecast, by Country 2019 & 2032
- Table 41: China APAC Feed Amino Acids Industry Revenue (Million) Forecast, by Application 2019 & 2032
- Table 42: India APAC Feed Amino Acids Industry Revenue (Million) Forecast, by Application 2019 & 2032
- Table 43: Japan APAC Feed Amino Acids Industry Revenue (Million) Forecast, by Application 2019 & 2032
- Table 44: South Korea APAC Feed Amino Acids Industry Revenue (Million) Forecast, by Application 2019 & 2032
- Table 45: ASEAN APAC Feed Amino Acids Industry Revenue (Million) Forecast, by Application 2019 & 2032
- Table 46: Oceania APAC Feed Amino Acids Industry Revenue (Million) Forecast, by Application 2019 & 2032
- Table 47: Rest of Asia Pacific APAC Feed Amino Acids Industry Revenue (Million) Forecast, by Application 2019 & 2032
Frequently Asked Questions
1. What is the projected Compound Annual Growth Rate (CAGR) of the APAC Feed Amino Acids Industry?
The projected CAGR is approximately 6.40%.
2. Which companies are prominent players in the APAC Feed Amino Acids Industry?
Key companies in the market include Prinova Group LLC, Novus International Inc, Kemin Industries, Evonik Industries AG, SHV (Nutreco NV, Ajinomoto Co Inc, Archer Daniel Midland Co, Lonza Group Ltd, Alltech Inc, Adisseo.
3. What are the main segments of the APAC Feed Amino Acids Industry?
The market segments include Sub Additive, Animal.
4. Can you provide details about the market size?
The market size is estimated to be USD XX Million as of 2022.
5. What are some drivers contributing to market growth?
Growing Livestock Population; Area Under Forage Production is Increasing; Increasing Demand for Animal Products.
6. What are the notable trends driving market growth?
OTHER KEY INDUSTRY TRENDS COVERED IN THE REPORT.
7. Are there any restraints impacting market growth?
Competition Amongst Industries and High Input Prices; Growing Shift Toward Vegan-Based Diet.
8. Can you provide examples of recent developments in the market?
January 2023: Novus International acquired the Biotech company Agrivida to develop new feed additives.October 2022: The partnership between Evonik and BASF allowed Evonik certain non-exclusive licensing rights to OpteinicsTM, a digital solution to improve comprehension and reduce the environmental impact of the animal protein and feed industries.September 2022: The new 180,000-ton liquid methionine plant of Adisseo in Nanjing, China, started production. The facility is one of the largest global liquid methionine production capacities that boosted the penetration of liquid methionine manufactured by the company in the global market.
9. What pricing options are available for accessing the report?
Pricing options include single-user, multi-user, and enterprise licenses priced at USD 3800, USD 4500, and USD 5800 respectively.
10. Is the market size provided in terms of value or volume?
The market size is provided in terms of value, measured in Million.
11. Are there any specific market keywords associated with the report?
Yes, the market keyword associated with the report is "APAC Feed Amino Acids Industry," which aids in identifying and referencing the specific market segment covered.
12. How do I determine which pricing option suits my needs best?
The pricing options vary based on user requirements and access needs. Individual users may opt for single-user licenses, while businesses requiring broader access may choose multi-user or enterprise licenses for cost-effective access to the report.
13. Are there any additional resources or data provided in the APAC Feed Amino Acids Industry report?
While the report offers comprehensive insights, it's advisable to review the specific contents or supplementary materials provided to ascertain if additional resources or data are available.
14. How can I stay updated on further developments or reports in the APAC Feed Amino Acids Industry?
To stay informed about further developments, trends, and reports in the APAC Feed Amino Acids Industry, consider subscribing to industry newsletters, following relevant companies and organizations, or regularly checking reputable industry news sources and publications.
Methodology
Step 1 - Identification of Relevant Samples Size from Population Database


Step 2 - Approaches for Defining Global Market Size (Value, Volume* & Price*)

Note*: In applicable scenarios
Step 3 - Data Sources
Primary Research
- Web Analytics
- Survey Reports
- Research Institute
- Latest Research Reports
- Opinion Leaders
Secondary Research
- Annual Reports
- White Paper
- Latest Press Release
- Industry Association
- Paid Database
- Investor Presentations

Step 4 - Data Triangulation
Involves using different sources of information in order to increase the validity of a study
These sources are likely to be stakeholders in a program - participants, other researchers, program staff, other community members, and so on.
Then we put all data in single framework & apply various statistical tools to find out the dynamic on the market.
During the analysis stage, feedback from the stakeholder groups would be compared to determine areas of agreement as well as areas of divergence


