
Key Insights
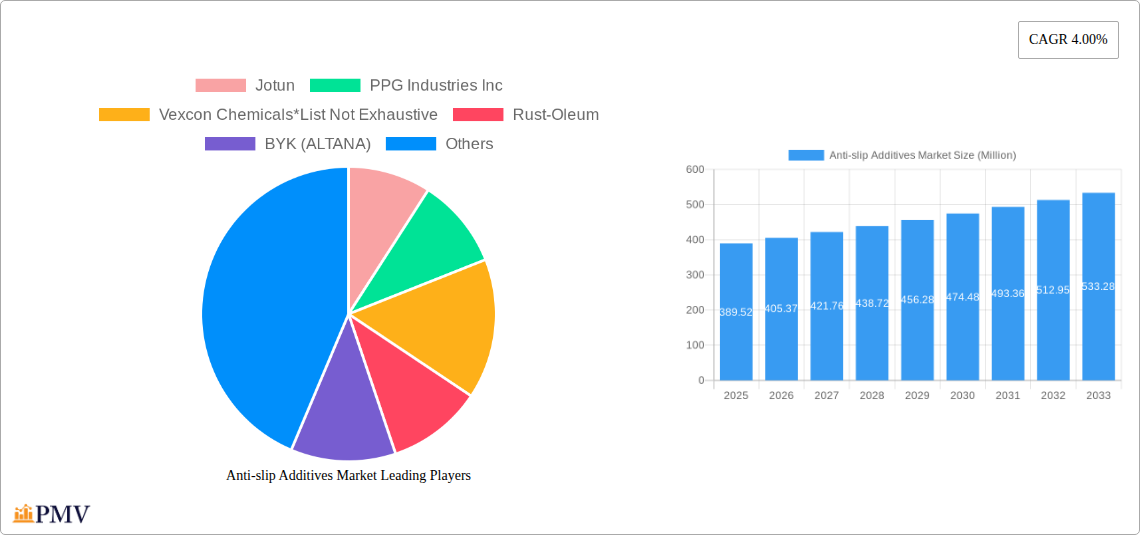
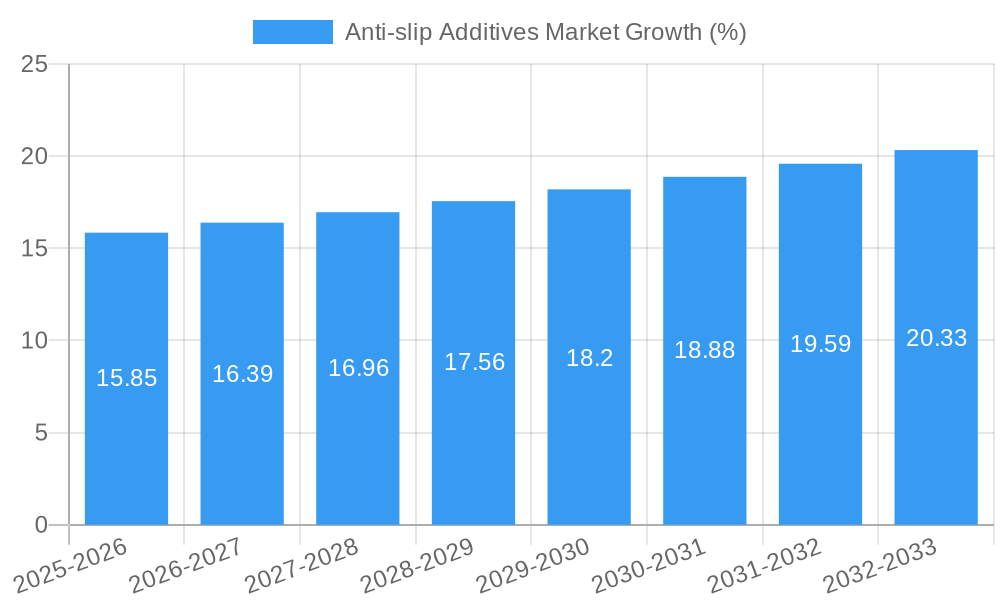
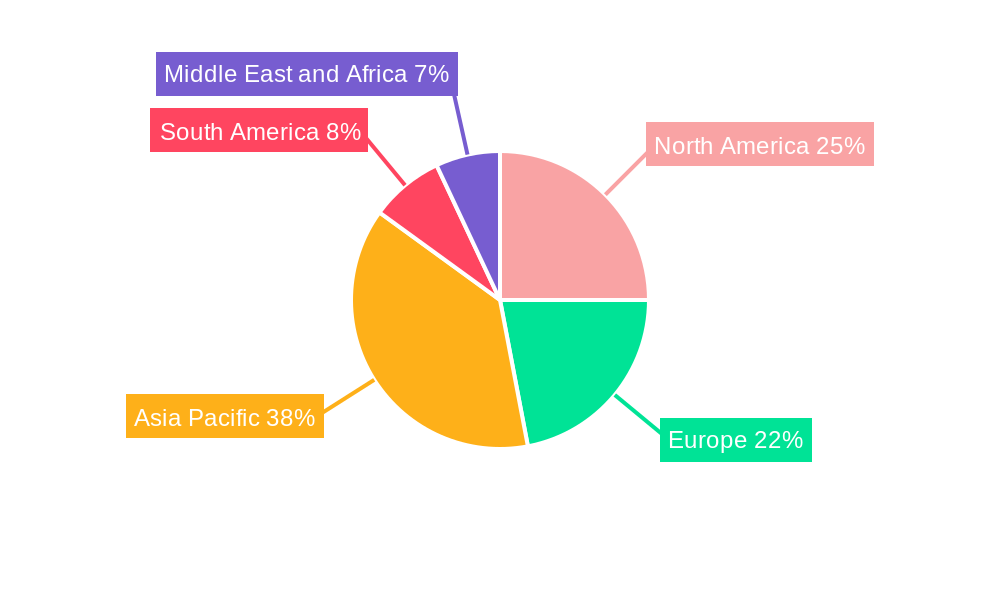
The global anti-slip additives market, valued at $389.52 million in 2025, is projected to experience robust growth, driven by the increasing demand for enhanced safety in various applications. A compound annual growth rate (CAGR) of 4% from 2025 to 2033 indicates a steady expansion. This growth is fueled by several key factors. The construction industry's emphasis on slip-resistant surfaces in buildings and industrial flooring is a major driver. Furthermore, the growing marine sector, with its stringent safety regulations, significantly contributes to the market's expansion. The increasing adoption of sustainable and eco-friendly anti-slip additives also plays a crucial role, aligning with global environmental concerns. Different additive types, including aluminum oxide, silica, and other specialized blends, cater to diverse needs and application requirements. The availability of these additives in various forms, such as powders, aggregates, and pre-mixed solutions, further enhances their versatility and market appeal. Key players like Jotun, PPG Industries Inc., and Akzo Nobel BV are driving innovation and expanding their product portfolios to meet the evolving demands of this market. Geographic expansion, particularly in rapidly developing regions like Asia-Pacific, presents significant growth opportunities.
However, the market faces certain challenges. Fluctuations in raw material prices and the potential for substitute materials could impact market growth. Moreover, stringent regulatory requirements related to environmental safety and product compliance could pose hurdles for some manufacturers. Nevertheless, the overarching trend towards enhanced safety and functionality, particularly in high-traffic areas, is expected to outweigh these challenges, driving consistent growth in the coming years. The market segmentation by additive type (aluminum oxide, silica, others), additive nature (powder, aggregate, mix), and application (buildings and construction, industrial flooring, marine, others) provides a nuanced understanding of the market dynamics and potential for future growth across various sectors and geographic regions.
Anti-slip Additives Market: A Comprehensive Report (2019-2033)
This in-depth report provides a comprehensive analysis of the global anti-slip additives market, offering actionable insights for stakeholders across the value chain. The study period spans 2019-2033, with a focus on the estimated year 2025 and a forecast period of 2025-2033. The report leverages a robust methodology, incorporating historical data (2019-2024) to project future market trends and growth. Key players analyzed include Jotun, PPG Industries Inc, Vexcon Chemicals, Rust-Oleum, BYK (ALTANA), Akzo Nobel BV, Axalta Coating Systems, Hempel A/S, Pro Chem Inc, Associated Chemical, and SAICOS COLOR GmbH, though the list is not exhaustive. The market is segmented by additive type (aluminum oxide, silica, other additive types), additive nature (powder, aggregate, mix), and application (buildings and construction, industrial flooring, marine, other applications). The total market value in 2025 is estimated at XX Million.
Anti-slip Additives Market Market Structure & Competitive Dynamics
The anti-slip additives market exhibits a moderately concentrated structure, with a few dominant players holding significant market share. However, the presence of numerous smaller players and regional manufacturers contributes to a competitive landscape. Innovation ecosystems are active, driven by the need for enhanced performance characteristics such as improved slip resistance in wet conditions, UV resistance, and durability. Regulatory frameworks, particularly concerning environmental regulations and safety standards for construction materials, play a significant role in shaping product development and market access. Product substitutes, such as textured surfaces and specialized coating techniques, exist but often lack the versatility and cost-effectiveness of anti-slip additives. End-user trends, particularly in the building and construction sector and industrial flooring, heavily influence market demand. M&A activities, such as the acquisition of a leading manufacturer by PPG Industries, signal consolidation and expansion strategies within the industry. While precise M&A deal values are not publicly available for all transactions, significant deals have reportedly exceeded XX Million. Market share data reveals that the top five players collectively hold approximately xx% of the market, indicating the fragmented nature of the smaller players.
Anti-slip Additives Market Industry Trends & Insights
The global anti-slip additives market is experiencing robust growth, driven by several key factors. The increasing focus on safety regulations across various industries, particularly in construction and industrial settings, is a primary driver. The construction industry’s expansion in developing economies fuels high demand. Technological advancements lead to the development of novel additives with enhanced performance characteristics, such as improved wet-slip resistance and durability. Consumer preferences are shifting towards environmentally friendly and sustainable products, creating opportunities for manufacturers offering eco-conscious additives. Competitive dynamics are shaped by product innovation, pricing strategies, and marketing efforts. The market is projected to exhibit a CAGR of xx% during the forecast period (2025-2033), with market penetration expected to increase significantly in emerging markets. The rising adoption of anti-slip additives in diverse applications, coupled with continuous innovation, positions the market for sustained growth in the coming years.
Dominant Markets & Segments in Anti-slip Additives Market
The building and construction sector represents the largest application segment for anti-slip additives, driven by stringent safety regulations and the increasing demand for durable and safe flooring solutions in residential and commercial buildings. Within additive types, aluminum oxide holds the largest market share due to its cost-effectiveness and excellent slip resistance properties. Geographically, the market is dominated by regions with robust construction activity and industrial growth. Specific countries with high market penetration include [Insert country names with xx Million market size prediction].
- Key Drivers in Dominant Regions:
- Robust infrastructure development initiatives.
- Stringent safety regulations.
- Growing industrialization.
- Favorable government policies promoting construction and industrial growth.
The dominance of these segments and regions is further strengthened by the availability of raw materials, established manufacturing infrastructure, and a substantial consumer base.
Anti-slip Additives Market Product Innovations
Recent product innovations in the anti-slip additives market focus on enhancing performance characteristics and expanding application areas. New formulations offer superior slip resistance in wet conditions, improved durability, and enhanced UV resistance. The integration of nanotechnology is driving the development of high-performance additives with enhanced properties. These innovations cater to evolving consumer needs and address specific challenges faced by various industries, thus solidifying the market position of companies introducing such products. A key trend is the development of eco-friendly and sustainable additives, aligning with the growing global focus on environmentally responsible practices.
Report Segmentation & Scope
This report segments the anti-slip additives market comprehensively, offering detailed analysis across various parameters:
Additive Type: Aluminum oxide, silica, and other additive types, each with its own growth projection and competitive dynamics.
Additive Nature: Powder, aggregate, and mix, each segment offering unique properties and applications.
Application: Buildings and construction, industrial flooring, marine, and other applications, each experiencing varying levels of growth and market penetration. The report provides detailed insights into each segment's market size, growth projections, and dominant players. Market size projections for each segment are available within the full report.
Key Drivers of Anti-slip Additives Market Growth
The anti-slip additives market's growth is propelled by several factors: stringent safety regulations mandating the use of anti-slip materials in various applications, the construction industry's boom globally, the ongoing development of technologically advanced additives with enhanced performance attributes (e.g., improved wet slip resistance), increasing awareness of workplace safety and the need to mitigate risks of slips and falls, and the rising demand for eco-friendly and sustainable solutions. These factors collectively contribute to the market's upward trajectory.
Challenges in the Anti-slip Additives Market Sector
Challenges within the anti-slip additives market include fluctuations in raw material prices, intense competition from established players and new entrants, the need to comply with stringent environmental regulations, and potential supply chain disruptions. These factors, if not properly managed, could impact the profitability and growth of companies operating in this market. The fluctuating price of raw materials, particularly aluminum oxide and silica, significantly influences production costs. Furthermore, the need to constantly innovate and adapt to changing consumer preferences and regulatory changes adds to the complexities of operating in this sector.
Leading Players in the Anti-slip Additives Market Market
- Jotun
- PPG Industries Inc
- Vexcon Chemicals
- Rust-Oleum
- BYK (ALTANA)
- Akzo Nobel BV
- Axalta Coating Systems
- Hempel A/S
- Pro Chem Inc
- Associated Chemical
- SAICOS COLOR GmbH
Key Developments in Anti-slip Additives Market Sector
- [Month, Year]: Jotun launched a new line of anti-slip coatings with enhanced durability and UV resistance, expanding its product portfolio and catering to growing market demands for high-performance coatings.
- [Month, Year]: PPG Industries Inc. acquired a leading manufacturer of anti-slip additives, strengthening its market position and expanding its product portfolio. This strategic move broadened PPG's reach and capabilities within the industry.
- [Month, Year]: Vexcon Chemicals developed a new additive formula providing superior slip resistance in wet conditions, enhancing safety and meeting industry needs for improved performance in challenging environments.
Strategic Anti-slip Additives Market Market Outlook
The future of the anti-slip additives market appears promising, driven by consistent growth in construction, industrialization, and rising safety concerns. Strategic opportunities lie in developing innovative, sustainable, and high-performance additives. Focus on expanding into emerging markets and strengthening supply chains will be crucial for sustained growth. Companies that successfully adapt to technological advancements, regulatory changes, and shifting consumer preferences are well-positioned to capture a larger market share. The market's continued expansion is anticipated, driven by increasing demand for safety and durability in diverse applications.
Anti-slip Additives Market Segmentation
-
1. Additive Type
- 1.1. Aluminum oxide
- 1.2. Silica
- 1.3. Other Additive Types
-
2. Additive Nature
- 2.1. Powder
- 2.2. Aggregate
- 2.3. Mix
-
3. Application
- 3.1. Buildings and Construction
- 3.2. Industrial Flooring
- 3.3. Marine
- 3.4. Other Applications
Anti-slip Additives Market Segmentation By Geography
-
1. Asia Pacific
- 1.1. China
- 1.2. India
- 1.3. Japan
- 1.4. South Korea
- 1.5. Rest of Asia Pacific
-
2. North America
- 2.1. United States
- 2.2. Canada
- 2.3. Mexico
-
3. Europe
- 3.1. Germany
- 3.2. United Kingdom
- 3.3. France
- 3.4. Italy
- 3.5. Rest of Europe
-
4. South America
- 4.1. Brazil
- 4.2. Argentina
- 4.3. Rest of South America
-
5. Middle East and Africa
- 5.1. Saudi Arabia
- 5.2. South Africa
- 5.3. Rest of Middle East and Africa
Anti-slip Additives Market REPORT HIGHLIGHTS
| Aspects | Details |
|---|---|
| Study Period | 2019-2033 |
| Base Year | 2024 |
| Estimated Year | 2025 |
| Forecast Period | 2025-2033 |
| Historical Period | 2019-2024 |
| Growth Rate | CAGR of 4.00% from 2019-2033 |
| Segmentation |
|
Table of Contents
- 1. Introduction
- 1.1. Research Scope
- 1.2. Market Segmentation
- 1.3. Research Methodology
- 1.4. Definitions and Assumptions
- 2. Executive Summary
- 2.1. Introduction
- 3. Market Dynamics
- 3.1. Introduction
- 3.2. Market Drivers
- 3.2.1. ; Increasing Application in Industrial Flooring; Increasing Demand from the Marine Industry
- 3.3. Market Restrains
- 3.3.1. ; Stringent Environmental Regulations; Other Restraints
- 3.4. Market Trends
- 3.4.1. Growing Applications in Industrial Flooring
- 4. Market Factor Analysis
- 4.1. Porters Five Forces
- 4.2. Supply/Value Chain
- 4.3. PESTEL analysis
- 4.4. Market Entropy
- 4.5. Patent/Trademark Analysis
- 5. Global Anti-slip Additives Market Analysis, Insights and Forecast, 2019-2031
- 5.1. Market Analysis, Insights and Forecast - by Additive Type
- 5.1.1. Aluminum oxide
- 5.1.2. Silica
- 5.1.3. Other Additive Types
- 5.2. Market Analysis, Insights and Forecast - by Additive Nature
- 5.2.1. Powder
- 5.2.2. Aggregate
- 5.2.3. Mix
- 5.3. Market Analysis, Insights and Forecast - by Application
- 5.3.1. Buildings and Construction
- 5.3.2. Industrial Flooring
- 5.3.3. Marine
- 5.3.4. Other Applications
- 5.4. Market Analysis, Insights and Forecast - by Region
- 5.4.1. Asia Pacific
- 5.4.2. North America
- 5.4.3. Europe
- 5.4.4. South America
- 5.4.5. Middle East and Africa
- 5.1. Market Analysis, Insights and Forecast - by Additive Type
- 6. Asia Pacific Anti-slip Additives Market Analysis, Insights and Forecast, 2019-2031
- 6.1. Market Analysis, Insights and Forecast - by Additive Type
- 6.1.1. Aluminum oxide
- 6.1.2. Silica
- 6.1.3. Other Additive Types
- 6.2. Market Analysis, Insights and Forecast - by Additive Nature
- 6.2.1. Powder
- 6.2.2. Aggregate
- 6.2.3. Mix
- 6.3. Market Analysis, Insights and Forecast - by Application
- 6.3.1. Buildings and Construction
- 6.3.2. Industrial Flooring
- 6.3.3. Marine
- 6.3.4. Other Applications
- 6.1. Market Analysis, Insights and Forecast - by Additive Type
- 7. North America Anti-slip Additives Market Analysis, Insights and Forecast, 2019-2031
- 7.1. Market Analysis, Insights and Forecast - by Additive Type
- 7.1.1. Aluminum oxide
- 7.1.2. Silica
- 7.1.3. Other Additive Types
- 7.2. Market Analysis, Insights and Forecast - by Additive Nature
- 7.2.1. Powder
- 7.2.2. Aggregate
- 7.2.3. Mix
- 7.3. Market Analysis, Insights and Forecast - by Application
- 7.3.1. Buildings and Construction
- 7.3.2. Industrial Flooring
- 7.3.3. Marine
- 7.3.4. Other Applications
- 7.1. Market Analysis, Insights and Forecast - by Additive Type
- 8. Europe Anti-slip Additives Market Analysis, Insights and Forecast, 2019-2031
- 8.1. Market Analysis, Insights and Forecast - by Additive Type
- 8.1.1. Aluminum oxide
- 8.1.2. Silica
- 8.1.3. Other Additive Types
- 8.2. Market Analysis, Insights and Forecast - by Additive Nature
- 8.2.1. Powder
- 8.2.2. Aggregate
- 8.2.3. Mix
- 8.3. Market Analysis, Insights and Forecast - by Application
- 8.3.1. Buildings and Construction
- 8.3.2. Industrial Flooring
- 8.3.3. Marine
- 8.3.4. Other Applications
- 8.1. Market Analysis, Insights and Forecast - by Additive Type
- 9. South America Anti-slip Additives Market Analysis, Insights and Forecast, 2019-2031
- 9.1. Market Analysis, Insights and Forecast - by Additive Type
- 9.1.1. Aluminum oxide
- 9.1.2. Silica
- 9.1.3. Other Additive Types
- 9.2. Market Analysis, Insights and Forecast - by Additive Nature
- 9.2.1. Powder
- 9.2.2. Aggregate
- 9.2.3. Mix
- 9.3. Market Analysis, Insights and Forecast - by Application
- 9.3.1. Buildings and Construction
- 9.3.2. Industrial Flooring
- 9.3.3. Marine
- 9.3.4. Other Applications
- 9.1. Market Analysis, Insights and Forecast - by Additive Type
- 10. Middle East and Africa Anti-slip Additives Market Analysis, Insights and Forecast, 2019-2031
- 10.1. Market Analysis, Insights and Forecast - by Additive Type
- 10.1.1. Aluminum oxide
- 10.1.2. Silica
- 10.1.3. Other Additive Types
- 10.2. Market Analysis, Insights and Forecast - by Additive Nature
- 10.2.1. Powder
- 10.2.2. Aggregate
- 10.2.3. Mix
- 10.3. Market Analysis, Insights and Forecast - by Application
- 10.3.1. Buildings and Construction
- 10.3.2. Industrial Flooring
- 10.3.3. Marine
- 10.3.4. Other Applications
- 10.1. Market Analysis, Insights and Forecast - by Additive Type
- 11. Asia Pacific Anti-slip Additives Market Analysis, Insights and Forecast, 2019-2031
- 11.1. Market Analysis, Insights and Forecast - By Country/Sub-region
- 11.1.1 China
- 11.1.2 India
- 11.1.3 Japan
- 11.1.4 South Korea
- 11.1.5 Rest of Asia Pacific
- 12. North America Anti-slip Additives Market Analysis, Insights and Forecast, 2019-2031
- 12.1. Market Analysis, Insights and Forecast - By Country/Sub-region
- 12.1.1 United States
- 12.1.2 Canada
- 12.1.3 Mexico
- 13. Europe Anti-slip Additives Market Analysis, Insights and Forecast, 2019-2031
- 13.1. Market Analysis, Insights and Forecast - By Country/Sub-region
- 13.1.1 Germany
- 13.1.2 United Kingdom
- 13.1.3 France
- 13.1.4 Italy
- 13.1.5 Rest of Europe
- 14. South America Anti-slip Additives Market Analysis, Insights and Forecast, 2019-2031
- 14.1. Market Analysis, Insights and Forecast - By Country/Sub-region
- 14.1.1 Brazil
- 14.1.2 Argentina
- 14.1.3 Rest of South America
- 15. Middle East and Africa Anti-slip Additives Market Analysis, Insights and Forecast, 2019-2031
- 15.1. Market Analysis, Insights and Forecast - By Country/Sub-region
- 15.1.1 Saudi Arabia
- 15.1.2 South Africa
- 15.1.3 Rest of Middle East and Africa
- 16. Competitive Analysis
- 16.1. Global Market Share Analysis 2024
- 16.2. Company Profiles
- 16.2.1 Jotun
- 16.2.1.1. Overview
- 16.2.1.2. Products
- 16.2.1.3. SWOT Analysis
- 16.2.1.4. Recent Developments
- 16.2.1.5. Financials (Based on Availability)
- 16.2.2 PPG Industries Inc
- 16.2.2.1. Overview
- 16.2.2.2. Products
- 16.2.2.3. SWOT Analysis
- 16.2.2.4. Recent Developments
- 16.2.2.5. Financials (Based on Availability)
- 16.2.3 Vexcon Chemicals*List Not Exhaustive
- 16.2.3.1. Overview
- 16.2.3.2. Products
- 16.2.3.3. SWOT Analysis
- 16.2.3.4. Recent Developments
- 16.2.3.5. Financials (Based on Availability)
- 16.2.4 Rust-Oleum
- 16.2.4.1. Overview
- 16.2.4.2. Products
- 16.2.4.3. SWOT Analysis
- 16.2.4.4. Recent Developments
- 16.2.4.5. Financials (Based on Availability)
- 16.2.5 BYK (ALTANA)
- 16.2.5.1. Overview
- 16.2.5.2. Products
- 16.2.5.3. SWOT Analysis
- 16.2.5.4. Recent Developments
- 16.2.5.5. Financials (Based on Availability)
- 16.2.6 Akzo Nobel BV
- 16.2.6.1. Overview
- 16.2.6.2. Products
- 16.2.6.3. SWOT Analysis
- 16.2.6.4. Recent Developments
- 16.2.6.5. Financials (Based on Availability)
- 16.2.7 Axalta Coating Systems
- 16.2.7.1. Overview
- 16.2.7.2. Products
- 16.2.7.3. SWOT Analysis
- 16.2.7.4. Recent Developments
- 16.2.7.5. Financials (Based on Availability)
- 16.2.8 Hempel A/S
- 16.2.8.1. Overview
- 16.2.8.2. Products
- 16.2.8.3. SWOT Analysis
- 16.2.8.4. Recent Developments
- 16.2.8.5. Financials (Based on Availability)
- 16.2.9 Pro Chem Inc
- 16.2.9.1. Overview
- 16.2.9.2. Products
- 16.2.9.3. SWOT Analysis
- 16.2.9.4. Recent Developments
- 16.2.9.5. Financials (Based on Availability)
- 16.2.10 Associated Chemical
- 16.2.10.1. Overview
- 16.2.10.2. Products
- 16.2.10.3. SWOT Analysis
- 16.2.10.4. Recent Developments
- 16.2.10.5. Financials (Based on Availability)
- 16.2.11 SAICOS COLOR GmbH
- 16.2.11.1. Overview
- 16.2.11.2. Products
- 16.2.11.3. SWOT Analysis
- 16.2.11.4. Recent Developments
- 16.2.11.5. Financials (Based on Availability)
- 16.2.1 Jotun
List of Figures
- Figure 1: Global Anti-slip Additives Market Revenue Breakdown (Million, %) by Region 2024 & 2032
- Figure 2: Global Anti-slip Additives Market Volume Breakdown (K Tons, %) by Region 2024 & 2032
- Figure 3: Asia Pacific Anti-slip Additives Market Revenue (Million), by Country 2024 & 2032
- Figure 4: Asia Pacific Anti-slip Additives Market Volume (K Tons), by Country 2024 & 2032
- Figure 5: Asia Pacific Anti-slip Additives Market Revenue Share (%), by Country 2024 & 2032
- Figure 6: Asia Pacific Anti-slip Additives Market Volume Share (%), by Country 2024 & 2032
- Figure 7: North America Anti-slip Additives Market Revenue (Million), by Country 2024 & 2032
- Figure 8: North America Anti-slip Additives Market Volume (K Tons), by Country 2024 & 2032
- Figure 9: North America Anti-slip Additives Market Revenue Share (%), by Country 2024 & 2032
- Figure 10: North America Anti-slip Additives Market Volume Share (%), by Country 2024 & 2032
- Figure 11: Europe Anti-slip Additives Market Revenue (Million), by Country 2024 & 2032
- Figure 12: Europe Anti-slip Additives Market Volume (K Tons), by Country 2024 & 2032
- Figure 13: Europe Anti-slip Additives Market Revenue Share (%), by Country 2024 & 2032
- Figure 14: Europe Anti-slip Additives Market Volume Share (%), by Country 2024 & 2032
- Figure 15: South America Anti-slip Additives Market Revenue (Million), by Country 2024 & 2032
- Figure 16: South America Anti-slip Additives Market Volume (K Tons), by Country 2024 & 2032
- Figure 17: South America Anti-slip Additives Market Revenue Share (%), by Country 2024 & 2032
- Figure 18: South America Anti-slip Additives Market Volume Share (%), by Country 2024 & 2032
- Figure 19: Middle East and Africa Anti-slip Additives Market Revenue (Million), by Country 2024 & 2032
- Figure 20: Middle East and Africa Anti-slip Additives Market Volume (K Tons), by Country 2024 & 2032
- Figure 21: Middle East and Africa Anti-slip Additives Market Revenue Share (%), by Country 2024 & 2032
- Figure 22: Middle East and Africa Anti-slip Additives Market Volume Share (%), by Country 2024 & 2032
- Figure 23: Asia Pacific Anti-slip Additives Market Revenue (Million), by Additive Type 2024 & 2032
- Figure 24: Asia Pacific Anti-slip Additives Market Volume (K Tons), by Additive Type 2024 & 2032
- Figure 25: Asia Pacific Anti-slip Additives Market Revenue Share (%), by Additive Type 2024 & 2032
- Figure 26: Asia Pacific Anti-slip Additives Market Volume Share (%), by Additive Type 2024 & 2032
- Figure 27: Asia Pacific Anti-slip Additives Market Revenue (Million), by Additive Nature 2024 & 2032
- Figure 28: Asia Pacific Anti-slip Additives Market Volume (K Tons), by Additive Nature 2024 & 2032
- Figure 29: Asia Pacific Anti-slip Additives Market Revenue Share (%), by Additive Nature 2024 & 2032
- Figure 30: Asia Pacific Anti-slip Additives Market Volume Share (%), by Additive Nature 2024 & 2032
- Figure 31: Asia Pacific Anti-slip Additives Market Revenue (Million), by Application 2024 & 2032
- Figure 32: Asia Pacific Anti-slip Additives Market Volume (K Tons), by Application 2024 & 2032
- Figure 33: Asia Pacific Anti-slip Additives Market Revenue Share (%), by Application 2024 & 2032
- Figure 34: Asia Pacific Anti-slip Additives Market Volume Share (%), by Application 2024 & 2032
- Figure 35: Asia Pacific Anti-slip Additives Market Revenue (Million), by Country 2024 & 2032
- Figure 36: Asia Pacific Anti-slip Additives Market Volume (K Tons), by Country 2024 & 2032
- Figure 37: Asia Pacific Anti-slip Additives Market Revenue Share (%), by Country 2024 & 2032
- Figure 38: Asia Pacific Anti-slip Additives Market Volume Share (%), by Country 2024 & 2032
- Figure 39: North America Anti-slip Additives Market Revenue (Million), by Additive Type 2024 & 2032
- Figure 40: North America Anti-slip Additives Market Volume (K Tons), by Additive Type 2024 & 2032
- Figure 41: North America Anti-slip Additives Market Revenue Share (%), by Additive Type 2024 & 2032
- Figure 42: North America Anti-slip Additives Market Volume Share (%), by Additive Type 2024 & 2032
- Figure 43: North America Anti-slip Additives Market Revenue (Million), by Additive Nature 2024 & 2032
- Figure 44: North America Anti-slip Additives Market Volume (K Tons), by Additive Nature 2024 & 2032
- Figure 45: North America Anti-slip Additives Market Revenue Share (%), by Additive Nature 2024 & 2032
- Figure 46: North America Anti-slip Additives Market Volume Share (%), by Additive Nature 2024 & 2032
- Figure 47: North America Anti-slip Additives Market Revenue (Million), by Application 2024 & 2032
- Figure 48: North America Anti-slip Additives Market Volume (K Tons), by Application 2024 & 2032
- Figure 49: North America Anti-slip Additives Market Revenue Share (%), by Application 2024 & 2032
- Figure 50: North America Anti-slip Additives Market Volume Share (%), by Application 2024 & 2032
- Figure 51: North America Anti-slip Additives Market Revenue (Million), by Country 2024 & 2032
- Figure 52: North America Anti-slip Additives Market Volume (K Tons), by Country 2024 & 2032
- Figure 53: North America Anti-slip Additives Market Revenue Share (%), by Country 2024 & 2032
- Figure 54: North America Anti-slip Additives Market Volume Share (%), by Country 2024 & 2032
- Figure 55: Europe Anti-slip Additives Market Revenue (Million), by Additive Type 2024 & 2032
- Figure 56: Europe Anti-slip Additives Market Volume (K Tons), by Additive Type 2024 & 2032
- Figure 57: Europe Anti-slip Additives Market Revenue Share (%), by Additive Type 2024 & 2032
- Figure 58: Europe Anti-slip Additives Market Volume Share (%), by Additive Type 2024 & 2032
- Figure 59: Europe Anti-slip Additives Market Revenue (Million), by Additive Nature 2024 & 2032
- Figure 60: Europe Anti-slip Additives Market Volume (K Tons), by Additive Nature 2024 & 2032
- Figure 61: Europe Anti-slip Additives Market Revenue Share (%), by Additive Nature 2024 & 2032
- Figure 62: Europe Anti-slip Additives Market Volume Share (%), by Additive Nature 2024 & 2032
- Figure 63: Europe Anti-slip Additives Market Revenue (Million), by Application 2024 & 2032
- Figure 64: Europe Anti-slip Additives Market Volume (K Tons), by Application 2024 & 2032
- Figure 65: Europe Anti-slip Additives Market Revenue Share (%), by Application 2024 & 2032
- Figure 66: Europe Anti-slip Additives Market Volume Share (%), by Application 2024 & 2032
- Figure 67: Europe Anti-slip Additives Market Revenue (Million), by Country 2024 & 2032
- Figure 68: Europe Anti-slip Additives Market Volume (K Tons), by Country 2024 & 2032
- Figure 69: Europe Anti-slip Additives Market Revenue Share (%), by Country 2024 & 2032
- Figure 70: Europe Anti-slip Additives Market Volume Share (%), by Country 2024 & 2032
- Figure 71: South America Anti-slip Additives Market Revenue (Million), by Additive Type 2024 & 2032
- Figure 72: South America Anti-slip Additives Market Volume (K Tons), by Additive Type 2024 & 2032
- Figure 73: South America Anti-slip Additives Market Revenue Share (%), by Additive Type 2024 & 2032
- Figure 74: South America Anti-slip Additives Market Volume Share (%), by Additive Type 2024 & 2032
- Figure 75: South America Anti-slip Additives Market Revenue (Million), by Additive Nature 2024 & 2032
- Figure 76: South America Anti-slip Additives Market Volume (K Tons), by Additive Nature 2024 & 2032
- Figure 77: South America Anti-slip Additives Market Revenue Share (%), by Additive Nature 2024 & 2032
- Figure 78: South America Anti-slip Additives Market Volume Share (%), by Additive Nature 2024 & 2032
- Figure 79: South America Anti-slip Additives Market Revenue (Million), by Application 2024 & 2032
- Figure 80: South America Anti-slip Additives Market Volume (K Tons), by Application 2024 & 2032
- Figure 81: South America Anti-slip Additives Market Revenue Share (%), by Application 2024 & 2032
- Figure 82: South America Anti-slip Additives Market Volume Share (%), by Application 2024 & 2032
- Figure 83: South America Anti-slip Additives Market Revenue (Million), by Country 2024 & 2032
- Figure 84: South America Anti-slip Additives Market Volume (K Tons), by Country 2024 & 2032
- Figure 85: South America Anti-slip Additives Market Revenue Share (%), by Country 2024 & 2032
- Figure 86: South America Anti-slip Additives Market Volume Share (%), by Country 2024 & 2032
- Figure 87: Middle East and Africa Anti-slip Additives Market Revenue (Million), by Additive Type 2024 & 2032
- Figure 88: Middle East and Africa Anti-slip Additives Market Volume (K Tons), by Additive Type 2024 & 2032
- Figure 89: Middle East and Africa Anti-slip Additives Market Revenue Share (%), by Additive Type 2024 & 2032
- Figure 90: Middle East and Africa Anti-slip Additives Market Volume Share (%), by Additive Type 2024 & 2032
- Figure 91: Middle East and Africa Anti-slip Additives Market Revenue (Million), by Additive Nature 2024 & 2032
- Figure 92: Middle East and Africa Anti-slip Additives Market Volume (K Tons), by Additive Nature 2024 & 2032
- Figure 93: Middle East and Africa Anti-slip Additives Market Revenue Share (%), by Additive Nature 2024 & 2032
- Figure 94: Middle East and Africa Anti-slip Additives Market Volume Share (%), by Additive Nature 2024 & 2032
- Figure 95: Middle East and Africa Anti-slip Additives Market Revenue (Million), by Application 2024 & 2032
- Figure 96: Middle East and Africa Anti-slip Additives Market Volume (K Tons), by Application 2024 & 2032
- Figure 97: Middle East and Africa Anti-slip Additives Market Revenue Share (%), by Application 2024 & 2032
- Figure 98: Middle East and Africa Anti-slip Additives Market Volume Share (%), by Application 2024 & 2032
- Figure 99: Middle East and Africa Anti-slip Additives Market Revenue (Million), by Country 2024 & 2032
- Figure 100: Middle East and Africa Anti-slip Additives Market Volume (K Tons), by Country 2024 & 2032
- Figure 101: Middle East and Africa Anti-slip Additives Market Revenue Share (%), by Country 2024 & 2032
- Figure 102: Middle East and Africa Anti-slip Additives Market Volume Share (%), by Country 2024 & 2032
List of Tables
- Table 1: Global Anti-slip Additives Market Revenue Million Forecast, by Region 2019 & 2032
- Table 2: Global Anti-slip Additives Market Volume K Tons Forecast, by Region 2019 & 2032
- Table 3: Global Anti-slip Additives Market Revenue Million Forecast, by Additive Type 2019 & 2032
- Table 4: Global Anti-slip Additives Market Volume K Tons Forecast, by Additive Type 2019 & 2032
- Table 5: Global Anti-slip Additives Market Revenue Million Forecast, by Additive Nature 2019 & 2032
- Table 6: Global Anti-slip Additives Market Volume K Tons Forecast, by Additive Nature 2019 & 2032
- Table 7: Global Anti-slip Additives Market Revenue Million Forecast, by Application 2019 & 2032
- Table 8: Global Anti-slip Additives Market Volume K Tons Forecast, by Application 2019 & 2032
- Table 9: Global Anti-slip Additives Market Revenue Million Forecast, by Region 2019 & 2032
- Table 10: Global Anti-slip Additives Market Volume K Tons Forecast, by Region 2019 & 2032
- Table 11: Global Anti-slip Additives Market Revenue Million Forecast, by Country 2019 & 2032
- Table 12: Global Anti-slip Additives Market Volume K Tons Forecast, by Country 2019 & 2032
- Table 13: China Anti-slip Additives Market Revenue (Million) Forecast, by Application 2019 & 2032
- Table 14: China Anti-slip Additives Market Volume (K Tons) Forecast, by Application 2019 & 2032
- Table 15: India Anti-slip Additives Market Revenue (Million) Forecast, by Application 2019 & 2032
- Table 16: India Anti-slip Additives Market Volume (K Tons) Forecast, by Application 2019 & 2032
- Table 17: Japan Anti-slip Additives Market Revenue (Million) Forecast, by Application 2019 & 2032
- Table 18: Japan Anti-slip Additives Market Volume (K Tons) Forecast, by Application 2019 & 2032
- Table 19: South Korea Anti-slip Additives Market Revenue (Million) Forecast, by Application 2019 & 2032
- Table 20: South Korea Anti-slip Additives Market Volume (K Tons) Forecast, by Application 2019 & 2032
- Table 21: Rest of Asia Pacific Anti-slip Additives Market Revenue (Million) Forecast, by Application 2019 & 2032
- Table 22: Rest of Asia Pacific Anti-slip Additives Market Volume (K Tons) Forecast, by Application 2019 & 2032
- Table 23: Global Anti-slip Additives Market Revenue Million Forecast, by Country 2019 & 2032
- Table 24: Global Anti-slip Additives Market Volume K Tons Forecast, by Country 2019 & 2032
- Table 25: United States Anti-slip Additives Market Revenue (Million) Forecast, by Application 2019 & 2032
- Table 26: United States Anti-slip Additives Market Volume (K Tons) Forecast, by Application 2019 & 2032
- Table 27: Canada Anti-slip Additives Market Revenue (Million) Forecast, by Application 2019 & 2032
- Table 28: Canada Anti-slip Additives Market Volume (K Tons) Forecast, by Application 2019 & 2032
- Table 29: Mexico Anti-slip Additives Market Revenue (Million) Forecast, by Application 2019 & 2032
- Table 30: Mexico Anti-slip Additives Market Volume (K Tons) Forecast, by Application 2019 & 2032
- Table 31: Global Anti-slip Additives Market Revenue Million Forecast, by Country 2019 & 2032
- Table 32: Global Anti-slip Additives Market Volume K Tons Forecast, by Country 2019 & 2032
- Table 33: Germany Anti-slip Additives Market Revenue (Million) Forecast, by Application 2019 & 2032
- Table 34: Germany Anti-slip Additives Market Volume (K Tons) Forecast, by Application 2019 & 2032
- Table 35: United Kingdom Anti-slip Additives Market Revenue (Million) Forecast, by Application 2019 & 2032
- Table 36: United Kingdom Anti-slip Additives Market Volume (K Tons) Forecast, by Application 2019 & 2032
- Table 37: France Anti-slip Additives Market Revenue (Million) Forecast, by Application 2019 & 2032
- Table 38: France Anti-slip Additives Market Volume (K Tons) Forecast, by Application 2019 & 2032
- Table 39: Italy Anti-slip Additives Market Revenue (Million) Forecast, by Application 2019 & 2032
- Table 40: Italy Anti-slip Additives Market Volume (K Tons) Forecast, by Application 2019 & 2032
- Table 41: Rest of Europe Anti-slip Additives Market Revenue (Million) Forecast, by Application 2019 & 2032
- Table 42: Rest of Europe Anti-slip Additives Market Volume (K Tons) Forecast, by Application 2019 & 2032
- Table 43: Global Anti-slip Additives Market Revenue Million Forecast, by Country 2019 & 2032
- Table 44: Global Anti-slip Additives Market Volume K Tons Forecast, by Country 2019 & 2032
- Table 45: Brazil Anti-slip Additives Market Revenue (Million) Forecast, by Application 2019 & 2032
- Table 46: Brazil Anti-slip Additives Market Volume (K Tons) Forecast, by Application 2019 & 2032
- Table 47: Argentina Anti-slip Additives Market Revenue (Million) Forecast, by Application 2019 & 2032
- Table 48: Argentina Anti-slip Additives Market Volume (K Tons) Forecast, by Application 2019 & 2032
- Table 49: Rest of South America Anti-slip Additives Market Revenue (Million) Forecast, by Application 2019 & 2032
- Table 50: Rest of South America Anti-slip Additives Market Volume (K Tons) Forecast, by Application 2019 & 2032
- Table 51: Global Anti-slip Additives Market Revenue Million Forecast, by Country 2019 & 2032
- Table 52: Global Anti-slip Additives Market Volume K Tons Forecast, by Country 2019 & 2032
- Table 53: Saudi Arabia Anti-slip Additives Market Revenue (Million) Forecast, by Application 2019 & 2032
- Table 54: Saudi Arabia Anti-slip Additives Market Volume (K Tons) Forecast, by Application 2019 & 2032
- Table 55: South Africa Anti-slip Additives Market Revenue (Million) Forecast, by Application 2019 & 2032
- Table 56: South Africa Anti-slip Additives Market Volume (K Tons) Forecast, by Application 2019 & 2032
- Table 57: Rest of Middle East and Africa Anti-slip Additives Market Revenue (Million) Forecast, by Application 2019 & 2032
- Table 58: Rest of Middle East and Africa Anti-slip Additives Market Volume (K Tons) Forecast, by Application 2019 & 2032
- Table 59: Global Anti-slip Additives Market Revenue Million Forecast, by Additive Type 2019 & 2032
- Table 60: Global Anti-slip Additives Market Volume K Tons Forecast, by Additive Type 2019 & 2032
- Table 61: Global Anti-slip Additives Market Revenue Million Forecast, by Additive Nature 2019 & 2032
- Table 62: Global Anti-slip Additives Market Volume K Tons Forecast, by Additive Nature 2019 & 2032
- Table 63: Global Anti-slip Additives Market Revenue Million Forecast, by Application 2019 & 2032
- Table 64: Global Anti-slip Additives Market Volume K Tons Forecast, by Application 2019 & 2032
- Table 65: Global Anti-slip Additives Market Revenue Million Forecast, by Country 2019 & 2032
- Table 66: Global Anti-slip Additives Market Volume K Tons Forecast, by Country 2019 & 2032
- Table 67: China Anti-slip Additives Market Revenue (Million) Forecast, by Application 2019 & 2032
- Table 68: China Anti-slip Additives Market Volume (K Tons) Forecast, by Application 2019 & 2032
- Table 69: India Anti-slip Additives Market Revenue (Million) Forecast, by Application 2019 & 2032
- Table 70: India Anti-slip Additives Market Volume (K Tons) Forecast, by Application 2019 & 2032
- Table 71: Japan Anti-slip Additives Market Revenue (Million) Forecast, by Application 2019 & 2032
- Table 72: Japan Anti-slip Additives Market Volume (K Tons) Forecast, by Application 2019 & 2032
- Table 73: South Korea Anti-slip Additives Market Revenue (Million) Forecast, by Application 2019 & 2032
- Table 74: South Korea Anti-slip Additives Market Volume (K Tons) Forecast, by Application 2019 & 2032
- Table 75: Rest of Asia Pacific Anti-slip Additives Market Revenue (Million) Forecast, by Application 2019 & 2032
- Table 76: Rest of Asia Pacific Anti-slip Additives Market Volume (K Tons) Forecast, by Application 2019 & 2032
- Table 77: Global Anti-slip Additives Market Revenue Million Forecast, by Additive Type 2019 & 2032
- Table 78: Global Anti-slip Additives Market Volume K Tons Forecast, by Additive Type 2019 & 2032
- Table 79: Global Anti-slip Additives Market Revenue Million Forecast, by Additive Nature 2019 & 2032
- Table 80: Global Anti-slip Additives Market Volume K Tons Forecast, by Additive Nature 2019 & 2032
- Table 81: Global Anti-slip Additives Market Revenue Million Forecast, by Application 2019 & 2032
- Table 82: Global Anti-slip Additives Market Volume K Tons Forecast, by Application 2019 & 2032
- Table 83: Global Anti-slip Additives Market Revenue Million Forecast, by Country 2019 & 2032
- Table 84: Global Anti-slip Additives Market Volume K Tons Forecast, by Country 2019 & 2032
- Table 85: United States Anti-slip Additives Market Revenue (Million) Forecast, by Application 2019 & 2032
- Table 86: United States Anti-slip Additives Market Volume (K Tons) Forecast, by Application 2019 & 2032
- Table 87: Canada Anti-slip Additives Market Revenue (Million) Forecast, by Application 2019 & 2032
- Table 88: Canada Anti-slip Additives Market Volume (K Tons) Forecast, by Application 2019 & 2032
- Table 89: Mexico Anti-slip Additives Market Revenue (Million) Forecast, by Application 2019 & 2032
- Table 90: Mexico Anti-slip Additives Market Volume (K Tons) Forecast, by Application 2019 & 2032
- Table 91: Global Anti-slip Additives Market Revenue Million Forecast, by Additive Type 2019 & 2032
- Table 92: Global Anti-slip Additives Market Volume K Tons Forecast, by Additive Type 2019 & 2032
- Table 93: Global Anti-slip Additives Market Revenue Million Forecast, by Additive Nature 2019 & 2032
- Table 94: Global Anti-slip Additives Market Volume K Tons Forecast, by Additive Nature 2019 & 2032
- Table 95: Global Anti-slip Additives Market Revenue Million Forecast, by Application 2019 & 2032
- Table 96: Global Anti-slip Additives Market Volume K Tons Forecast, by Application 2019 & 2032
- Table 97: Global Anti-slip Additives Market Revenue Million Forecast, by Country 2019 & 2032
- Table 98: Global Anti-slip Additives Market Volume K Tons Forecast, by Country 2019 & 2032
- Table 99: Germany Anti-slip Additives Market Revenue (Million) Forecast, by Application 2019 & 2032
- Table 100: Germany Anti-slip Additives Market Volume (K Tons) Forecast, by Application 2019 & 2032
- Table 101: United Kingdom Anti-slip Additives Market Revenue (Million) Forecast, by Application 2019 & 2032
- Table 102: United Kingdom Anti-slip Additives Market Volume (K Tons) Forecast, by Application 2019 & 2032
- Table 103: France Anti-slip Additives Market Revenue (Million) Forecast, by Application 2019 & 2032
- Table 104: France Anti-slip Additives Market Volume (K Tons) Forecast, by Application 2019 & 2032
- Table 105: Italy Anti-slip Additives Market Revenue (Million) Forecast, by Application 2019 & 2032
- Table 106: Italy Anti-slip Additives Market Volume (K Tons) Forecast, by Application 2019 & 2032
- Table 107: Rest of Europe Anti-slip Additives Market Revenue (Million) Forecast, by Application 2019 & 2032
- Table 108: Rest of Europe Anti-slip Additives Market Volume (K Tons) Forecast, by Application 2019 & 2032
- Table 109: Global Anti-slip Additives Market Revenue Million Forecast, by Additive Type 2019 & 2032
- Table 110: Global Anti-slip Additives Market Volume K Tons Forecast, by Additive Type 2019 & 2032
- Table 111: Global Anti-slip Additives Market Revenue Million Forecast, by Additive Nature 2019 & 2032
- Table 112: Global Anti-slip Additives Market Volume K Tons Forecast, by Additive Nature 2019 & 2032
- Table 113: Global Anti-slip Additives Market Revenue Million Forecast, by Application 2019 & 2032
- Table 114: Global Anti-slip Additives Market Volume K Tons Forecast, by Application 2019 & 2032
- Table 115: Global Anti-slip Additives Market Revenue Million Forecast, by Country 2019 & 2032
- Table 116: Global Anti-slip Additives Market Volume K Tons Forecast, by Country 2019 & 2032
- Table 117: Brazil Anti-slip Additives Market Revenue (Million) Forecast, by Application 2019 & 2032
- Table 118: Brazil Anti-slip Additives Market Volume (K Tons) Forecast, by Application 2019 & 2032
- Table 119: Argentina Anti-slip Additives Market Revenue (Million) Forecast, by Application 2019 & 2032
- Table 120: Argentina Anti-slip Additives Market Volume (K Tons) Forecast, by Application 2019 & 2032
- Table 121: Rest of South America Anti-slip Additives Market Revenue (Million) Forecast, by Application 2019 & 2032
- Table 122: Rest of South America Anti-slip Additives Market Volume (K Tons) Forecast, by Application 2019 & 2032
- Table 123: Global Anti-slip Additives Market Revenue Million Forecast, by Additive Type 2019 & 2032
- Table 124: Global Anti-slip Additives Market Volume K Tons Forecast, by Additive Type 2019 & 2032
- Table 125: Global Anti-slip Additives Market Revenue Million Forecast, by Additive Nature 2019 & 2032
- Table 126: Global Anti-slip Additives Market Volume K Tons Forecast, by Additive Nature 2019 & 2032
- Table 127: Global Anti-slip Additives Market Revenue Million Forecast, by Application 2019 & 2032
- Table 128: Global Anti-slip Additives Market Volume K Tons Forecast, by Application 2019 & 2032
- Table 129: Global Anti-slip Additives Market Revenue Million Forecast, by Country 2019 & 2032
- Table 130: Global Anti-slip Additives Market Volume K Tons Forecast, by Country 2019 & 2032
- Table 131: Saudi Arabia Anti-slip Additives Market Revenue (Million) Forecast, by Application 2019 & 2032
- Table 132: Saudi Arabia Anti-slip Additives Market Volume (K Tons) Forecast, by Application 2019 & 2032
- Table 133: South Africa Anti-slip Additives Market Revenue (Million) Forecast, by Application 2019 & 2032
- Table 134: South Africa Anti-slip Additives Market Volume (K Tons) Forecast, by Application 2019 & 2032
- Table 135: Rest of Middle East and Africa Anti-slip Additives Market Revenue (Million) Forecast, by Application 2019 & 2032
- Table 136: Rest of Middle East and Africa Anti-slip Additives Market Volume (K Tons) Forecast, by Application 2019 & 2032
Frequently Asked Questions
1. What is the projected Compound Annual Growth Rate (CAGR) of the Anti-slip Additives Market?
The projected CAGR is approximately 4.00%.
2. Which companies are prominent players in the Anti-slip Additives Market?
Key companies in the market include Jotun, PPG Industries Inc, Vexcon Chemicals*List Not Exhaustive, Rust-Oleum, BYK (ALTANA), Akzo Nobel BV, Axalta Coating Systems, Hempel A/S, Pro Chem Inc, Associated Chemical, SAICOS COLOR GmbH.
3. What are the main segments of the Anti-slip Additives Market?
The market segments include Additive Type, Additive Nature, Application.
4. Can you provide details about the market size?
The market size is estimated to be USD 389.52 Million as of 2022.
5. What are some drivers contributing to market growth?
; Increasing Application in Industrial Flooring; Increasing Demand from the Marine Industry.
6. What are the notable trends driving market growth?
Growing Applications in Industrial Flooring.
7. Are there any restraints impacting market growth?
; Stringent Environmental Regulations; Other Restraints.
8. Can you provide examples of recent developments in the market?
Recent developments in the Anti-slip Additives Market include: Jotun launched a new line of anti-slip coatings with enhanced durability and UV resistance. PPG Industries acquired a leading manufacturer of anti-slip additives to expand its product portfolio. Vexcon Chemicals developed a new additive formula that provides superior slip resistance in wet conditions.
9. What pricing options are available for accessing the report?
Pricing options include single-user, multi-user, and enterprise licenses priced at USD 4750, USD 5250, and USD 8750 respectively.
10. Is the market size provided in terms of value or volume?
The market size is provided in terms of value, measured in Million and volume, measured in K Tons.
11. Are there any specific market keywords associated with the report?
Yes, the market keyword associated with the report is "Anti-slip Additives Market," which aids in identifying and referencing the specific market segment covered.
12. How do I determine which pricing option suits my needs best?
The pricing options vary based on user requirements and access needs. Individual users may opt for single-user licenses, while businesses requiring broader access may choose multi-user or enterprise licenses for cost-effective access to the report.
13. Are there any additional resources or data provided in the Anti-slip Additives Market report?
While the report offers comprehensive insights, it's advisable to review the specific contents or supplementary materials provided to ascertain if additional resources or data are available.
14. How can I stay updated on further developments or reports in the Anti-slip Additives Market?
To stay informed about further developments, trends, and reports in the Anti-slip Additives Market, consider subscribing to industry newsletters, following relevant companies and organizations, or regularly checking reputable industry news sources and publications.
Methodology
Step 1 - Identification of Relevant Samples Size from Population Database


Step 2 - Approaches for Defining Global Market Size (Value, Volume* & Price*)

Note*: In applicable scenarios
Step 3 - Data Sources
Primary Research
- Web Analytics
- Survey Reports
- Research Institute
- Latest Research Reports
- Opinion Leaders
Secondary Research
- Annual Reports
- White Paper
- Latest Press Release
- Industry Association
- Paid Database
- Investor Presentations

Step 4 - Data Triangulation
Involves using different sources of information in order to increase the validity of a study
These sources are likely to be stakeholders in a program - participants, other researchers, program staff, other community members, and so on.
Then we put all data in single framework & apply various statistical tools to find out the dynamic on the market.
During the analysis stage, feedback from the stakeholder groups would be compared to determine areas of agreement as well as areas of divergence


