
Key Insights
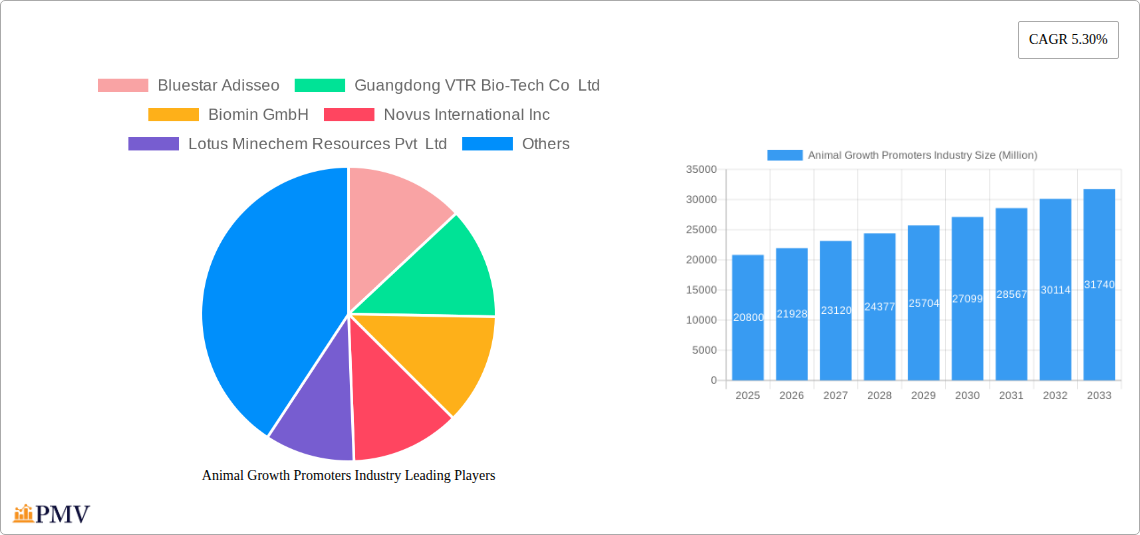
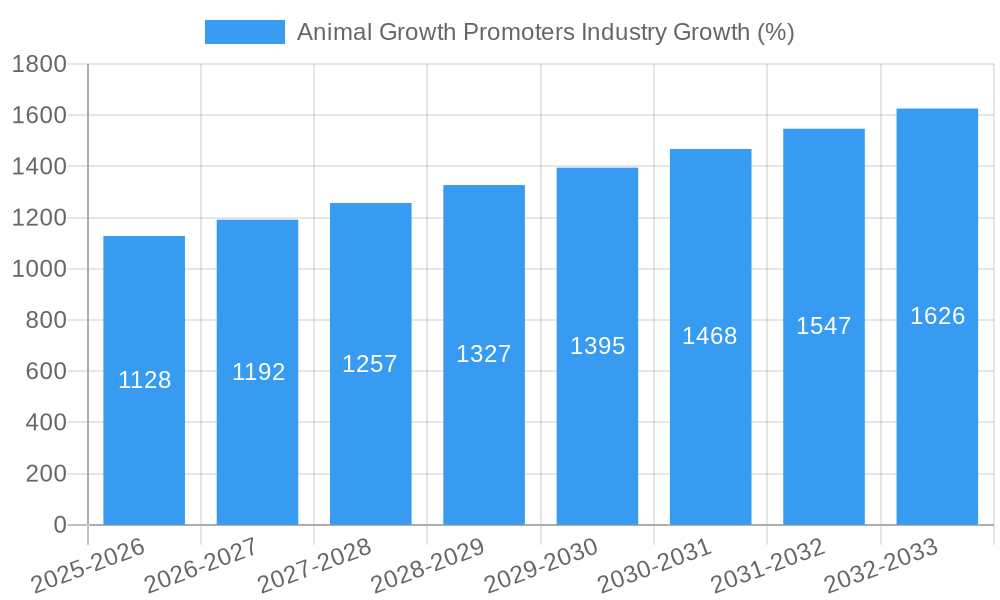
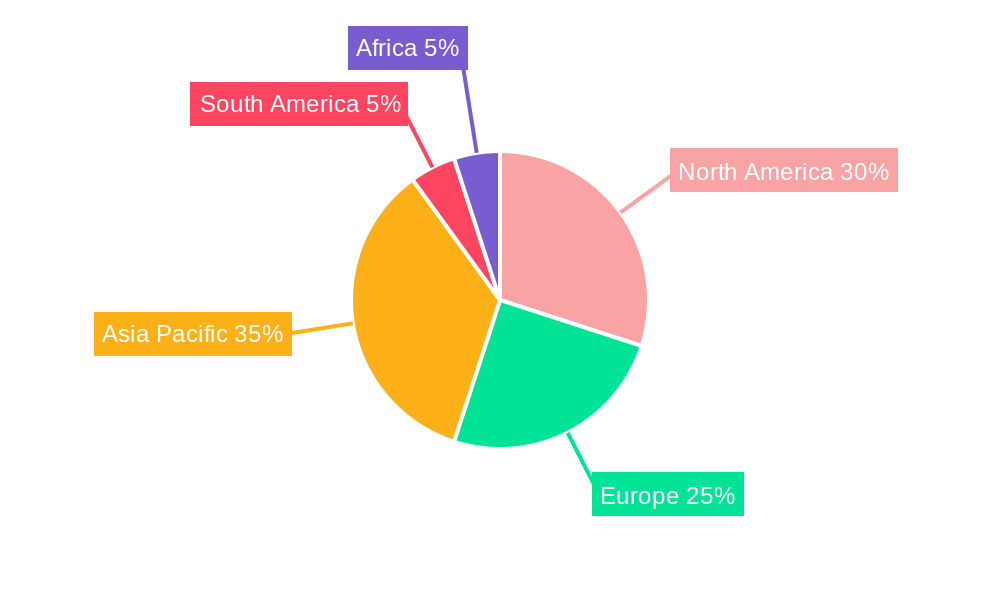
The global animal growth promoters market, valued at $20.80 billion in 2025, is projected to experience robust growth, driven by the increasing demand for animal protein and the need for efficient and sustainable livestock production. A compound annual growth rate (CAGR) of 5.30% is anticipated from 2025 to 2033, indicating a significant market expansion. This growth is fueled by several key factors. Firstly, the rising global population necessitates increased meat and poultry production, creating a higher demand for animal growth promoters to enhance feed efficiency and animal productivity. Secondly, advancements in biotechnology and the development of novel, more effective promoters, such as advanced probiotics and prebiotics with tailored functionalities, are driving market expansion. Furthermore, stringent regulations regarding antibiotic use in animal feed are pushing the adoption of alternative growth promoters, creating a significant opportunity for the market. The market is segmented by animal type (ruminants, poultry, swine, aquaculture, others) and type of promoter (probiotics, prebiotics, phytogenics, acidifiers, others). Poultry and swine segments are expected to dominate due to their higher production volumes and greater susceptibility to disease, necessitating the use of growth promoters for improved health and yield. Geographically, North America and Europe currently hold significant market share, however, the Asia-Pacific region is anticipated to experience the fastest growth, driven by increasing livestock farming activities and rising consumer demand in developing economies. Competition is intense, with major players like BASF, Cargill, and DSM constantly innovating and expanding their product portfolios to cater to specific animal types and regional needs.
The market faces certain challenges, however. Fluctuations in raw material prices can impact profitability, and regulatory changes concerning the use of specific growth promoters pose ongoing risks. Consumer concerns about the safety and potential health impacts of certain additives also present a challenge. Companies are therefore increasingly focusing on developing natural and sustainable alternatives that meet both productivity needs and consumer expectations. Despite these challenges, the long-term outlook for the animal growth promoters market remains positive, driven by sustained demand for animal protein and the continuous development of innovative and sustainable solutions. Strategic partnerships, mergers, and acquisitions will likely shape the competitive landscape in the coming years.
Animal Growth Promoters Industry: A Comprehensive Market Report (2019-2033)
This comprehensive report provides an in-depth analysis of the global Animal Growth Promoters industry, offering valuable insights for stakeholders, investors, and industry professionals. The report covers the period 2019-2033, with a focus on the forecast period 2025-2033 and a base year of 2025. The market is segmented by animal type (ruminant, poultry, swine, aquaculture, other animal types) and product type (probiotics, prebiotics, phytogenics, acidifiers, other types). Key players like Bluestar Adisseo, Guangdong VTR Bio-Tech Co Ltd, and Biomin GmbH are analyzed, along with market trends, challenges, and future growth prospects. The total market size is projected to reach xx Million by 2033.
Animal Growth Promoters Industry Market Structure & Competitive Dynamics
The global animal growth promoters market exhibits a moderately concentrated structure, with a few major players holding significant market share. The top five companies, including Bluestar Adisseo, Guangdong VTR Bio-Tech Co Ltd, Biomin GmbH, Novus International Inc, and Kemin Industries, collectively account for approximately xx% of the market in 2025. Innovation within the industry is driven by ongoing research and development in areas like probiotic strains, prebiotic formulations, and advanced phytogenic blends. Regulatory frameworks vary across regions, impacting product approvals and market access. Competition is intense, with companies focusing on product differentiation, cost optimization, and strategic partnerships. Product substitutes, such as hormone-based growth promoters (where permitted), pose a competitive threat. End-user trends, such as increasing demand for sustainable and environmentally friendly animal feed solutions, are shaping industry strategies. The historical period (2019-2024) witnessed several M&A activities, with deal values totaling approximately xx Million. These activities have been aimed at expanding product portfolios and geographical reach. Future M&A activity is expected to remain robust, driven by the desire for consolidation and increased market share. The market share distribution among leading players is expected to shift slightly by 2033, with companies investing heavily in research and development gaining a competitive edge.
Animal Growth Promoters Industry Industry Trends & Insights
The animal growth promoters market is experiencing robust growth, driven by several key factors. The rising global demand for animal protein, particularly poultry and pork, is a major catalyst. Technological advancements in areas such as precision fermentation and microbiome analysis are leading to the development of novel and more effective animal growth promoters. Consumer preferences for natural and sustainable products are driving the demand for phytogenics and probiotics. Increasing awareness of the benefits of gut health in animal production is further fueling market growth. The market is projected to achieve a Compound Annual Growth Rate (CAGR) of xx% during the forecast period (2025-2033). The market penetration of probiotics in poultry feed is particularly high, estimated at xx% in 2025, reflecting the efficacy and consumer acceptance of these products. However, the market faces challenges from regulatory scrutiny on certain product types, potentially leading to variations in market growth across regions. The competitive landscape is dynamic, with companies continuously innovating and expanding their product offerings to cater to evolving market demands.
Dominant Markets & Segments in Animal Growth Promoters Industry
The poultry segment currently dominates the animal growth promoters market, driven by high poultry consumption globally and the efficacy of various promoters in enhancing growth and feed efficiency. Within the poultry segment, probiotics and acidifiers are particularly popular due to their perceived safety and efficacy. China and other rapidly developing economies in Asia are key growth markets due to their high poultry production levels and increasing adoption of animal growth promoters. Key drivers in these regions include:
- Rapidly expanding poultry industry: Significant growth in poultry farming to meet the rising demand for protein.
- Government support for livestock development: Policies promoting sustainable and efficient animal farming practices.
- Improving infrastructure and logistics: Enhanced supply chains facilitating the distribution of animal growth promoters.
The ruminant segment is also experiencing significant growth, although at a slower pace than poultry, driven by the need to enhance feed efficiency and milk production. In contrast, the aquaculture segment exhibits lower market penetration but demonstrates high growth potential due to the growing global demand for seafood.
Animal Growth Promoters Industry Product Innovations
Recent product innovations focus on developing highly specific and targeted animal growth promoters, utilizing advanced technologies like precision fermentation and microbiome engineering to create tailored solutions for different animal species and their specific needs. This trend aims at maximizing efficacy and minimizing environmental impact. Phytogenics are gaining traction due to their natural origin and growing consumer preference for natural feed additives. Companies are also focusing on creating synergistic combinations of different product types to enhance their overall effectiveness and provide comprehensive gut health solutions. This includes formulations that combine probiotics, prebiotics, and phytogenics to achieve optimal animal growth and overall health.
Report Segmentation & Scope
This report segments the animal growth promoters market by animal type: ruminant, poultry, swine, aquaculture, and other animal types. Each segment is further divided by product type: probiotics, prebiotics, phytogenics, acidifiers, and other types. The poultry segment is expected to experience the highest growth, followed by swine and ruminants. The probiotics segment is projected to dominate the product type market due to their proven efficacy and growing consumer preference for natural solutions. Each segment's growth is influenced by various factors such as regional regulations, consumer demand, and advancements in product technology. The competitive landscape varies across segments, with some dominated by a few large players, while others exhibit more fragmented competition.
Key Drivers of Animal Growth Promoters Industry Growth
Several factors drive the growth of the animal growth promoters market. The rising global population and increasing demand for animal protein are key factors. Government initiatives promoting sustainable and efficient animal farming practices also contribute to market expansion. Technological advancements leading to improved product efficacy and cost-effectiveness further stimulate growth. Furthermore, increasing awareness of the importance of animal gut health is driving the adoption of probiotics and other beneficial additives.
Challenges in the Animal Growth Promoters Industry Sector
The animal growth promoters industry faces several challenges, including stringent regulatory frameworks that can hinder product approvals and market access. Supply chain disruptions and fluctuations in raw material prices can also impact profitability. Intense competition and the emergence of innovative substitutes create pressure on pricing and market share. These factors, combined with consumer preference shifts towards more natural and sustainable solutions, require companies to constantly adapt their strategies to remain competitive.
Leading Players in the Animal Growth Promoters Industry Market
- Bluestar Adisseo
- Guangdong VTR Bio-Tech Co Ltd
- Biomin GmbH
- Novus International Inc
- Lotus Minechem Resources Pvt Ltd
- Kemin Industries
- Chr Hansen A/
- BASF SE
- DSM
- Alltech Inc
- Dupont De Nemours Inc
- Cargill Inc
- Novozymes A/S
- Elanco Animal Health Incorporated
- Zoetis Inc
Key Developments in Animal Growth Promoters Industry Sector
- 2022 Q4: Launch of a novel probiotic blend by Biomin GmbH targeting improved gut health in poultry.
- 2023 Q1: Acquisition of a smaller phytogenic producer by Novus International Inc, expanding their product portfolio.
- 2023 Q2: Publication of research highlighting the effectiveness of a specific prebiotic in swine production by DSM. (Further updates will be added as available)
Strategic Animal Growth Promoters Industry Market Outlook
The animal growth promoters market presents significant growth opportunities, driven by increasing demand for animal protein and ongoing innovation in product development. Strategic partnerships and acquisitions will continue to shape the industry landscape. Companies focusing on sustainability, natural ingredients, and data-driven solutions will gain a competitive edge. The increasing focus on precision livestock farming will also influence market growth, creating demand for customized solutions tailored to specific animal needs. The overall outlook is positive, with substantial growth potential across various segments and geographies.
Animal Growth Promoters Industry Segmentation
-
1. Type
- 1.1. Probiotics
- 1.2. Prebiotics
- 1.3. Phytogenics
- 1.4. Acidifiers
- 1.5. Other Types
-
2. Animal Type
- 2.1. Ruminant
- 2.2. Poultry
- 2.3. Swine
- 2.4. Aquaculture
- 2.5. Other Animal Types
Animal Growth Promoters Industry Segmentation By Geography
-
1. North America
- 1.1. United States
- 1.2. Canada
- 1.3. Mexico
- 1.4. Rest of North America
-
2. Europe
- 2.1. Germany
- 2.2. United Kingdom
- 2.3. France
- 2.4. Russia
- 2.5. Spain
- 2.6. Rest of Europe
-
3. Asia Pacific
- 3.1. China
- 3.2. Japan
- 3.3. India
- 3.4. Australia
- 3.5. Rest of Asia Pacific
-
4. South America
- 4.1. Brazil
- 4.2. Argentina
- 4.3. Rest of South America
-
5. Africa
- 5.1. South Africa
- 5.2. Rest of Africa
Animal Growth Promoters Industry REPORT HIGHLIGHTS
| Aspects | Details |
|---|---|
| Study Period | 2019-2033 |
| Base Year | 2024 |
| Estimated Year | 2025 |
| Forecast Period | 2025-2033 |
| Historical Period | 2019-2024 |
| Growth Rate | CAGR of 5.30% from 2019-2033 |
| Segmentation |
|
Table of Contents
- 1. Introduction
- 1.1. Research Scope
- 1.2. Market Segmentation
- 1.3. Research Methodology
- 1.4. Definitions and Assumptions
- 2. Executive Summary
- 2.1. Introduction
- 3. Market Dynamics
- 3.1. Introduction
- 3.2. Market Drivers
- 3.2.1. Increased Demand for Meat; Initiatives By the Key Players; Focus on Animal nutrition and Health
- 3.3. Market Restrains
- 3.3.1. Shift Toward Vegan- Based Diet; Changing Raw Material Prices and Strict Government Rules to Restrict Market Growth
- 3.4. Market Trends
- 3.4.1. The Rise in Demand for Meat Boosting the Market
- 4. Market Factor Analysis
- 4.1. Porters Five Forces
- 4.2. Supply/Value Chain
- 4.3. PESTEL analysis
- 4.4. Market Entropy
- 4.5. Patent/Trademark Analysis
- 5. Global Animal Growth Promoters Industry Analysis, Insights and Forecast, 2019-2031
- 5.1. Market Analysis, Insights and Forecast - by Type
- 5.1.1. Probiotics
- 5.1.2. Prebiotics
- 5.1.3. Phytogenics
- 5.1.4. Acidifiers
- 5.1.5. Other Types
- 5.2. Market Analysis, Insights and Forecast - by Animal Type
- 5.2.1. Ruminant
- 5.2.2. Poultry
- 5.2.3. Swine
- 5.2.4. Aquaculture
- 5.2.5. Other Animal Types
- 5.3. Market Analysis, Insights and Forecast - by Region
- 5.3.1. North America
- 5.3.2. Europe
- 5.3.3. Asia Pacific
- 5.3.4. South America
- 5.3.5. Africa
- 5.1. Market Analysis, Insights and Forecast - by Type
- 6. North America Animal Growth Promoters Industry Analysis, Insights and Forecast, 2019-2031
- 6.1. Market Analysis, Insights and Forecast - by Type
- 6.1.1. Probiotics
- 6.1.2. Prebiotics
- 6.1.3. Phytogenics
- 6.1.4. Acidifiers
- 6.1.5. Other Types
- 6.2. Market Analysis, Insights and Forecast - by Animal Type
- 6.2.1. Ruminant
- 6.2.2. Poultry
- 6.2.3. Swine
- 6.2.4. Aquaculture
- 6.2.5. Other Animal Types
- 6.1. Market Analysis, Insights and Forecast - by Type
- 7. Europe Animal Growth Promoters Industry Analysis, Insights and Forecast, 2019-2031
- 7.1. Market Analysis, Insights and Forecast - by Type
- 7.1.1. Probiotics
- 7.1.2. Prebiotics
- 7.1.3. Phytogenics
- 7.1.4. Acidifiers
- 7.1.5. Other Types
- 7.2. Market Analysis, Insights and Forecast - by Animal Type
- 7.2.1. Ruminant
- 7.2.2. Poultry
- 7.2.3. Swine
- 7.2.4. Aquaculture
- 7.2.5. Other Animal Types
- 7.1. Market Analysis, Insights and Forecast - by Type
- 8. Asia Pacific Animal Growth Promoters Industry Analysis, Insights and Forecast, 2019-2031
- 8.1. Market Analysis, Insights and Forecast - by Type
- 8.1.1. Probiotics
- 8.1.2. Prebiotics
- 8.1.3. Phytogenics
- 8.1.4. Acidifiers
- 8.1.5. Other Types
- 8.2. Market Analysis, Insights and Forecast - by Animal Type
- 8.2.1. Ruminant
- 8.2.2. Poultry
- 8.2.3. Swine
- 8.2.4. Aquaculture
- 8.2.5. Other Animal Types
- 8.1. Market Analysis, Insights and Forecast - by Type
- 9. South America Animal Growth Promoters Industry Analysis, Insights and Forecast, 2019-2031
- 9.1. Market Analysis, Insights and Forecast - by Type
- 9.1.1. Probiotics
- 9.1.2. Prebiotics
- 9.1.3. Phytogenics
- 9.1.4. Acidifiers
- 9.1.5. Other Types
- 9.2. Market Analysis, Insights and Forecast - by Animal Type
- 9.2.1. Ruminant
- 9.2.2. Poultry
- 9.2.3. Swine
- 9.2.4. Aquaculture
- 9.2.5. Other Animal Types
- 9.1. Market Analysis, Insights and Forecast - by Type
- 10. Africa Animal Growth Promoters Industry Analysis, Insights and Forecast, 2019-2031
- 10.1. Market Analysis, Insights and Forecast - by Type
- 10.1.1. Probiotics
- 10.1.2. Prebiotics
- 10.1.3. Phytogenics
- 10.1.4. Acidifiers
- 10.1.5. Other Types
- 10.2. Market Analysis, Insights and Forecast - by Animal Type
- 10.2.1. Ruminant
- 10.2.2. Poultry
- 10.2.3. Swine
- 10.2.4. Aquaculture
- 10.2.5. Other Animal Types
- 10.1. Market Analysis, Insights and Forecast - by Type
- 11. North America Animal Growth Promoters Industry Analysis, Insights and Forecast, 2019-2031
- 11.1. Market Analysis, Insights and Forecast - By Country/Sub-region
- 11.1.1 United States
- 11.1.2 Canada
- 11.1.3 Mexico
- 11.1.4 Rest of North America
- 12. Europe Animal Growth Promoters Industry Analysis, Insights and Forecast, 2019-2031
- 12.1. Market Analysis, Insights and Forecast - By Country/Sub-region
- 12.1.1 Germany
- 12.1.2 United Kingdom
- 12.1.3 France
- 12.1.4 Russia
- 12.1.5 Spain
- 12.1.6 Rest of Europe
- 13. Asia Pacific Animal Growth Promoters Industry Analysis, Insights and Forecast, 2019-2031
- 13.1. Market Analysis, Insights and Forecast - By Country/Sub-region
- 13.1.1 China
- 13.1.2 Japan
- 13.1.3 India
- 13.1.4 Australia
- 13.1.5 Rest of Asia Pacific
- 14. South America Animal Growth Promoters Industry Analysis, Insights and Forecast, 2019-2031
- 14.1. Market Analysis, Insights and Forecast - By Country/Sub-region
- 14.1.1 Brazil
- 14.1.2 Argentina
- 14.1.3 Rest of South America
- 15. Africa Animal Growth Promoters Industry Analysis, Insights and Forecast, 2019-2031
- 15.1. Market Analysis, Insights and Forecast - By Country/Sub-region
- 15.1.1 South Africa
- 15.1.2 Rest of Africa
- 16. Competitive Analysis
- 16.1. Global Market Share Analysis 2024
- 16.2. Company Profiles
- 16.2.1 Bluestar Adisseo
- 16.2.1.1. Overview
- 16.2.1.2. Products
- 16.2.1.3. SWOT Analysis
- 16.2.1.4. Recent Developments
- 16.2.1.5. Financials (Based on Availability)
- 16.2.2 Guangdong VTR Bio-Tech Co Ltd
- 16.2.2.1. Overview
- 16.2.2.2. Products
- 16.2.2.3. SWOT Analysis
- 16.2.2.4. Recent Developments
- 16.2.2.5. Financials (Based on Availability)
- 16.2.3 Biomin GmbH
- 16.2.3.1. Overview
- 16.2.3.2. Products
- 16.2.3.3. SWOT Analysis
- 16.2.3.4. Recent Developments
- 16.2.3.5. Financials (Based on Availability)
- 16.2.4 Novus International Inc
- 16.2.4.1. Overview
- 16.2.4.2. Products
- 16.2.4.3. SWOT Analysis
- 16.2.4.4. Recent Developments
- 16.2.4.5. Financials (Based on Availability)
- 16.2.5 Lotus Minechem Resources Pvt Ltd
- 16.2.5.1. Overview
- 16.2.5.2. Products
- 16.2.5.3. SWOT Analysis
- 16.2.5.4. Recent Developments
- 16.2.5.5. Financials (Based on Availability)
- 16.2.6 Kemin Industries
- 16.2.6.1. Overview
- 16.2.6.2. Products
- 16.2.6.3. SWOT Analysis
- 16.2.6.4. Recent Developments
- 16.2.6.5. Financials (Based on Availability)
- 16.2.7 Chr Hansen A/
- 16.2.7.1. Overview
- 16.2.7.2. Products
- 16.2.7.3. SWOT Analysis
- 16.2.7.4. Recent Developments
- 16.2.7.5. Financials (Based on Availability)
- 16.2.8 BASF SE
- 16.2.8.1. Overview
- 16.2.8.2. Products
- 16.2.8.3. SWOT Analysis
- 16.2.8.4. Recent Developments
- 16.2.8.5. Financials (Based on Availability)
- 16.2.9 DSM
- 16.2.9.1. Overview
- 16.2.9.2. Products
- 16.2.9.3. SWOT Analysis
- 16.2.9.4. Recent Developments
- 16.2.9.5. Financials (Based on Availability)
- 16.2.10 Alltech Inc
- 16.2.10.1. Overview
- 16.2.10.2. Products
- 16.2.10.3. SWOT Analysis
- 16.2.10.4. Recent Developments
- 16.2.10.5. Financials (Based on Availability)
- 16.2.11 Dupont De Nemours Inc
- 16.2.11.1. Overview
- 16.2.11.2. Products
- 16.2.11.3. SWOT Analysis
- 16.2.11.4. Recent Developments
- 16.2.11.5. Financials (Based on Availability)
- 16.2.12 Cargill Inc
- 16.2.12.1. Overview
- 16.2.12.2. Products
- 16.2.12.3. SWOT Analysis
- 16.2.12.4. Recent Developments
- 16.2.12.5. Financials (Based on Availability)
- 16.2.13 Novozymes A/S
- 16.2.13.1. Overview
- 16.2.13.2. Products
- 16.2.13.3. SWOT Analysis
- 16.2.13.4. Recent Developments
- 16.2.13.5. Financials (Based on Availability)
- 16.2.14 Elanco Animal Health Incorporated
- 16.2.14.1. Overview
- 16.2.14.2. Products
- 16.2.14.3. SWOT Analysis
- 16.2.14.4. Recent Developments
- 16.2.14.5. Financials (Based on Availability)
- 16.2.15 Zoetis Inc
- 16.2.15.1. Overview
- 16.2.15.2. Products
- 16.2.15.3. SWOT Analysis
- 16.2.15.4. Recent Developments
- 16.2.15.5. Financials (Based on Availability)
- 16.2.1 Bluestar Adisseo
List of Figures
- Figure 1: Global Animal Growth Promoters Industry Revenue Breakdown (Million, %) by Region 2024 & 2032
- Figure 2: North America Animal Growth Promoters Industry Revenue (Million), by Country 2024 & 2032
- Figure 3: North America Animal Growth Promoters Industry Revenue Share (%), by Country 2024 & 2032
- Figure 4: Europe Animal Growth Promoters Industry Revenue (Million), by Country 2024 & 2032
- Figure 5: Europe Animal Growth Promoters Industry Revenue Share (%), by Country 2024 & 2032
- Figure 6: Asia Pacific Animal Growth Promoters Industry Revenue (Million), by Country 2024 & 2032
- Figure 7: Asia Pacific Animal Growth Promoters Industry Revenue Share (%), by Country 2024 & 2032
- Figure 8: South America Animal Growth Promoters Industry Revenue (Million), by Country 2024 & 2032
- Figure 9: South America Animal Growth Promoters Industry Revenue Share (%), by Country 2024 & 2032
- Figure 10: Africa Animal Growth Promoters Industry Revenue (Million), by Country 2024 & 2032
- Figure 11: Africa Animal Growth Promoters Industry Revenue Share (%), by Country 2024 & 2032
- Figure 12: North America Animal Growth Promoters Industry Revenue (Million), by Type 2024 & 2032
- Figure 13: North America Animal Growth Promoters Industry Revenue Share (%), by Type 2024 & 2032
- Figure 14: North America Animal Growth Promoters Industry Revenue (Million), by Animal Type 2024 & 2032
- Figure 15: North America Animal Growth Promoters Industry Revenue Share (%), by Animal Type 2024 & 2032
- Figure 16: North America Animal Growth Promoters Industry Revenue (Million), by Country 2024 & 2032
- Figure 17: North America Animal Growth Promoters Industry Revenue Share (%), by Country 2024 & 2032
- Figure 18: Europe Animal Growth Promoters Industry Revenue (Million), by Type 2024 & 2032
- Figure 19: Europe Animal Growth Promoters Industry Revenue Share (%), by Type 2024 & 2032
- Figure 20: Europe Animal Growth Promoters Industry Revenue (Million), by Animal Type 2024 & 2032
- Figure 21: Europe Animal Growth Promoters Industry Revenue Share (%), by Animal Type 2024 & 2032
- Figure 22: Europe Animal Growth Promoters Industry Revenue (Million), by Country 2024 & 2032
- Figure 23: Europe Animal Growth Promoters Industry Revenue Share (%), by Country 2024 & 2032
- Figure 24: Asia Pacific Animal Growth Promoters Industry Revenue (Million), by Type 2024 & 2032
- Figure 25: Asia Pacific Animal Growth Promoters Industry Revenue Share (%), by Type 2024 & 2032
- Figure 26: Asia Pacific Animal Growth Promoters Industry Revenue (Million), by Animal Type 2024 & 2032
- Figure 27: Asia Pacific Animal Growth Promoters Industry Revenue Share (%), by Animal Type 2024 & 2032
- Figure 28: Asia Pacific Animal Growth Promoters Industry Revenue (Million), by Country 2024 & 2032
- Figure 29: Asia Pacific Animal Growth Promoters Industry Revenue Share (%), by Country 2024 & 2032
- Figure 30: South America Animal Growth Promoters Industry Revenue (Million), by Type 2024 & 2032
- Figure 31: South America Animal Growth Promoters Industry Revenue Share (%), by Type 2024 & 2032
- Figure 32: South America Animal Growth Promoters Industry Revenue (Million), by Animal Type 2024 & 2032
- Figure 33: South America Animal Growth Promoters Industry Revenue Share (%), by Animal Type 2024 & 2032
- Figure 34: South America Animal Growth Promoters Industry Revenue (Million), by Country 2024 & 2032
- Figure 35: South America Animal Growth Promoters Industry Revenue Share (%), by Country 2024 & 2032
- Figure 36: Africa Animal Growth Promoters Industry Revenue (Million), by Type 2024 & 2032
- Figure 37: Africa Animal Growth Promoters Industry Revenue Share (%), by Type 2024 & 2032
- Figure 38: Africa Animal Growth Promoters Industry Revenue (Million), by Animal Type 2024 & 2032
- Figure 39: Africa Animal Growth Promoters Industry Revenue Share (%), by Animal Type 2024 & 2032
- Figure 40: Africa Animal Growth Promoters Industry Revenue (Million), by Country 2024 & 2032
- Figure 41: Africa Animal Growth Promoters Industry Revenue Share (%), by Country 2024 & 2032
List of Tables
- Table 1: Global Animal Growth Promoters Industry Revenue Million Forecast, by Region 2019 & 2032
- Table 2: Global Animal Growth Promoters Industry Revenue Million Forecast, by Type 2019 & 2032
- Table 3: Global Animal Growth Promoters Industry Revenue Million Forecast, by Animal Type 2019 & 2032
- Table 4: Global Animal Growth Promoters Industry Revenue Million Forecast, by Region 2019 & 2032
- Table 5: Global Animal Growth Promoters Industry Revenue Million Forecast, by Country 2019 & 2032
- Table 6: United States Animal Growth Promoters Industry Revenue (Million) Forecast, by Application 2019 & 2032
- Table 7: Canada Animal Growth Promoters Industry Revenue (Million) Forecast, by Application 2019 & 2032
- Table 8: Mexico Animal Growth Promoters Industry Revenue (Million) Forecast, by Application 2019 & 2032
- Table 9: Rest of North America Animal Growth Promoters Industry Revenue (Million) Forecast, by Application 2019 & 2032
- Table 10: Global Animal Growth Promoters Industry Revenue Million Forecast, by Country 2019 & 2032
- Table 11: Germany Animal Growth Promoters Industry Revenue (Million) Forecast, by Application 2019 & 2032
- Table 12: United Kingdom Animal Growth Promoters Industry Revenue (Million) Forecast, by Application 2019 & 2032
- Table 13: France Animal Growth Promoters Industry Revenue (Million) Forecast, by Application 2019 & 2032
- Table 14: Russia Animal Growth Promoters Industry Revenue (Million) Forecast, by Application 2019 & 2032
- Table 15: Spain Animal Growth Promoters Industry Revenue (Million) Forecast, by Application 2019 & 2032
- Table 16: Rest of Europe Animal Growth Promoters Industry Revenue (Million) Forecast, by Application 2019 & 2032
- Table 17: Global Animal Growth Promoters Industry Revenue Million Forecast, by Country 2019 & 2032
- Table 18: China Animal Growth Promoters Industry Revenue (Million) Forecast, by Application 2019 & 2032
- Table 19: Japan Animal Growth Promoters Industry Revenue (Million) Forecast, by Application 2019 & 2032
- Table 20: India Animal Growth Promoters Industry Revenue (Million) Forecast, by Application 2019 & 2032
- Table 21: Australia Animal Growth Promoters Industry Revenue (Million) Forecast, by Application 2019 & 2032
- Table 22: Rest of Asia Pacific Animal Growth Promoters Industry Revenue (Million) Forecast, by Application 2019 & 2032
- Table 23: Global Animal Growth Promoters Industry Revenue Million Forecast, by Country 2019 & 2032
- Table 24: Brazil Animal Growth Promoters Industry Revenue (Million) Forecast, by Application 2019 & 2032
- Table 25: Argentina Animal Growth Promoters Industry Revenue (Million) Forecast, by Application 2019 & 2032
- Table 26: Rest of South America Animal Growth Promoters Industry Revenue (Million) Forecast, by Application 2019 & 2032
- Table 27: Global Animal Growth Promoters Industry Revenue Million Forecast, by Country 2019 & 2032
- Table 28: South Africa Animal Growth Promoters Industry Revenue (Million) Forecast, by Application 2019 & 2032
- Table 29: Rest of Africa Animal Growth Promoters Industry Revenue (Million) Forecast, by Application 2019 & 2032
- Table 30: Global Animal Growth Promoters Industry Revenue Million Forecast, by Type 2019 & 2032
- Table 31: Global Animal Growth Promoters Industry Revenue Million Forecast, by Animal Type 2019 & 2032
- Table 32: Global Animal Growth Promoters Industry Revenue Million Forecast, by Country 2019 & 2032
- Table 33: United States Animal Growth Promoters Industry Revenue (Million) Forecast, by Application 2019 & 2032
- Table 34: Canada Animal Growth Promoters Industry Revenue (Million) Forecast, by Application 2019 & 2032
- Table 35: Mexico Animal Growth Promoters Industry Revenue (Million) Forecast, by Application 2019 & 2032
- Table 36: Rest of North America Animal Growth Promoters Industry Revenue (Million) Forecast, by Application 2019 & 2032
- Table 37: Global Animal Growth Promoters Industry Revenue Million Forecast, by Type 2019 & 2032
- Table 38: Global Animal Growth Promoters Industry Revenue Million Forecast, by Animal Type 2019 & 2032
- Table 39: Global Animal Growth Promoters Industry Revenue Million Forecast, by Country 2019 & 2032
- Table 40: Germany Animal Growth Promoters Industry Revenue (Million) Forecast, by Application 2019 & 2032
- Table 41: United Kingdom Animal Growth Promoters Industry Revenue (Million) Forecast, by Application 2019 & 2032
- Table 42: France Animal Growth Promoters Industry Revenue (Million) Forecast, by Application 2019 & 2032
- Table 43: Russia Animal Growth Promoters Industry Revenue (Million) Forecast, by Application 2019 & 2032
- Table 44: Spain Animal Growth Promoters Industry Revenue (Million) Forecast, by Application 2019 & 2032
- Table 45: Rest of Europe Animal Growth Promoters Industry Revenue (Million) Forecast, by Application 2019 & 2032
- Table 46: Global Animal Growth Promoters Industry Revenue Million Forecast, by Type 2019 & 2032
- Table 47: Global Animal Growth Promoters Industry Revenue Million Forecast, by Animal Type 2019 & 2032
- Table 48: Global Animal Growth Promoters Industry Revenue Million Forecast, by Country 2019 & 2032
- Table 49: China Animal Growth Promoters Industry Revenue (Million) Forecast, by Application 2019 & 2032
- Table 50: Japan Animal Growth Promoters Industry Revenue (Million) Forecast, by Application 2019 & 2032
- Table 51: India Animal Growth Promoters Industry Revenue (Million) Forecast, by Application 2019 & 2032
- Table 52: Australia Animal Growth Promoters Industry Revenue (Million) Forecast, by Application 2019 & 2032
- Table 53: Rest of Asia Pacific Animal Growth Promoters Industry Revenue (Million) Forecast, by Application 2019 & 2032
- Table 54: Global Animal Growth Promoters Industry Revenue Million Forecast, by Type 2019 & 2032
- Table 55: Global Animal Growth Promoters Industry Revenue Million Forecast, by Animal Type 2019 & 2032
- Table 56: Global Animal Growth Promoters Industry Revenue Million Forecast, by Country 2019 & 2032
- Table 57: Brazil Animal Growth Promoters Industry Revenue (Million) Forecast, by Application 2019 & 2032
- Table 58: Argentina Animal Growth Promoters Industry Revenue (Million) Forecast, by Application 2019 & 2032
- Table 59: Rest of South America Animal Growth Promoters Industry Revenue (Million) Forecast, by Application 2019 & 2032
- Table 60: Global Animal Growth Promoters Industry Revenue Million Forecast, by Type 2019 & 2032
- Table 61: Global Animal Growth Promoters Industry Revenue Million Forecast, by Animal Type 2019 & 2032
- Table 62: Global Animal Growth Promoters Industry Revenue Million Forecast, by Country 2019 & 2032
- Table 63: South Africa Animal Growth Promoters Industry Revenue (Million) Forecast, by Application 2019 & 2032
- Table 64: Rest of Africa Animal Growth Promoters Industry Revenue (Million) Forecast, by Application 2019 & 2032
Frequently Asked Questions
1. What is the projected Compound Annual Growth Rate (CAGR) of the Animal Growth Promoters Industry?
The projected CAGR is approximately 5.30%.
2. Which companies are prominent players in the Animal Growth Promoters Industry?
Key companies in the market include Bluestar Adisseo, Guangdong VTR Bio-Tech Co Ltd, Biomin GmbH, Novus International Inc, Lotus Minechem Resources Pvt Ltd, Kemin Industries, Chr Hansen A/, BASF SE, DSM, Alltech Inc, Dupont De Nemours Inc, Cargill Inc, Novozymes A/S, Elanco Animal Health Incorporated, Zoetis Inc.
3. What are the main segments of the Animal Growth Promoters Industry?
The market segments include Type, Animal Type.
4. Can you provide details about the market size?
The market size is estimated to be USD 20.80 Million as of 2022.
5. What are some drivers contributing to market growth?
Increased Demand for Meat; Initiatives By the Key Players; Focus on Animal nutrition and Health.
6. What are the notable trends driving market growth?
The Rise in Demand for Meat Boosting the Market.
7. Are there any restraints impacting market growth?
Shift Toward Vegan- Based Diet; Changing Raw Material Prices and Strict Government Rules to Restrict Market Growth.
8. Can you provide examples of recent developments in the market?
N/A
9. What pricing options are available for accessing the report?
Pricing options include single-user, multi-user, and enterprise licenses priced at USD 4750, USD 5250, and USD 8750 respectively.
10. Is the market size provided in terms of value or volume?
The market size is provided in terms of value, measured in Million.
11. Are there any specific market keywords associated with the report?
Yes, the market keyword associated with the report is "Animal Growth Promoters Industry," which aids in identifying and referencing the specific market segment covered.
12. How do I determine which pricing option suits my needs best?
The pricing options vary based on user requirements and access needs. Individual users may opt for single-user licenses, while businesses requiring broader access may choose multi-user or enterprise licenses for cost-effective access to the report.
13. Are there any additional resources or data provided in the Animal Growth Promoters Industry report?
While the report offers comprehensive insights, it's advisable to review the specific contents or supplementary materials provided to ascertain if additional resources or data are available.
14. How can I stay updated on further developments or reports in the Animal Growth Promoters Industry?
To stay informed about further developments, trends, and reports in the Animal Growth Promoters Industry, consider subscribing to industry newsletters, following relevant companies and organizations, or regularly checking reputable industry news sources and publications.
Methodology
Step 1 - Identification of Relevant Samples Size from Population Database


Step 2 - Approaches for Defining Global Market Size (Value, Volume* & Price*)

Note*: In applicable scenarios
Step 3 - Data Sources
Primary Research
- Web Analytics
- Survey Reports
- Research Institute
- Latest Research Reports
- Opinion Leaders
Secondary Research
- Annual Reports
- White Paper
- Latest Press Release
- Industry Association
- Paid Database
- Investor Presentations

Step 4 - Data Triangulation
Involves using different sources of information in order to increase the validity of a study
These sources are likely to be stakeholders in a program - participants, other researchers, program staff, other community members, and so on.
Then we put all data in single framework & apply various statistical tools to find out the dynamic on the market.
During the analysis stage, feedback from the stakeholder groups would be compared to determine areas of agreement as well as areas of divergence


