Key Insights
The amber glass packaging market is experiencing robust growth, driven by the increasing demand for sustainable and eco-friendly packaging solutions across various industries. The inherent properties of amber glass, such as its UV protection, barrier properties against oxygen and moisture, and recyclability, make it a preferred choice for packaging sensitive products like pharmaceuticals, food and beverages, and cosmetics. The market's Compound Annual Growth Rate (CAGR) is estimated at 5% between 2025 and 2033, indicating a significant expansion. This growth is fueled by several key trends including the rising consumer preference for natural and organic products, which necessitates packaging that maintains product integrity and quality, and the growing emphasis on reducing plastic waste in packaging. Major players like Ardagh Group, Piramal Enterprises, and Gerresheimer are driving innovation through the development of lightweight and customizable amber glass packaging solutions. However, the market also faces restraints such as the relatively higher cost of glass compared to other packaging materials and the challenges associated with glass fragility and transportation. Segmentation within the market includes various bottle sizes, shapes, and closure types, catering to specific product requirements. The North American and European regions currently hold significant market share, though emerging economies are showing promising growth potential.
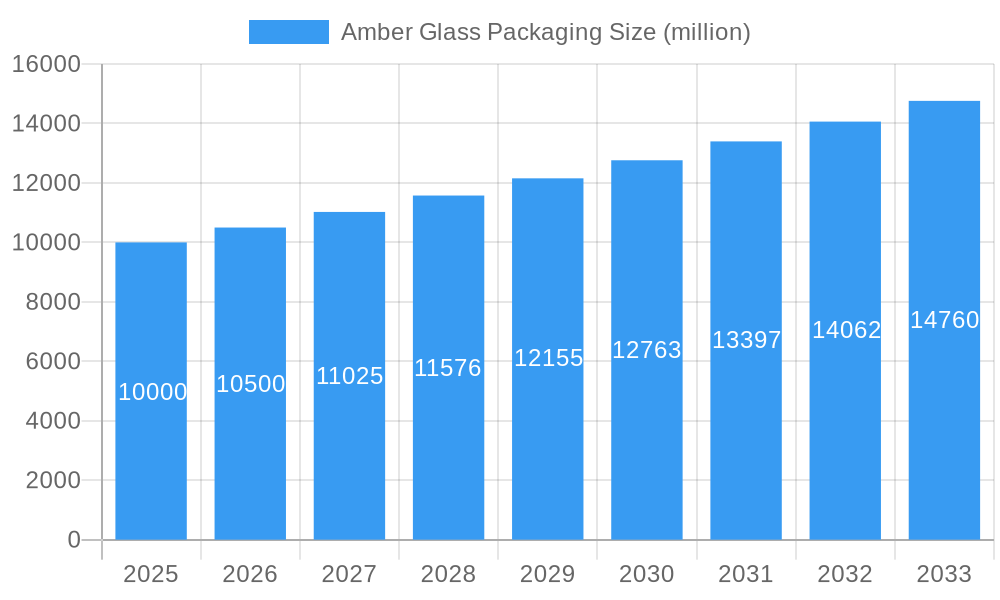
Amber Glass Packaging Market Size (In Billion)
The forecast for the amber glass packaging market remains positive, with a projected market size exceeding $15 billion by 2033 (estimated based on a conservative CAGR and assuming a 2025 market size of approximately $10 billion). Continued innovation in manufacturing processes, focusing on reducing production costs and enhancing recyclability, will be crucial for sustaining this growth trajectory. Furthermore, collaborative efforts between packaging manufacturers, brands, and recycling infrastructure providers will be vital in addressing the environmental concerns and optimizing the overall value chain. The market's future success hinges on balancing the demand for sustainable packaging with the need for cost-effectiveness and logistical efficiency.
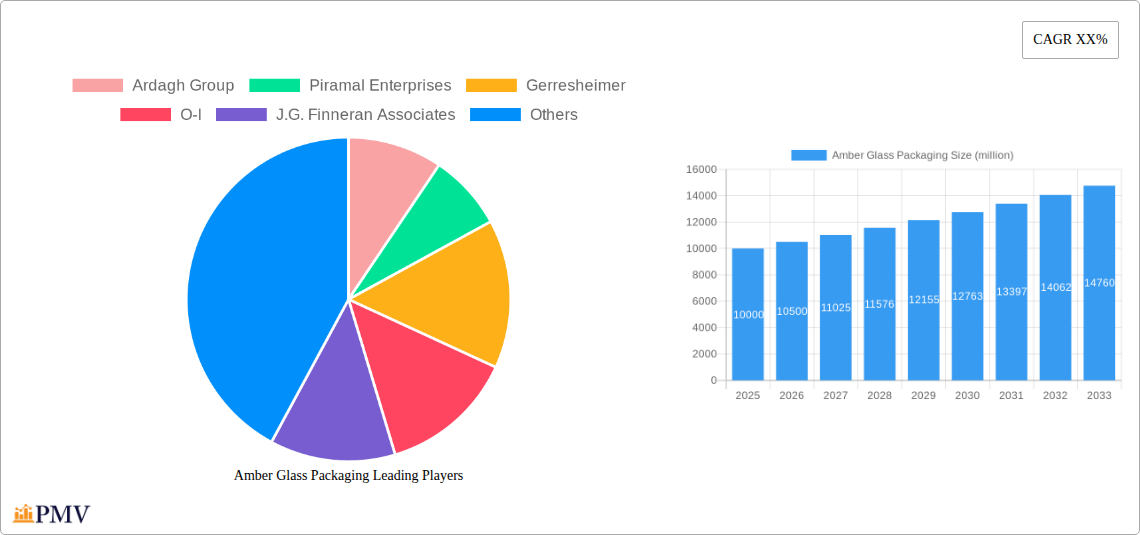
Amber Glass Packaging Company Market Share
Amber Glass Packaging Market Report: 2019-2033
This comprehensive report provides a detailed analysis of the global amber glass packaging market, offering invaluable insights for businesses, investors, and stakeholders seeking to navigate this dynamic industry. The study period covers 2019-2033, with a base year of 2025 and a forecast period of 2025-2033. The report utilizes extensive data analysis from the historical period (2019-2024) to predict future market trends and opportunities, including market size projections valued in millions.
Amber Glass Packaging Market Structure & Competitive Dynamics
This section analyzes the competitive landscape of the amber glass packaging market, focusing on market concentration, innovation, regulatory frameworks, substitutes, end-user trends, and mergers & acquisitions (M&A) activity. The global amber glass packaging market is moderately concentrated, with several key players holding significant market share. The top five companies – Ardagh Group, Piramal Enterprises, Gerresheimer, O-I, and J.G. Finneran Associates – collectively account for approximately xx% of the market share in 2025.
- Market Concentration: High, with top players holding significant shares.
- Innovation Ecosystems: Active, with continuous development of sustainable and innovative packaging solutions.
- Regulatory Frameworks: Stringent regulations regarding material safety and environmental impact drive innovation.
- Product Substitutes: Competition from alternative packaging materials like plastic and metal requires constant innovation.
- End-User Trends: Increasing demand for sustainable packaging is shaping market dynamics.
- M&A Activity: The past five years have seen several significant M&A deals, with a total transaction value exceeding $xx million. This consolidation is expected to continue.
Amber Glass Packaging Industry Trends & Insights
This section delves into the key drivers and trends shaping the amber glass packaging market's growth trajectory. The market is experiencing a compound annual growth rate (CAGR) of xx% during the forecast period (2025-2033), driven by several factors. Market penetration is projected to reach xx% by 2033.
- Growth Drivers: Rising demand from the pharmaceutical and food & beverage sectors, increasing preference for sustainable packaging, and technological advancements in manufacturing processes.
- Technological Disruptions: Automation and digitalization in manufacturing are improving efficiency and reducing costs. The adoption of lightweighting techniques is increasing.
- Consumer Preferences: Growing consumer awareness of environmental issues is fueling demand for eco-friendly packaging.
- Competitive Dynamics: Intense competition among leading players is driving innovation and price optimization.
Dominant Markets & Segments in Amber Glass Packaging
This section identifies the leading regions and segments within the amber glass packaging market. The North American region currently dominates the market, driven by a robust pharmaceutical industry and stringent regulations.
- Key Drivers of North American Dominance:
- Strong pharmaceutical and food & beverage industries.
- High consumer awareness of sustainable packaging.
- Well-established infrastructure and distribution networks.
- Other Key Regions: Europe and Asia-Pacific are also significant markets experiencing robust growth, driven by increasing demand from emerging economies. Detailed analysis of country-specific market dynamics is included within the full report.
Amber Glass Packaging Product Innovations
Recent years have witnessed significant innovation in amber glass packaging, primarily focused on enhancing sustainability, improving functionality, and reducing costs. Developments include lightweighting techniques, improved closure systems, and the integration of smart packaging technologies. These innovations enhance product protection and shelf life while appealing to environmentally conscious consumers.
Report Segmentation & Scope
The report provides a comprehensive segmentation of the amber glass packaging market across various parameters, including product type, capacity, application, and geography. Each segment is analyzed based on its growth projections, market size (in millions), and competitive dynamics. Specific details of each segment are included in the full report.
Key Drivers of Amber Glass Packaging Growth
Several factors are driving the growth of the amber glass packaging market. These include increasing demand from the pharmaceutical and food & beverage sectors due to the inherent protective qualities of amber glass, growing consumer preference for sustainable and eco-friendly packaging, and ongoing technological advancements improving manufacturing efficiency and reducing costs. Government regulations promoting sustainable packaging also contribute to market growth.
Challenges in the Amber Glass Packaging Sector
The amber glass packaging sector faces several challenges, including fluctuating raw material prices, stringent regulatory compliance requirements, and intense competition from alternative packaging materials. Supply chain disruptions and geopolitical uncertainties also pose significant risks to market stability and growth. These factors can impact production costs and lead times, influencing overall market dynamics.
Leading Players in the Amber Glass Packaging Market
- Ardagh Group
- Piramal Enterprises
- Gerresheimer
- O-I
- J.G. Finneran Associates
- Pacific Vial
- Origin Pharma Packaging
- Silver Spur
- Kaufman Container
- Anchor Glass Container
Key Developments in Amber Glass Packaging Sector
- 2022 Q4: Ardagh Group launched a new line of lightweight amber glass bottles.
- 2023 Q1: Gerresheimer announced a strategic partnership to develop sustainable amber glass packaging solutions.
- 2023 Q3: O-I invested in new manufacturing technology to improve efficiency. (Further details on specific dates and impacts are available in the full report)
Strategic Amber Glass Packaging Market Outlook
The amber glass packaging market presents significant growth potential driven by the ongoing demand for sustainable and protective packaging solutions. Strategic opportunities lie in investing in innovative manufacturing technologies, expanding into high-growth markets, and focusing on developing sustainable and lightweight packaging designs. The market's future depends on adapting to evolving consumer preferences, addressing environmental concerns, and navigating regulatory landscapes effectively.
Amber Glass Packaging Segmentation
-
1. Application
- 1.1. Pharmaceuticals
- 1.2. Food & Beverages
- 1.3. Personal Care & Cosmetics
- 1.4. Others
-
2. Types
- 2.1. Containers & Jars
- 2.2. Bottles
- 2.3. Others
Amber Glass Packaging Segmentation By Geography
-
1. North America
- 1.1. United States
- 1.2. Canada
- 1.3. Mexico
-
2. South America
- 2.1. Brazil
- 2.2. Argentina
- 2.3. Rest of South America
-
3. Europe
- 3.1. United Kingdom
- 3.2. Germany
- 3.3. France
- 3.4. Italy
- 3.5. Spain
- 3.6. Russia
- 3.7. Benelux
- 3.8. Nordics
- 3.9. Rest of Europe
-
4. Middle East & Africa
- 4.1. Turkey
- 4.2. Israel
- 4.3. GCC
- 4.4. North Africa
- 4.5. South Africa
- 4.6. Rest of Middle East & Africa
-
5. Asia Pacific
- 5.1. China
- 5.2. India
- 5.3. Japan
- 5.4. South Korea
- 5.5. ASEAN
- 5.6. Oceania
- 5.7. Rest of Asia Pacific

Amber Glass Packaging Regional Market Share
Geographic Coverage of Amber Glass Packaging
Amber Glass Packaging REPORT HIGHLIGHTS
| Aspects | Details |
|---|---|
| Study Period | 2020-2034 |
| Base Year | 2025 |
| Estimated Year | 2026 |
| Forecast Period | 2026-2034 |
| Historical Period | 2020-2025 |
| Growth Rate | CAGR of 4.5% from 2020-2034 |
| Segmentation |
|
Table of Contents
- 1. Introduction
- 1.1. Research Scope
- 1.2. Market Segmentation
- 1.3. Research Objective
- 1.4. Definitions and Assumptions
- 2. Executive Summary
- 2.1. Market Snapshot
- 3. Market Dynamics
- 3.1. Market Drivers
- 3.2. Market Restrains
- 3.3. Market Trends
- 3.4. Market Opportunities
- 4. Market Factor Analysis
- 4.1. Porters Five Forces
- 4.1.1. Bargaining Power of Suppliers
- 4.1.2. Bargaining Power of Buyers
- 4.1.3. Threat of New Entrants
- 4.1.4. Threat of Substitutes
- 4.1.5. Competitive Rivalry
- 4.2. PESTEL analysis
- 4.3. BCG Analysis
- 4.3.1. Stars (High Growth, High Market Share)
- 4.3.2. Cash Cows (Low Growth, High Market Share)
- 4.3.3. Question Mark (High Growth, Low Market Share)
- 4.3.4. Dogs (Low Growth, Low Market Share)
- 4.4. Ansoff Matrix Analysis
- 4.5. Supply Chain Analysis
- 4.6. Regulatory Landscape
- 4.7. Current Market Potential and Opportunity Assessment (TAM–SAM–SOM Framework)
- 4.8. PMV Analyst Note
- 4.1. Porters Five Forces
- 5. Market Analysis, Insights and Forecast 2021-2033
- 5.1. Market Analysis, Insights and Forecast - by Application
- 5.1.1. Pharmaceuticals
- 5.1.2. Food & Beverages
- 5.1.3. Personal Care & Cosmetics
- 5.1.4. Others
- 5.2. Market Analysis, Insights and Forecast - by Types
- 5.2.1. Containers & Jars
- 5.2.2. Bottles
- 5.2.3. Others
- 5.3. Market Analysis, Insights and Forecast - by Region
- 5.3.1. North America
- 5.3.2. South America
- 5.3.3. Europe
- 5.3.4. Middle East & Africa
- 5.3.5. Asia Pacific
- 5.1. Market Analysis, Insights and Forecast - by Application
- 6. Global Amber Glass Packaging Analysis, Insights and Forecast, 2021-2033
- 6.1. Market Analysis, Insights and Forecast - by Application
- 6.1.1. Pharmaceuticals
- 6.1.2. Food & Beverages
- 6.1.3. Personal Care & Cosmetics
- 6.1.4. Others
- 6.2. Market Analysis, Insights and Forecast - by Types
- 6.2.1. Containers & Jars
- 6.2.2. Bottles
- 6.2.3. Others
- 6.1. Market Analysis, Insights and Forecast - by Application
- 7. North America Amber Glass Packaging Analysis, Insights and Forecast, 2020-2032
- 7.1. Market Analysis, Insights and Forecast - by Application
- 7.1.1. Pharmaceuticals
- 7.1.2. Food & Beverages
- 7.1.3. Personal Care & Cosmetics
- 7.1.4. Others
- 7.2. Market Analysis, Insights and Forecast - by Types
- 7.2.1. Containers & Jars
- 7.2.2. Bottles
- 7.2.3. Others
- 7.1. Market Analysis, Insights and Forecast - by Application
- 8. South America Amber Glass Packaging Analysis, Insights and Forecast, 2020-2032
- 8.1. Market Analysis, Insights and Forecast - by Application
- 8.1.1. Pharmaceuticals
- 8.1.2. Food & Beverages
- 8.1.3. Personal Care & Cosmetics
- 8.1.4. Others
- 8.2. Market Analysis, Insights and Forecast - by Types
- 8.2.1. Containers & Jars
- 8.2.2. Bottles
- 8.2.3. Others
- 8.1. Market Analysis, Insights and Forecast - by Application
- 9. Europe Amber Glass Packaging Analysis, Insights and Forecast, 2020-2032
- 9.1. Market Analysis, Insights and Forecast - by Application
- 9.1.1. Pharmaceuticals
- 9.1.2. Food & Beverages
- 9.1.3. Personal Care & Cosmetics
- 9.1.4. Others
- 9.2. Market Analysis, Insights and Forecast - by Types
- 9.2.1. Containers & Jars
- 9.2.2. Bottles
- 9.2.3. Others
- 9.1. Market Analysis, Insights and Forecast - by Application
- 10. Middle East & Africa Amber Glass Packaging Analysis, Insights and Forecast, 2020-2032
- 10.1. Market Analysis, Insights and Forecast - by Application
- 10.1.1. Pharmaceuticals
- 10.1.2. Food & Beverages
- 10.1.3. Personal Care & Cosmetics
- 10.1.4. Others
- 10.2. Market Analysis, Insights and Forecast - by Types
- 10.2.1. Containers & Jars
- 10.2.2. Bottles
- 10.2.3. Others
- 10.1. Market Analysis, Insights and Forecast - by Application
- 11. Asia Pacific Amber Glass Packaging Analysis, Insights and Forecast, 2020-2032
- 11.1. Market Analysis, Insights and Forecast - by Application
- 11.1.1. Pharmaceuticals
- 11.1.2. Food & Beverages
- 11.1.3. Personal Care & Cosmetics
- 11.1.4. Others
- 11.2. Market Analysis, Insights and Forecast - by Types
- 11.2.1. Containers & Jars
- 11.2.2. Bottles
- 11.2.3. Others
- 11.1. Market Analysis, Insights and Forecast - by Application
- 12. Competitive Analysis
- 12.1. Company Profiles
- 12.1.1 Ardagh Group
- 12.1.1.1. Company Overview
- 12.1.1.2. Products
- 12.1.1.3. Company Financials
- 12.1.1.4. SWOT Analysis
- 12.1.2 Piramal Enterprises
- 12.1.2.1. Company Overview
- 12.1.2.2. Products
- 12.1.2.3. Company Financials
- 12.1.2.4. SWOT Analysis
- 12.1.3 Gerresheimer
- 12.1.3.1. Company Overview
- 12.1.3.2. Products
- 12.1.3.3. Company Financials
- 12.1.3.4. SWOT Analysis
- 12.1.4 O-I
- 12.1.4.1. Company Overview
- 12.1.4.2. Products
- 12.1.4.3. Company Financials
- 12.1.4.4. SWOT Analysis
- 12.1.5 J.G. Finneran Associates
- 12.1.5.1. Company Overview
- 12.1.5.2. Products
- 12.1.5.3. Company Financials
- 12.1.5.4. SWOT Analysis
- 12.1.6 Pacific Vial
- 12.1.6.1. Company Overview
- 12.1.6.2. Products
- 12.1.6.3. Company Financials
- 12.1.6.4. SWOT Analysis
- 12.1.7 Origin Pharma Packaging
- 12.1.7.1. Company Overview
- 12.1.7.2. Products
- 12.1.7.3. Company Financials
- 12.1.7.4. SWOT Analysis
- 12.1.8 Silver Spur
- 12.1.8.1. Company Overview
- 12.1.8.2. Products
- 12.1.8.3. Company Financials
- 12.1.8.4. SWOT Analysis
- 12.1.9 Kaufman Container
- 12.1.9.1. Company Overview
- 12.1.9.2. Products
- 12.1.9.3. Company Financials
- 12.1.9.4. SWOT Analysis
- 12.1.10 Anchor Glass Container
- 12.1.10.1. Company Overview
- 12.1.10.2. Products
- 12.1.10.3. Company Financials
- 12.1.10.4. SWOT Analysis
- 12.1.1 Ardagh Group
- 12.2. Market Entropy
- 12.2.1 Company's Key Areas Served
- 12.2.2 Recent Developments
- 12.3. Company Market Share Analysis 2025
- 12.3.1 Top 5 Companies Market Share Analysis
- 12.3.2 Top 3 Companies Market Share Analysis
- 12.4. List of Potential Customers
- 13. Research Methodology
List of Figures
- Figure 1: Global Amber Glass Packaging Revenue Breakdown (undefined, %) by Region 2025 & 2033
- Figure 2: North America Amber Glass Packaging Revenue (undefined), by Application 2025 & 2033
- Figure 3: North America Amber Glass Packaging Revenue Share (%), by Application 2025 & 2033
- Figure 4: North America Amber Glass Packaging Revenue (undefined), by Types 2025 & 2033
- Figure 5: North America Amber Glass Packaging Revenue Share (%), by Types 2025 & 2033
- Figure 6: North America Amber Glass Packaging Revenue (undefined), by Country 2025 & 2033
- Figure 7: North America Amber Glass Packaging Revenue Share (%), by Country 2025 & 2033
- Figure 8: South America Amber Glass Packaging Revenue (undefined), by Application 2025 & 2033
- Figure 9: South America Amber Glass Packaging Revenue Share (%), by Application 2025 & 2033
- Figure 10: South America Amber Glass Packaging Revenue (undefined), by Types 2025 & 2033
- Figure 11: South America Amber Glass Packaging Revenue Share (%), by Types 2025 & 2033
- Figure 12: South America Amber Glass Packaging Revenue (undefined), by Country 2025 & 2033
- Figure 13: South America Amber Glass Packaging Revenue Share (%), by Country 2025 & 2033
- Figure 14: Europe Amber Glass Packaging Revenue (undefined), by Application 2025 & 2033
- Figure 15: Europe Amber Glass Packaging Revenue Share (%), by Application 2025 & 2033
- Figure 16: Europe Amber Glass Packaging Revenue (undefined), by Types 2025 & 2033
- Figure 17: Europe Amber Glass Packaging Revenue Share (%), by Types 2025 & 2033
- Figure 18: Europe Amber Glass Packaging Revenue (undefined), by Country 2025 & 2033
- Figure 19: Europe Amber Glass Packaging Revenue Share (%), by Country 2025 & 2033
- Figure 20: Middle East & Africa Amber Glass Packaging Revenue (undefined), by Application 2025 & 2033
- Figure 21: Middle East & Africa Amber Glass Packaging Revenue Share (%), by Application 2025 & 2033
- Figure 22: Middle East & Africa Amber Glass Packaging Revenue (undefined), by Types 2025 & 2033
- Figure 23: Middle East & Africa Amber Glass Packaging Revenue Share (%), by Types 2025 & 2033
- Figure 24: Middle East & Africa Amber Glass Packaging Revenue (undefined), by Country 2025 & 2033
- Figure 25: Middle East & Africa Amber Glass Packaging Revenue Share (%), by Country 2025 & 2033
- Figure 26: Asia Pacific Amber Glass Packaging Revenue (undefined), by Application 2025 & 2033
- Figure 27: Asia Pacific Amber Glass Packaging Revenue Share (%), by Application 2025 & 2033
- Figure 28: Asia Pacific Amber Glass Packaging Revenue (undefined), by Types 2025 & 2033
- Figure 29: Asia Pacific Amber Glass Packaging Revenue Share (%), by Types 2025 & 2033
- Figure 30: Asia Pacific Amber Glass Packaging Revenue (undefined), by Country 2025 & 2033
- Figure 31: Asia Pacific Amber Glass Packaging Revenue Share (%), by Country 2025 & 2033
List of Tables
- Table 1: Global Amber Glass Packaging Revenue undefined Forecast, by Application 2020 & 2033
- Table 2: Global Amber Glass Packaging Revenue undefined Forecast, by Types 2020 & 2033
- Table 3: Global Amber Glass Packaging Revenue undefined Forecast, by Region 2020 & 2033
- Table 4: Global Amber Glass Packaging Revenue undefined Forecast, by Application 2020 & 2033
- Table 5: Global Amber Glass Packaging Revenue undefined Forecast, by Types 2020 & 2033
- Table 6: Global Amber Glass Packaging Revenue undefined Forecast, by Country 2020 & 2033
- Table 7: United States Amber Glass Packaging Revenue (undefined) Forecast, by Application 2020 & 2033
- Table 8: Canada Amber Glass Packaging Revenue (undefined) Forecast, by Application 2020 & 2033
- Table 9: Mexico Amber Glass Packaging Revenue (undefined) Forecast, by Application 2020 & 2033
- Table 10: Global Amber Glass Packaging Revenue undefined Forecast, by Application 2020 & 2033
- Table 11: Global Amber Glass Packaging Revenue undefined Forecast, by Types 2020 & 2033
- Table 12: Global Amber Glass Packaging Revenue undefined Forecast, by Country 2020 & 2033
- Table 13: Brazil Amber Glass Packaging Revenue (undefined) Forecast, by Application 2020 & 2033
- Table 14: Argentina Amber Glass Packaging Revenue (undefined) Forecast, by Application 2020 & 2033
- Table 15: Rest of South America Amber Glass Packaging Revenue (undefined) Forecast, by Application 2020 & 2033
- Table 16: Global Amber Glass Packaging Revenue undefined Forecast, by Application 2020 & 2033
- Table 17: Global Amber Glass Packaging Revenue undefined Forecast, by Types 2020 & 2033
- Table 18: Global Amber Glass Packaging Revenue undefined Forecast, by Country 2020 & 2033
- Table 19: United Kingdom Amber Glass Packaging Revenue (undefined) Forecast, by Application 2020 & 2033
- Table 20: Germany Amber Glass Packaging Revenue (undefined) Forecast, by Application 2020 & 2033
- Table 21: France Amber Glass Packaging Revenue (undefined) Forecast, by Application 2020 & 2033
- Table 22: Italy Amber Glass Packaging Revenue (undefined) Forecast, by Application 2020 & 2033
- Table 23: Spain Amber Glass Packaging Revenue (undefined) Forecast, by Application 2020 & 2033
- Table 24: Russia Amber Glass Packaging Revenue (undefined) Forecast, by Application 2020 & 2033
- Table 25: Benelux Amber Glass Packaging Revenue (undefined) Forecast, by Application 2020 & 2033
- Table 26: Nordics Amber Glass Packaging Revenue (undefined) Forecast, by Application 2020 & 2033
- Table 27: Rest of Europe Amber Glass Packaging Revenue (undefined) Forecast, by Application 2020 & 2033
- Table 28: Global Amber Glass Packaging Revenue undefined Forecast, by Application 2020 & 2033
- Table 29: Global Amber Glass Packaging Revenue undefined Forecast, by Types 2020 & 2033
- Table 30: Global Amber Glass Packaging Revenue undefined Forecast, by Country 2020 & 2033
- Table 31: Turkey Amber Glass Packaging Revenue (undefined) Forecast, by Application 2020 & 2033
- Table 32: Israel Amber Glass Packaging Revenue (undefined) Forecast, by Application 2020 & 2033
- Table 33: GCC Amber Glass Packaging Revenue (undefined) Forecast, by Application 2020 & 2033
- Table 34: North Africa Amber Glass Packaging Revenue (undefined) Forecast, by Application 2020 & 2033
- Table 35: South Africa Amber Glass Packaging Revenue (undefined) Forecast, by Application 2020 & 2033
- Table 36: Rest of Middle East & Africa Amber Glass Packaging Revenue (undefined) Forecast, by Application 2020 & 2033
- Table 37: Global Amber Glass Packaging Revenue undefined Forecast, by Application 2020 & 2033
- Table 38: Global Amber Glass Packaging Revenue undefined Forecast, by Types 2020 & 2033
- Table 39: Global Amber Glass Packaging Revenue undefined Forecast, by Country 2020 & 2033
- Table 40: China Amber Glass Packaging Revenue (undefined) Forecast, by Application 2020 & 2033
- Table 41: India Amber Glass Packaging Revenue (undefined) Forecast, by Application 2020 & 2033
- Table 42: Japan Amber Glass Packaging Revenue (undefined) Forecast, by Application 2020 & 2033
- Table 43: South Korea Amber Glass Packaging Revenue (undefined) Forecast, by Application 2020 & 2033
- Table 44: ASEAN Amber Glass Packaging Revenue (undefined) Forecast, by Application 2020 & 2033
- Table 45: Oceania Amber Glass Packaging Revenue (undefined) Forecast, by Application 2020 & 2033
- Table 46: Rest of Asia Pacific Amber Glass Packaging Revenue (undefined) Forecast, by Application 2020 & 2033
Frequently Asked Questions
1. What is the projected Compound Annual Growth Rate (CAGR) of the Amber Glass Packaging?
The projected CAGR is approximately 4.5%.
2. Which companies are prominent players in the Amber Glass Packaging?
Key companies in the market include Ardagh Group, Piramal Enterprises, Gerresheimer, O-I, J.G. Finneran Associates, Pacific Vial, Origin Pharma Packaging, Silver Spur, Kaufman Container, Anchor Glass Container.
3. What are the main segments of the Amber Glass Packaging?
The market segments include Application, Types.
4. Can you provide details about the market size?
The market size is estimated to be USD XXX N/A as of 2022.
5. What are some drivers contributing to market growth?
N/A
6. What are the notable trends driving market growth?
N/A
7. Are there any restraints impacting market growth?
N/A
8. Can you provide examples of recent developments in the market?
N/A
9. What pricing options are available for accessing the report?
Pricing options include single-user, multi-user, and enterprise licenses priced at USD 2900.00, USD 4350.00, and USD 5800.00 respectively.
10. Is the market size provided in terms of value or volume?
The market size is provided in terms of value, measured in N/A.
11. Are there any specific market keywords associated with the report?
Yes, the market keyword associated with the report is "Amber Glass Packaging," which aids in identifying and referencing the specific market segment covered.
12. How do I determine which pricing option suits my needs best?
The pricing options vary based on user requirements and access needs. Individual users may opt for single-user licenses, while businesses requiring broader access may choose multi-user or enterprise licenses for cost-effective access to the report.
13. Are there any additional resources or data provided in the Amber Glass Packaging report?
While the report offers comprehensive insights, it's advisable to review the specific contents or supplementary materials provided to ascertain if additional resources or data are available.
14. How can I stay updated on further developments or reports in the Amber Glass Packaging?
To stay informed about further developments, trends, and reports in the Amber Glass Packaging, consider subscribing to industry newsletters, following relevant companies and organizations, or regularly checking reputable industry news sources and publications.
Methodology
Step 1 - Identification of Relevant Samples Size from Population Database


Step 2 - Approaches for Defining Global Market Size (Value, Volume* & Price*)

Note*: In applicable scenarios
Step 3 - Data Sources
Primary Research
- Web Analytics
- Survey Reports
- Research Institute
- Latest Research Reports
- Opinion Leaders
Secondary Research
- Annual Reports
- White Paper
- Latest Press Release
- Industry Association
- Paid Database
- Investor Presentations

Step 4 - Data Triangulation
Involves using different sources of information in order to increase the validity of a study
These sources are likely to be stakeholders in a program - participants, other researchers, program staff, other community members, and so on.
Then we put all data in single framework & apply various statistical tools to find out the dynamic on the market.
During the analysis stage, feedback from the stakeholder groups would be compared to determine areas of agreement as well as areas of divergence

