


Key Insights
The global Aluminum Foil Takeaway Containers market is projected to reach a market size of $40.47 billion by 2025, exhibiting a CAGR of 4.9% from 2025 to 2033. This growth is driven by escalating consumer preference for convenient, portable food options, a trend amplified by evolving lifestyles and increased reliance on food delivery services. The inherent advantages of aluminum foil containers, including superior heat retention, durability, and resistance to moisture and grease, establish them as a preferred solution across foodservice and retail sectors. The retail and supermarket segment, in particular, is expected to see substantial uptake as these businesses expand their offerings of ready-to-eat meals and catering services. Furthermore, growing consumer and industry awareness of aluminum's recyclability positively influences market sentiment, aligning with global sustainability objectives.
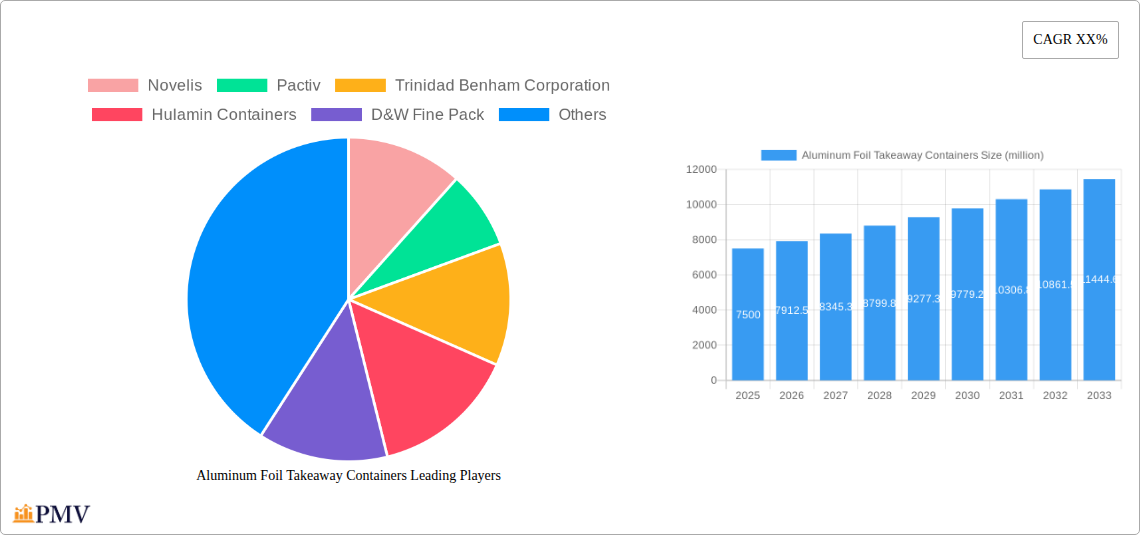
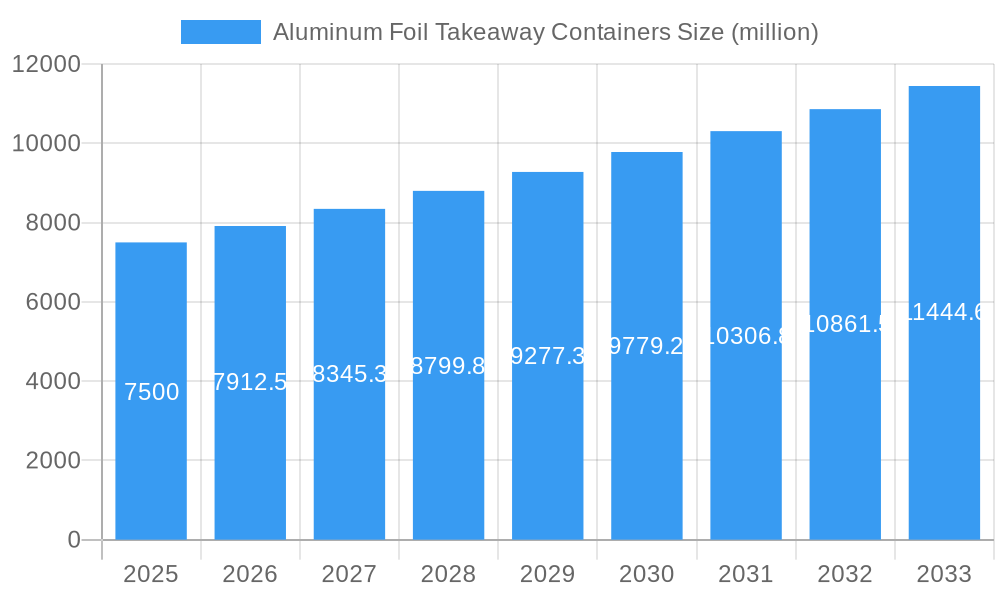
Aluminum Foil Takeaway Containers Market Size (In Billion)

Key market drivers include the expansion of the food delivery ecosystem, fueled by digital platforms and a growing millennial and Gen Z demographic. The intrinsic hygiene and barrier properties of aluminum foil containers are crucial for ensuring food safety and quality during transit, a paramount concern for both businesses and consumers. Emerging trends such as the rising popularity of gourmet and ethnic cuisines available via takeaway, coupled with a demand for aesthetically pleasing and functional packaging, further stimulate market growth. While these factors propel the market, potential restraints include aluminum raw material price volatility and increasing competition from alternative packaging solutions like compostable plastics and paper-based containers. Nevertheless, established infrastructure and widespread consumer familiarity with aluminum foil containers are anticipated to mitigate these challenges, ensuring sustained market expansion. Leading players are actively investing in product innovation and capacity enhancement to meet this burgeoning demand.
Aluminum Foil Takeaway Containers Company Market Share
This comprehensive report offers an in-depth analysis of the global Aluminum Foil Takeaway Containers market, examining its structure, competitive landscape, and future trajectory. Covering the period from 2019 to 2033, with a base year of 2025 and a detailed forecast from 2025 to 2033, this research provides critical intelligence for stakeholders seeking to identify and leverage opportunities within the food packaging industry. The analysis includes market segmentation by application and type, identification of key growth drivers and challenges, and highlights of product innovations and strategic initiatives by market leaders.
Aluminum Foil Takeaway Containers Market Structure & Competitive Dynamics
The global Aluminum Foil Takeaway Containers market is characterized by a moderate level of concentration, with several prominent manufacturers vying for market share. Innovation ecosystems are driven by a continuous pursuit of enhanced product features, such as improved insulation, durability, and eco-friendliness. Regulatory frameworks, primarily focused on food safety and environmental impact, play a crucial role in shaping product development and market entry strategies. Product substitutes, including plastic, paper, and compostable containers, present ongoing competitive pressure, necessitating a focus on the unique advantages of aluminum foil, such as its excellent barrier properties and recyclability. End-user trends are increasingly leaning towards convenience, sustainability, and portion control, influencing container design and capacity. Merger and acquisition (M&A) activities are observed as companies seek to expand their product portfolios, geographical reach, and operational efficiencies. Market share estimates for key players and M&A deal values are detailed within the full report, offering a granular view of the competitive landscape.
Aluminum Foil Takeaway Containers Industry Trends & Insights
The Aluminum Foil Takeaway Containers industry is experiencing robust growth, projected to expand at a Compound Annual Growth Rate (CAGR) of approximately 5.2% from 2025 to 2033. This upward trajectory is fueled by several key market growth drivers. The burgeoning demand for convenient and ready-to-eat meals, particularly within the food services sector, significantly propels the adoption of these containers. Technological disruptions are evident in advancements in manufacturing processes, leading to lighter, more sustainable, and cost-effective aluminum foil containers. Consumer preferences are shifting towards disposable food packaging that offers superior temperature retention and hygiene, attributes where aluminum foil excels. Competitive dynamics are shaped by companies focusing on product differentiation through custom branding, varied lid options, and increasingly, features that enhance recyclability and environmental consciousness. Market penetration is expanding across both traditional food service channels and the growing online food delivery platforms, underscoring the versatility and reliability of aluminum foil packaging solutions.
Dominant Markets & Segments in Aluminum Foil Takeaway Containers
North America currently holds a dominant position in the global Aluminum Foil Takeaway Containers market, driven by strong economic policies and well-established food service infrastructure. The United States, in particular, showcases high market penetration due to widespread adoption in restaurant chains, catering services, and retail food outlets.
- Application: The Foodservices segment represents the largest and most influential application area, accounting for an estimated 65% of the market share. This dominance is attributed to the high volume of takeout and delivery orders, requiring reliable and temperature-retaining packaging. Economic stability and a strong consumer appetite for dining out and convenience foods are key drivers in this segment.
- Retail and Supermarkets follow as a significant segment, driven by the increasing popularity of pre-packaged meals and deli items. Growing consumer focus on home cooking and meal preparation, coupled with the convenience offered by ready-to-heat foil containers, contributes to its expansion.
- Types: Within the product types, the 400 ML & Above category commands the largest market share, estimated at 55%. This is primarily due to its suitability for larger meal portions, family-sized servings, and catering applications, aligning with consumer demand for value and convenience. The 200 ML to 400 ML segment is also a substantial contributor, catering to individual meal servings and side dishes. The Up to 200 ML segment, while smaller, is vital for condiments, appetizers, and desserts.
Aluminum Foil Takeaway Containers Product Innovations
Product innovations in the Aluminum Foil Takeaway Containers market are increasingly focused on enhancing sustainability and functionality. Developments include containers with improved thermal insulation properties, reducing heat loss and maintaining food temperature for longer periods. Furthermore, manufacturers are investing in designs that optimize material usage, leading to lighter yet equally durable containers. Innovations also encompass advanced sealing technologies for lids, ensuring leak-proof performance crucial for food delivery services. The emphasis on recyclability is driving the development of containers that are easier to recycle and made from higher recycled content aluminum. These advancements provide a competitive advantage by meeting evolving consumer and regulatory demands for eco-friendly packaging solutions.
Report Segmentation & Scope
This report meticulously segments the Aluminum Foil Takeaway Containers market based on key parameters to provide granular insights.
- Application: The market is analyzed across Foodservices, where strong growth is projected due to the expanding food delivery and takeout culture. Retail and Supermarkets are also detailed, reflecting the increasing demand for convenient, pre-packaged meals. The Others segment, encompassing institutional catering and small eateries, is also covered.
- Types: Segmentation by container capacity includes Up to 200 ML, vital for condiments and smaller portions; 200 ML to 400 ML, a popular choice for individual meals; and 400 ML & Above, catering to larger servings and family portions. Each segment's market size and growth projections are detailed, along with the competitive dynamics shaping their respective landscapes.
Key Drivers of Aluminum Foil Takeaway Containers Growth
Several critical factors are driving the growth of the Aluminum Foil Takeaway Containers market. The escalating demand for convenience and ready-to-eat meals, spurred by busy lifestyles and the expansion of food delivery services, is a primary driver. Technological advancements in manufacturing, leading to cost-effectiveness and improved product features like superior heat retention and durability, also contribute significantly. Economic factors, such as rising disposable incomes and a robust foodservice industry, further bolster market expansion. Moreover, a growing consumer preference for hygienic and reliable food packaging solutions, coupled with the inherent recyclability and barrier properties of aluminum foil, are acting as strong catalysts for market growth.
Challenges in the Aluminum Foil Takeaway Containers Sector
Despite the positive growth trajectory, the Aluminum Foil Takeaway Containers sector faces several challenges. Fluctuations in raw material prices, particularly aluminum, can impact manufacturing costs and profitability. Stringent environmental regulations and increasing consumer awareness about sustainability can lead to a preference for alternative packaging materials, posing a competitive threat. Supply chain disruptions, exacerbated by global events, can affect the availability and cost of raw materials and finished products. Furthermore, intense competition from manufacturers offering lower-cost alternatives or innovative biodegradable options necessitates continuous investment in product development and cost optimization.
Leading Players in the Aluminum Foil Takeaway Containers Market
- Novelis
- Pactiv
- Trinidad Benham Corporation
- Hulamin Containers
- D&W Fine Pack
- Penny Plate
- Handi-foil of America
- Revere Packaging
- Coppice Alupack
- Contital
- Nagreeka Indcon Products
- Eramco
- Wyda Packaging
- Alufoil Products Pvt. Ltd
- Durable Packaging International
- Prestige Packing Industry
Key Developments in Aluminum Foil Takeaway Containers Sector
- 2023 Q4: Launch of new, ultra-lightweight aluminum foil containers with enhanced recyclability features by Pactiv.
- 2023 Q3: Trinidad Benham Corporation announces expansion of production capacity to meet growing demand in the foodservice sector.
- 2023 Q2: Handi-foil of America introduces a new range of oven-safe foil containers with improved lid sealing technology.
- 2023 Q1: Hulamin Containers invests in advanced manufacturing processes to reduce energy consumption and improve sustainability.
- 2022 Q4: D&W Fine Pack acquires a smaller competitor to broaden its product portfolio and market reach.
- 2022 Q3: Revere Packaging collaborates with a major airline to provide customized foil meal trays.
- 2022 Q2: Contital introduces a new line of rectangular foil containers with innovative stackable designs.
- 2022 Q1: Wyda Packaging receives certification for its sustainable manufacturing practices.
Strategic Aluminum Foil Takeaway Containers Market Outlook
The strategic outlook for the Aluminum Foil Takeaway Containers market is highly positive, driven by a confluence of sustained demand and ongoing innovation. Growth accelerators include the continued expansion of online food delivery services, which heavily rely on robust and temperature-stable packaging. The increasing consumer preference for sustainable yet high-performance packaging solutions positions aluminum foil containers favorably, given their recyclability and excellent barrier properties. Opportunities for market players lie in product differentiation through enhanced features like advanced insulation, tamper-evident seals, and eco-friendly designs. Strategic partnerships with food retailers and foodservice providers will be crucial for capturing market share and expanding distribution networks. The market is poised for continued growth as it adapts to evolving consumer needs and embraces advancements in material science and manufacturing technology.
Aluminum Foil Takeaway Containers Segmentation
-
1. Application
- 1.1. Foodservices
- 1.2. Retail and Supermarkets
- 1.3. Others
-
2. Types
- 2.1. Up to 200 ML
- 2.2. 200 ML to 400 ML
- 2.3. 400 ML & Above
Aluminum Foil Takeaway Containers Segmentation By Geography
-
1. North America
- 1.1. United States
- 1.2. Canada
- 1.3. Mexico
-
2. South America
- 2.1. Brazil
- 2.2. Argentina
- 2.3. Rest of South America
-
3. Europe
- 3.1. United Kingdom
- 3.2. Germany
- 3.3. France
- 3.4. Italy
- 3.5. Spain
- 3.6. Russia
- 3.7. Benelux
- 3.8. Nordics
- 3.9. Rest of Europe
-
4. Middle East & Africa
- 4.1. Turkey
- 4.2. Israel
- 4.3. GCC
- 4.4. North Africa
- 4.5. South Africa
- 4.6. Rest of Middle East & Africa
-
5. Asia Pacific
- 5.1. China
- 5.2. India
- 5.3. Japan
- 5.4. South Korea
- 5.5. ASEAN
- 5.6. Oceania
- 5.7. Rest of Asia Pacific
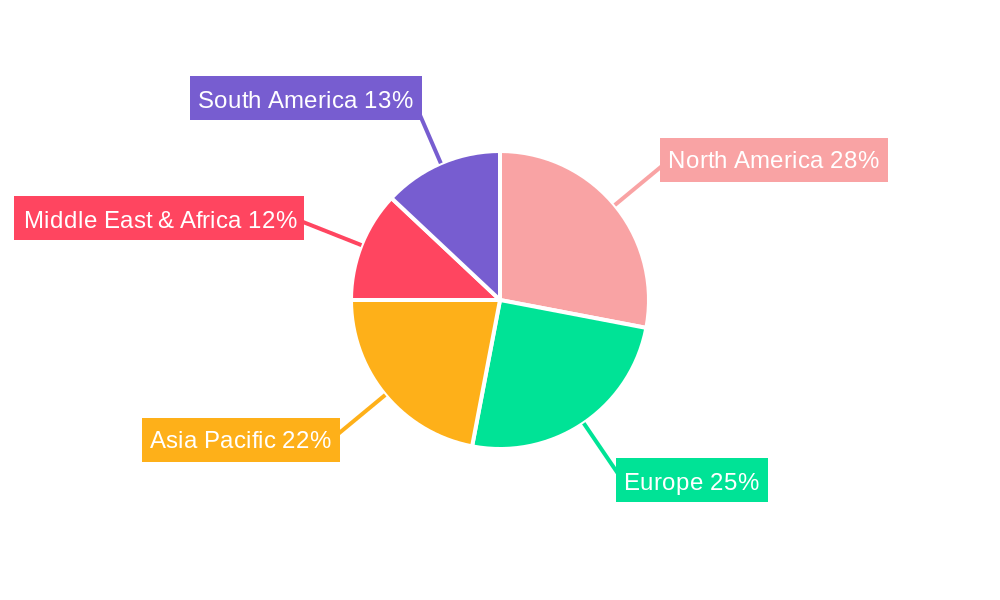
Aluminum Foil Takeaway Containers Regional Market Share
Geographic Coverage of Aluminum Foil Takeaway Containers
Aluminum Foil Takeaway Containers REPORT HIGHLIGHTS
| Aspects | Details |
|---|---|
| Study Period | 2020-2034 |
| Base Year | 2025 |
| Estimated Year | 2026 |
| Forecast Period | 2026-2034 |
| Historical Period | 2020-2025 |
| Growth Rate | CAGR of 4.9% from 2020-2034 |
| Segmentation |
|
Table of Contents
- 1. Introduction
- 1.1. Research Scope
- 1.2. Market Segmentation
- 1.3. Research Methodology
- 1.4. Definitions and Assumptions
- 2. Executive Summary
- 2.1. Introduction
- 3. Market Dynamics
- 3.1. Introduction
- 3.2. Market Drivers
- 3.3. Market Restrains
- 3.4. Market Trends
- 4. Market Factor Analysis
- 4.1. Porters Five Forces
- 4.2. Supply/Value Chain
- 4.3. PESTEL analysis
- 4.4. Market Entropy
- 4.5. Patent/Trademark Analysis
- 5. Global Aluminum Foil Takeaway Containers Analysis, Insights and Forecast, 2020-2032
- 5.1. Market Analysis, Insights and Forecast - by Application
- 5.1.1. Foodservices
- 5.1.2. Retail and Supermarkets
- 5.1.3. Others
- 5.2. Market Analysis, Insights and Forecast - by Types
- 5.2.1. Up to 200 ML
- 5.2.2. 200 ML to 400 ML
- 5.2.3. 400 ML & Above
- 5.3. Market Analysis, Insights and Forecast - by Region
- 5.3.1. North America
- 5.3.2. South America
- 5.3.3. Europe
- 5.3.4. Middle East & Africa
- 5.3.5. Asia Pacific
- 5.1. Market Analysis, Insights and Forecast - by Application
- 6. North America Aluminum Foil Takeaway Containers Analysis, Insights and Forecast, 2020-2032
- 6.1. Market Analysis, Insights and Forecast - by Application
- 6.1.1. Foodservices
- 6.1.2. Retail and Supermarkets
- 6.1.3. Others
- 6.2. Market Analysis, Insights and Forecast - by Types
- 6.2.1. Up to 200 ML
- 6.2.2. 200 ML to 400 ML
- 6.2.3. 400 ML & Above
- 6.1. Market Analysis, Insights and Forecast - by Application
- 7. South America Aluminum Foil Takeaway Containers Analysis, Insights and Forecast, 2020-2032
- 7.1. Market Analysis, Insights and Forecast - by Application
- 7.1.1. Foodservices
- 7.1.2. Retail and Supermarkets
- 7.1.3. Others
- 7.2. Market Analysis, Insights and Forecast - by Types
- 7.2.1. Up to 200 ML
- 7.2.2. 200 ML to 400 ML
- 7.2.3. 400 ML & Above
- 7.1. Market Analysis, Insights and Forecast - by Application
- 8. Europe Aluminum Foil Takeaway Containers Analysis, Insights and Forecast, 2020-2032
- 8.1. Market Analysis, Insights and Forecast - by Application
- 8.1.1. Foodservices
- 8.1.2. Retail and Supermarkets
- 8.1.3. Others
- 8.2. Market Analysis, Insights and Forecast - by Types
- 8.2.1. Up to 200 ML
- 8.2.2. 200 ML to 400 ML
- 8.2.3. 400 ML & Above
- 8.1. Market Analysis, Insights and Forecast - by Application
- 9. Middle East & Africa Aluminum Foil Takeaway Containers Analysis, Insights and Forecast, 2020-2032
- 9.1. Market Analysis, Insights and Forecast - by Application
- 9.1.1. Foodservices
- 9.1.2. Retail and Supermarkets
- 9.1.3. Others
- 9.2. Market Analysis, Insights and Forecast - by Types
- 9.2.1. Up to 200 ML
- 9.2.2. 200 ML to 400 ML
- 9.2.3. 400 ML & Above
- 9.1. Market Analysis, Insights and Forecast - by Application
- 10. Asia Pacific Aluminum Foil Takeaway Containers Analysis, Insights and Forecast, 2020-2032
- 10.1. Market Analysis, Insights and Forecast - by Application
- 10.1.1. Foodservices
- 10.1.2. Retail and Supermarkets
- 10.1.3. Others
- 10.2. Market Analysis, Insights and Forecast - by Types
- 10.2.1. Up to 200 ML
- 10.2.2. 200 ML to 400 ML
- 10.2.3. 400 ML & Above
- 10.1. Market Analysis, Insights and Forecast - by Application
- 11. Competitive Analysis
- 11.1. Global Market Share Analysis 2025
- 11.2. Company Profiles
- 11.2.1 Novelis
- 11.2.1.1. Overview
- 11.2.1.2. Products
- 11.2.1.3. SWOT Analysis
- 11.2.1.4. Recent Developments
- 11.2.1.5. Financials (Based on Availability)
- 11.2.2 Pactiv
- 11.2.2.1. Overview
- 11.2.2.2. Products
- 11.2.2.3. SWOT Analysis
- 11.2.2.4. Recent Developments
- 11.2.2.5. Financials (Based on Availability)
- 11.2.3 Trinidad Benham Corporation
- 11.2.3.1. Overview
- 11.2.3.2. Products
- 11.2.3.3. SWOT Analysis
- 11.2.3.4. Recent Developments
- 11.2.3.5. Financials (Based on Availability)
- 11.2.4 Hulamin Containers
- 11.2.4.1. Overview
- 11.2.4.2. Products
- 11.2.4.3. SWOT Analysis
- 11.2.4.4. Recent Developments
- 11.2.4.5. Financials (Based on Availability)
- 11.2.5 D&W Fine Pack
- 11.2.5.1. Overview
- 11.2.5.2. Products
- 11.2.5.3. SWOT Analysis
- 11.2.5.4. Recent Developments
- 11.2.5.5. Financials (Based on Availability)
- 11.2.6 Penny Plate
- 11.2.6.1. Overview
- 11.2.6.2. Products
- 11.2.6.3. SWOT Analysis
- 11.2.6.4. Recent Developments
- 11.2.6.5. Financials (Based on Availability)
- 11.2.7 Handi-foil of America
- 11.2.7.1. Overview
- 11.2.7.2. Products
- 11.2.7.3. SWOT Analysis
- 11.2.7.4. Recent Developments
- 11.2.7.5. Financials (Based on Availability)
- 11.2.8 Revere Packaging
- 11.2.8.1. Overview
- 11.2.8.2. Products
- 11.2.8.3. SWOT Analysis
- 11.2.8.4. Recent Developments
- 11.2.8.5. Financials (Based on Availability)
- 11.2.9 Coppice Alupack
- 11.2.9.1. Overview
- 11.2.9.2. Products
- 11.2.9.3. SWOT Analysis
- 11.2.9.4. Recent Developments
- 11.2.9.5. Financials (Based on Availability)
- 11.2.10 Contital
- 11.2.10.1. Overview
- 11.2.10.2. Products
- 11.2.10.3. SWOT Analysis
- 11.2.10.4. Recent Developments
- 11.2.10.5. Financials (Based on Availability)
- 11.2.11 Nagreeka Indcon Products
- 11.2.11.1. Overview
- 11.2.11.2. Products
- 11.2.11.3. SWOT Analysis
- 11.2.11.4. Recent Developments
- 11.2.11.5. Financials (Based on Availability)
- 11.2.12 Eramco
- 11.2.12.1. Overview
- 11.2.12.2. Products
- 11.2.12.3. SWOT Analysis
- 11.2.12.4. Recent Developments
- 11.2.12.5. Financials (Based on Availability)
- 11.2.13 Wyda Packaging
- 11.2.13.1. Overview
- 11.2.13.2. Products
- 11.2.13.3. SWOT Analysis
- 11.2.13.4. Recent Developments
- 11.2.13.5. Financials (Based on Availability)
- 11.2.14 Alufoil Products Pvt. Ltd
- 11.2.14.1. Overview
- 11.2.14.2. Products
- 11.2.14.3. SWOT Analysis
- 11.2.14.4. Recent Developments
- 11.2.14.5. Financials (Based on Availability)
- 11.2.15 Durable Packaging International
- 11.2.15.1. Overview
- 11.2.15.2. Products
- 11.2.15.3. SWOT Analysis
- 11.2.15.4. Recent Developments
- 11.2.15.5. Financials (Based on Availability)
- 11.2.16 Prestige Packing Industry
- 11.2.16.1. Overview
- 11.2.16.2. Products
- 11.2.16.3. SWOT Analysis
- 11.2.16.4. Recent Developments
- 11.2.16.5. Financials (Based on Availability)
- 11.2.1 Novelis
List of Figures
- Figure 1: Global Aluminum Foil Takeaway Containers Revenue Breakdown (billion, %) by Region 2025 & 2033
- Figure 2: Global Aluminum Foil Takeaway Containers Volume Breakdown (K, %) by Region 2025 & 2033
- Figure 3: North America Aluminum Foil Takeaway Containers Revenue (billion), by Application 2025 & 2033
- Figure 4: North America Aluminum Foil Takeaway Containers Volume (K), by Application 2025 & 2033
- Figure 5: North America Aluminum Foil Takeaway Containers Revenue Share (%), by Application 2025 & 2033
- Figure 6: North America Aluminum Foil Takeaway Containers Volume Share (%), by Application 2025 & 2033
- Figure 7: North America Aluminum Foil Takeaway Containers Revenue (billion), by Types 2025 & 2033
- Figure 8: North America Aluminum Foil Takeaway Containers Volume (K), by Types 2025 & 2033
- Figure 9: North America Aluminum Foil Takeaway Containers Revenue Share (%), by Types 2025 & 2033
- Figure 10: North America Aluminum Foil Takeaway Containers Volume Share (%), by Types 2025 & 2033
- Figure 11: North America Aluminum Foil Takeaway Containers Revenue (billion), by Country 2025 & 2033
- Figure 12: North America Aluminum Foil Takeaway Containers Volume (K), by Country 2025 & 2033
- Figure 13: North America Aluminum Foil Takeaway Containers Revenue Share (%), by Country 2025 & 2033
- Figure 14: North America Aluminum Foil Takeaway Containers Volume Share (%), by Country 2025 & 2033
- Figure 15: South America Aluminum Foil Takeaway Containers Revenue (billion), by Application 2025 & 2033
- Figure 16: South America Aluminum Foil Takeaway Containers Volume (K), by Application 2025 & 2033
- Figure 17: South America Aluminum Foil Takeaway Containers Revenue Share (%), by Application 2025 & 2033
- Figure 18: South America Aluminum Foil Takeaway Containers Volume Share (%), by Application 2025 & 2033
- Figure 19: South America Aluminum Foil Takeaway Containers Revenue (billion), by Types 2025 & 2033
- Figure 20: South America Aluminum Foil Takeaway Containers Volume (K), by Types 2025 & 2033
- Figure 21: South America Aluminum Foil Takeaway Containers Revenue Share (%), by Types 2025 & 2033
- Figure 22: South America Aluminum Foil Takeaway Containers Volume Share (%), by Types 2025 & 2033
- Figure 23: South America Aluminum Foil Takeaway Containers Revenue (billion), by Country 2025 & 2033
- Figure 24: South America Aluminum Foil Takeaway Containers Volume (K), by Country 2025 & 2033
- Figure 25: South America Aluminum Foil Takeaway Containers Revenue Share (%), by Country 2025 & 2033
- Figure 26: South America Aluminum Foil Takeaway Containers Volume Share (%), by Country 2025 & 2033
- Figure 27: Europe Aluminum Foil Takeaway Containers Revenue (billion), by Application 2025 & 2033
- Figure 28: Europe Aluminum Foil Takeaway Containers Volume (K), by Application 2025 & 2033
- Figure 29: Europe Aluminum Foil Takeaway Containers Revenue Share (%), by Application 2025 & 2033
- Figure 30: Europe Aluminum Foil Takeaway Containers Volume Share (%), by Application 2025 & 2033
- Figure 31: Europe Aluminum Foil Takeaway Containers Revenue (billion), by Types 2025 & 2033
- Figure 32: Europe Aluminum Foil Takeaway Containers Volume (K), by Types 2025 & 2033
- Figure 33: Europe Aluminum Foil Takeaway Containers Revenue Share (%), by Types 2025 & 2033
- Figure 34: Europe Aluminum Foil Takeaway Containers Volume Share (%), by Types 2025 & 2033
- Figure 35: Europe Aluminum Foil Takeaway Containers Revenue (billion), by Country 2025 & 2033
- Figure 36: Europe Aluminum Foil Takeaway Containers Volume (K), by Country 2025 & 2033
- Figure 37: Europe Aluminum Foil Takeaway Containers Revenue Share (%), by Country 2025 & 2033
- Figure 38: Europe Aluminum Foil Takeaway Containers Volume Share (%), by Country 2025 & 2033
- Figure 39: Middle East & Africa Aluminum Foil Takeaway Containers Revenue (billion), by Application 2025 & 2033
- Figure 40: Middle East & Africa Aluminum Foil Takeaway Containers Volume (K), by Application 2025 & 2033
- Figure 41: Middle East & Africa Aluminum Foil Takeaway Containers Revenue Share (%), by Application 2025 & 2033
- Figure 42: Middle East & Africa Aluminum Foil Takeaway Containers Volume Share (%), by Application 2025 & 2033
- Figure 43: Middle East & Africa Aluminum Foil Takeaway Containers Revenue (billion), by Types 2025 & 2033
- Figure 44: Middle East & Africa Aluminum Foil Takeaway Containers Volume (K), by Types 2025 & 2033
- Figure 45: Middle East & Africa Aluminum Foil Takeaway Containers Revenue Share (%), by Types 2025 & 2033
- Figure 46: Middle East & Africa Aluminum Foil Takeaway Containers Volume Share (%), by Types 2025 & 2033
- Figure 47: Middle East & Africa Aluminum Foil Takeaway Containers Revenue (billion), by Country 2025 & 2033
- Figure 48: Middle East & Africa Aluminum Foil Takeaway Containers Volume (K), by Country 2025 & 2033
- Figure 49: Middle East & Africa Aluminum Foil Takeaway Containers Revenue Share (%), by Country 2025 & 2033
- Figure 50: Middle East & Africa Aluminum Foil Takeaway Containers Volume Share (%), by Country 2025 & 2033
- Figure 51: Asia Pacific Aluminum Foil Takeaway Containers Revenue (billion), by Application 2025 & 2033
- Figure 52: Asia Pacific Aluminum Foil Takeaway Containers Volume (K), by Application 2025 & 2033
- Figure 53: Asia Pacific Aluminum Foil Takeaway Containers Revenue Share (%), by Application 2025 & 2033
- Figure 54: Asia Pacific Aluminum Foil Takeaway Containers Volume Share (%), by Application 2025 & 2033
- Figure 55: Asia Pacific Aluminum Foil Takeaway Containers Revenue (billion), by Types 2025 & 2033
- Figure 56: Asia Pacific Aluminum Foil Takeaway Containers Volume (K), by Types 2025 & 2033
- Figure 57: Asia Pacific Aluminum Foil Takeaway Containers Revenue Share (%), by Types 2025 & 2033
- Figure 58: Asia Pacific Aluminum Foil Takeaway Containers Volume Share (%), by Types 2025 & 2033
- Figure 59: Asia Pacific Aluminum Foil Takeaway Containers Revenue (billion), by Country 2025 & 2033
- Figure 60: Asia Pacific Aluminum Foil Takeaway Containers Volume (K), by Country 2025 & 2033
- Figure 61: Asia Pacific Aluminum Foil Takeaway Containers Revenue Share (%), by Country 2025 & 2033
- Figure 62: Asia Pacific Aluminum Foil Takeaway Containers Volume Share (%), by Country 2025 & 2033
List of Tables
- Table 1: Global Aluminum Foil Takeaway Containers Revenue billion Forecast, by Application 2020 & 2033
- Table 2: Global Aluminum Foil Takeaway Containers Volume K Forecast, by Application 2020 & 2033
- Table 3: Global Aluminum Foil Takeaway Containers Revenue billion Forecast, by Types 2020 & 2033
- Table 4: Global Aluminum Foil Takeaway Containers Volume K Forecast, by Types 2020 & 2033
- Table 5: Global Aluminum Foil Takeaway Containers Revenue billion Forecast, by Region 2020 & 2033
- Table 6: Global Aluminum Foil Takeaway Containers Volume K Forecast, by Region 2020 & 2033
- Table 7: Global Aluminum Foil Takeaway Containers Revenue billion Forecast, by Application 2020 & 2033
- Table 8: Global Aluminum Foil Takeaway Containers Volume K Forecast, by Application 2020 & 2033
- Table 9: Global Aluminum Foil Takeaway Containers Revenue billion Forecast, by Types 2020 & 2033
- Table 10: Global Aluminum Foil Takeaway Containers Volume K Forecast, by Types 2020 & 2033
- Table 11: Global Aluminum Foil Takeaway Containers Revenue billion Forecast, by Country 2020 & 2033
- Table 12: Global Aluminum Foil Takeaway Containers Volume K Forecast, by Country 2020 & 2033
- Table 13: United States Aluminum Foil Takeaway Containers Revenue (billion) Forecast, by Application 2020 & 2033
- Table 14: United States Aluminum Foil Takeaway Containers Volume (K) Forecast, by Application 2020 & 2033
- Table 15: Canada Aluminum Foil Takeaway Containers Revenue (billion) Forecast, by Application 2020 & 2033
- Table 16: Canada Aluminum Foil Takeaway Containers Volume (K) Forecast, by Application 2020 & 2033
- Table 17: Mexico Aluminum Foil Takeaway Containers Revenue (billion) Forecast, by Application 2020 & 2033
- Table 18: Mexico Aluminum Foil Takeaway Containers Volume (K) Forecast, by Application 2020 & 2033
- Table 19: Global Aluminum Foil Takeaway Containers Revenue billion Forecast, by Application 2020 & 2033
- Table 20: Global Aluminum Foil Takeaway Containers Volume K Forecast, by Application 2020 & 2033
- Table 21: Global Aluminum Foil Takeaway Containers Revenue billion Forecast, by Types 2020 & 2033
- Table 22: Global Aluminum Foil Takeaway Containers Volume K Forecast, by Types 2020 & 2033
- Table 23: Global Aluminum Foil Takeaway Containers Revenue billion Forecast, by Country 2020 & 2033
- Table 24: Global Aluminum Foil Takeaway Containers Volume K Forecast, by Country 2020 & 2033
- Table 25: Brazil Aluminum Foil Takeaway Containers Revenue (billion) Forecast, by Application 2020 & 2033
- Table 26: Brazil Aluminum Foil Takeaway Containers Volume (K) Forecast, by Application 2020 & 2033
- Table 27: Argentina Aluminum Foil Takeaway Containers Revenue (billion) Forecast, by Application 2020 & 2033
- Table 28: Argentina Aluminum Foil Takeaway Containers Volume (K) Forecast, by Application 2020 & 2033
- Table 29: Rest of South America Aluminum Foil Takeaway Containers Revenue (billion) Forecast, by Application 2020 & 2033
- Table 30: Rest of South America Aluminum Foil Takeaway Containers Volume (K) Forecast, by Application 2020 & 2033
- Table 31: Global Aluminum Foil Takeaway Containers Revenue billion Forecast, by Application 2020 & 2033
- Table 32: Global Aluminum Foil Takeaway Containers Volume K Forecast, by Application 2020 & 2033
- Table 33: Global Aluminum Foil Takeaway Containers Revenue billion Forecast, by Types 2020 & 2033
- Table 34: Global Aluminum Foil Takeaway Containers Volume K Forecast, by Types 2020 & 2033
- Table 35: Global Aluminum Foil Takeaway Containers Revenue billion Forecast, by Country 2020 & 2033
- Table 36: Global Aluminum Foil Takeaway Containers Volume K Forecast, by Country 2020 & 2033
- Table 37: United Kingdom Aluminum Foil Takeaway Containers Revenue (billion) Forecast, by Application 2020 & 2033
- Table 38: United Kingdom Aluminum Foil Takeaway Containers Volume (K) Forecast, by Application 2020 & 2033
- Table 39: Germany Aluminum Foil Takeaway Containers Revenue (billion) Forecast, by Application 2020 & 2033
- Table 40: Germany Aluminum Foil Takeaway Containers Volume (K) Forecast, by Application 2020 & 2033
- Table 41: France Aluminum Foil Takeaway Containers Revenue (billion) Forecast, by Application 2020 & 2033
- Table 42: France Aluminum Foil Takeaway Containers Volume (K) Forecast, by Application 2020 & 2033
- Table 43: Italy Aluminum Foil Takeaway Containers Revenue (billion) Forecast, by Application 2020 & 2033
- Table 44: Italy Aluminum Foil Takeaway Containers Volume (K) Forecast, by Application 2020 & 2033
- Table 45: Spain Aluminum Foil Takeaway Containers Revenue (billion) Forecast, by Application 2020 & 2033
- Table 46: Spain Aluminum Foil Takeaway Containers Volume (K) Forecast, by Application 2020 & 2033
- Table 47: Russia Aluminum Foil Takeaway Containers Revenue (billion) Forecast, by Application 2020 & 2033
- Table 48: Russia Aluminum Foil Takeaway Containers Volume (K) Forecast, by Application 2020 & 2033
- Table 49: Benelux Aluminum Foil Takeaway Containers Revenue (billion) Forecast, by Application 2020 & 2033
- Table 50: Benelux Aluminum Foil Takeaway Containers Volume (K) Forecast, by Application 2020 & 2033
- Table 51: Nordics Aluminum Foil Takeaway Containers Revenue (billion) Forecast, by Application 2020 & 2033
- Table 52: Nordics Aluminum Foil Takeaway Containers Volume (K) Forecast, by Application 2020 & 2033
- Table 53: Rest of Europe Aluminum Foil Takeaway Containers Revenue (billion) Forecast, by Application 2020 & 2033
- Table 54: Rest of Europe Aluminum Foil Takeaway Containers Volume (K) Forecast, by Application 2020 & 2033
- Table 55: Global Aluminum Foil Takeaway Containers Revenue billion Forecast, by Application 2020 & 2033
- Table 56: Global Aluminum Foil Takeaway Containers Volume K Forecast, by Application 2020 & 2033
- Table 57: Global Aluminum Foil Takeaway Containers Revenue billion Forecast, by Types 2020 & 2033
- Table 58: Global Aluminum Foil Takeaway Containers Volume K Forecast, by Types 2020 & 2033
- Table 59: Global Aluminum Foil Takeaway Containers Revenue billion Forecast, by Country 2020 & 2033
- Table 60: Global Aluminum Foil Takeaway Containers Volume K Forecast, by Country 2020 & 2033
- Table 61: Turkey Aluminum Foil Takeaway Containers Revenue (billion) Forecast, by Application 2020 & 2033
- Table 62: Turkey Aluminum Foil Takeaway Containers Volume (K) Forecast, by Application 2020 & 2033
- Table 63: Israel Aluminum Foil Takeaway Containers Revenue (billion) Forecast, by Application 2020 & 2033
- Table 64: Israel Aluminum Foil Takeaway Containers Volume (K) Forecast, by Application 2020 & 2033
- Table 65: GCC Aluminum Foil Takeaway Containers Revenue (billion) Forecast, by Application 2020 & 2033
- Table 66: GCC Aluminum Foil Takeaway Containers Volume (K) Forecast, by Application 2020 & 2033
- Table 67: North Africa Aluminum Foil Takeaway Containers Revenue (billion) Forecast, by Application 2020 & 2033
- Table 68: North Africa Aluminum Foil Takeaway Containers Volume (K) Forecast, by Application 2020 & 2033
- Table 69: South Africa Aluminum Foil Takeaway Containers Revenue (billion) Forecast, by Application 2020 & 2033
- Table 70: South Africa Aluminum Foil Takeaway Containers Volume (K) Forecast, by Application 2020 & 2033
- Table 71: Rest of Middle East & Africa Aluminum Foil Takeaway Containers Revenue (billion) Forecast, by Application 2020 & 2033
- Table 72: Rest of Middle East & Africa Aluminum Foil Takeaway Containers Volume (K) Forecast, by Application 2020 & 2033
- Table 73: Global Aluminum Foil Takeaway Containers Revenue billion Forecast, by Application 2020 & 2033
- Table 74: Global Aluminum Foil Takeaway Containers Volume K Forecast, by Application 2020 & 2033
- Table 75: Global Aluminum Foil Takeaway Containers Revenue billion Forecast, by Types 2020 & 2033
- Table 76: Global Aluminum Foil Takeaway Containers Volume K Forecast, by Types 2020 & 2033
- Table 77: Global Aluminum Foil Takeaway Containers Revenue billion Forecast, by Country 2020 & 2033
- Table 78: Global Aluminum Foil Takeaway Containers Volume K Forecast, by Country 2020 & 2033
- Table 79: China Aluminum Foil Takeaway Containers Revenue (billion) Forecast, by Application 2020 & 2033
- Table 80: China Aluminum Foil Takeaway Containers Volume (K) Forecast, by Application 2020 & 2033
- Table 81: India Aluminum Foil Takeaway Containers Revenue (billion) Forecast, by Application 2020 & 2033
- Table 82: India Aluminum Foil Takeaway Containers Volume (K) Forecast, by Application 2020 & 2033
- Table 83: Japan Aluminum Foil Takeaway Containers Revenue (billion) Forecast, by Application 2020 & 2033
- Table 84: Japan Aluminum Foil Takeaway Containers Volume (K) Forecast, by Application 2020 & 2033
- Table 85: South Korea Aluminum Foil Takeaway Containers Revenue (billion) Forecast, by Application 2020 & 2033
- Table 86: South Korea Aluminum Foil Takeaway Containers Volume (K) Forecast, by Application 2020 & 2033
- Table 87: ASEAN Aluminum Foil Takeaway Containers Revenue (billion) Forecast, by Application 2020 & 2033
- Table 88: ASEAN Aluminum Foil Takeaway Containers Volume (K) Forecast, by Application 2020 & 2033
- Table 89: Oceania Aluminum Foil Takeaway Containers Revenue (billion) Forecast, by Application 2020 & 2033
- Table 90: Oceania Aluminum Foil Takeaway Containers Volume (K) Forecast, by Application 2020 & 2033
- Table 91: Rest of Asia Pacific Aluminum Foil Takeaway Containers Revenue (billion) Forecast, by Application 2020 & 2033
- Table 92: Rest of Asia Pacific Aluminum Foil Takeaway Containers Volume (K) Forecast, by Application 2020 & 2033
Frequently Asked Questions
1. What is the projected Compound Annual Growth Rate (CAGR) of the Aluminum Foil Takeaway Containers?
The projected CAGR is approximately 4.9%.
2. Which companies are prominent players in the Aluminum Foil Takeaway Containers?
Key companies in the market include Novelis, Pactiv, Trinidad Benham Corporation, Hulamin Containers, D&W Fine Pack, Penny Plate, Handi-foil of America, Revere Packaging, Coppice Alupack, Contital, Nagreeka Indcon Products, Eramco, Wyda Packaging, Alufoil Products Pvt. Ltd, Durable Packaging International, Prestige Packing Industry.
3. What are the main segments of the Aluminum Foil Takeaway Containers?
The market segments include Application, Types.
4. Can you provide details about the market size?
The market size is estimated to be USD 40.47 billion as of 2022.
5. What are some drivers contributing to market growth?
N/A
6. What are the notable trends driving market growth?
N/A
7. Are there any restraints impacting market growth?
N/A
8. Can you provide examples of recent developments in the market?
N/A
9. What pricing options are available for accessing the report?
Pricing options include single-user, multi-user, and enterprise licenses priced at USD 3350.00, USD 5025.00, and USD 6700.00 respectively.
10. Is the market size provided in terms of value or volume?
The market size is provided in terms of value, measured in billion and volume, measured in K.
11. Are there any specific market keywords associated with the report?
Yes, the market keyword associated with the report is "Aluminum Foil Takeaway Containers," which aids in identifying and referencing the specific market segment covered.
12. How do I determine which pricing option suits my needs best?
The pricing options vary based on user requirements and access needs. Individual users may opt for single-user licenses, while businesses requiring broader access may choose multi-user or enterprise licenses for cost-effective access to the report.
13. Are there any additional resources or data provided in the Aluminum Foil Takeaway Containers report?
While the report offers comprehensive insights, it's advisable to review the specific contents or supplementary materials provided to ascertain if additional resources or data are available.
14. How can I stay updated on further developments or reports in the Aluminum Foil Takeaway Containers?
To stay informed about further developments, trends, and reports in the Aluminum Foil Takeaway Containers, consider subscribing to industry newsletters, following relevant companies and organizations, or regularly checking reputable industry news sources and publications.
Methodology
Step 1 - Identification of Relevant Samples Size from Population Database


Step 2 - Approaches for Defining Global Market Size (Value, Volume* & Price*)

Note*: In applicable scenarios
Step 3 - Data Sources
Primary Research
- Web Analytics
- Survey Reports
- Research Institute
- Latest Research Reports
- Opinion Leaders
Secondary Research
- Annual Reports
- White Paper
- Latest Press Release
- Industry Association
- Paid Database
- Investor Presentations

Step 4 - Data Triangulation
Involves using different sources of information in order to increase the validity of a study
These sources are likely to be stakeholders in a program - participants, other researchers, program staff, other community members, and so on.
Then we put all data in single framework & apply various statistical tools to find out the dynamic on the market.
During the analysis stage, feedback from the stakeholder groups would be compared to determine areas of agreement as well as areas of divergence