
Key Insights
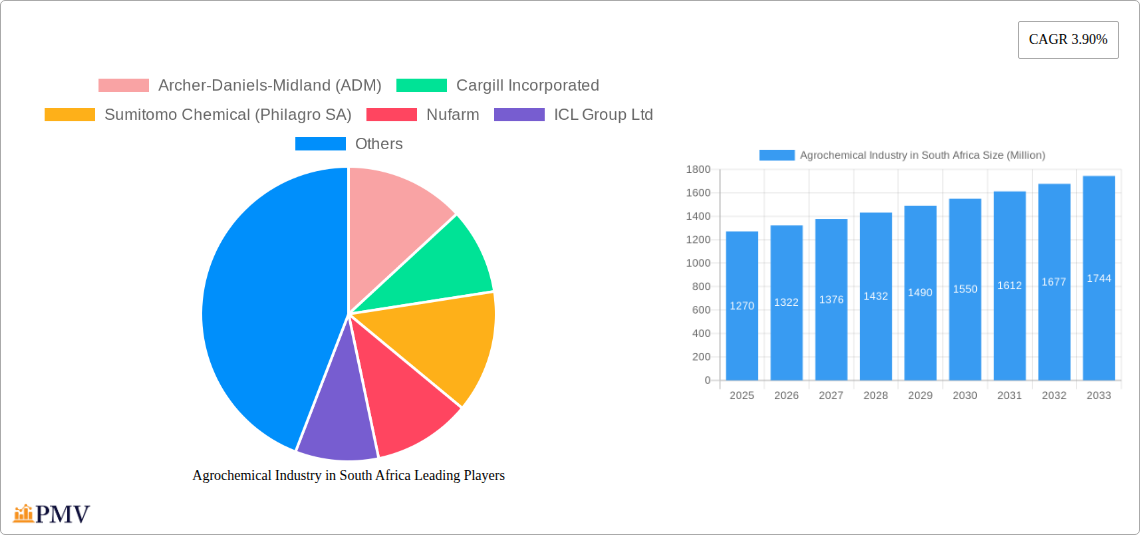
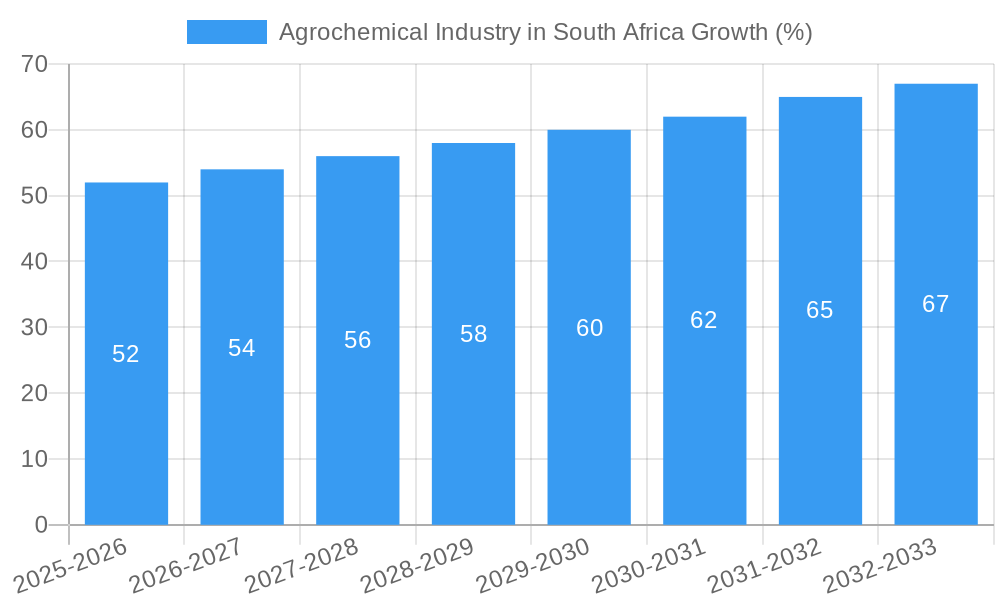
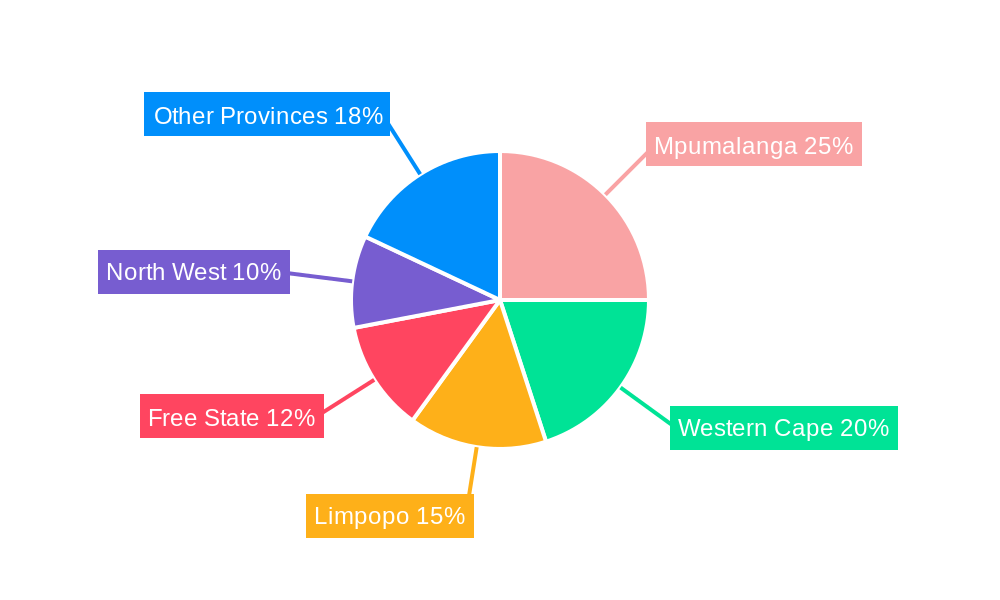
The South African agrochemical market, valued at approximately $1.27 billion in 2025, is projected to experience steady growth, driven by factors such as increasing agricultural productivity demands, the growing adoption of advanced farming techniques, and government initiatives promoting food security. The market's Compound Annual Growth Rate (CAGR) of 3.90% from 2025 to 2033 suggests a considerable expansion over the forecast period. Key segments within this market include fertilizers, pesticides, and adjuvants, with crop-based applications dominating, particularly in major crops like maize, wheat, and sugarcane. The growth is further fueled by the rising prevalence of pests and diseases affecting crops, demanding more sophisticated pest control solutions. However, challenges such as stringent environmental regulations, fluctuating commodity prices, and water scarcity may act as potential restraints on market growth. Major players like Bayer CropScience AG, Syngenta AG, and local distributors play a crucial role in shaping the market landscape. The increasing focus on sustainable agricultural practices, including integrated pest management (IPM) and precision farming, will likely influence the demand for specific agrochemical products and drive innovation within the sector. The regional distribution within South Africa itself will show variance based on agricultural intensity and specific crop requirements, with regions like Mpumalanga and the Western Cape likely exhibiting higher demand due to their significant agricultural production.
The South African agrochemical market is characterized by a diverse range of players, including multinational corporations and local distributors. The competitive landscape involves strategic partnerships, mergers and acquisitions, and continuous product innovation to cater to evolving farmer needs. Government policies aiming to improve agricultural efficiency and address climate change impacts are expected to further shape the market's trajectory. Growth will also depend on factors like improving farmer access to finance, and better education and extension services for optimal agrochemical usage and sustainable practices. The market's segmentation by application (crop-based, fruit and vegetable, non-crop) provides insights into specific demands within different agricultural segments. Focus on high-value crops such as fruits and vegetables is likely to drive demand for specialized agrochemicals, while the overall growth will depend on various macroeconomic factors influencing the agricultural sector's performance.
South Africa Agrochemical Industry Report: 2019-2033
This comprehensive report provides a detailed analysis of the South African agrochemical market, offering invaluable insights for industry stakeholders, investors, and researchers. Covering the period 2019-2033, with a focus on 2025, this report unveils the market's structure, competitive dynamics, growth drivers, and future outlook. The study includes granular segmentation by type (fertilizers, pesticides, adjuvants, plant growth regulators) and application (crop-based, fruits and vegetables, non-crop-based, turf and ornamental grass). Market sizes are presented in Millions, providing a clear picture of the financial landscape.
Agrochemical Industry in South Africa Market Structure & Competitive Dynamics
The South African agrochemical market exhibits a moderately concentrated structure, with several multinational corporations and a few significant domestic players holding substantial market share. The market is characterized by intense competition, driven by innovation and the introduction of new and improved products. Regulatory frameworks, while aiming to ensure environmental protection and food safety, present both challenges and opportunities for companies. Product substitution, particularly in the fertilizer sector, is a significant factor impacting market dynamics. End-user trends, shaped by evolving farming practices and a growing emphasis on sustainable agriculture, are influencing product demand. M&A activity has been moderate in recent years, with deal values averaging xx Million. Key players have engaged in strategic acquisitions to expand their product portfolios and market reach.
- Market Concentration: The top 5 players hold approximately xx% of the market share in 2025.
- Innovation Ecosystems: Collaborative research and development initiatives between universities and private companies are driving innovation.
- Regulatory Framework: Stringent regulations regarding pesticide registration and usage impact market entry and product lifecycle.
- Product Substitutes: Biopesticides and organic fertilizers represent emerging substitute options.
- End-User Trends: Increasing adoption of precision agriculture and a focus on sustainable farming practices drive demand for specific agrochemical solutions.
- M&A Activity: Recent years have witnessed xx major M&A deals, totaling approximately xx Million in value.
Agrochemical Industry in South Africa Industry Trends & Insights
The South African agrochemical market is projected to witness robust growth, driven by factors such as increasing agricultural production, favorable government policies promoting agricultural development, and the rising adoption of advanced farming techniques. The market experienced a CAGR of xx% during the historical period (2019-2024) and is anticipated to maintain a CAGR of xx% during the forecast period (2025-2033). Technological advancements, particularly in precision agriculture, are transforming the industry by optimizing fertilizer and pesticide application, minimizing environmental impact and maximizing yields. Changing consumer preferences for sustainably produced food also drive demand for environmentally friendly agrochemicals. Intense competition among leading players is leading to product innovation, price optimization, and improved services. Market penetration of advanced agrochemical products is steadily increasing, particularly in the high-value crop segments.
Dominant Markets & Segments in Agrochemical Industry in South Africa
The South African agrochemical market is largely dominated by the crop-based segment, particularly maize, wheat, and sugarcane. The fertilizer segment holds the largest market share, driven by the need for increased crop yields. Within the crop-based segment, the maize sector exhibits the highest demand for both fertilizers and pesticides.
- Key Drivers of Dominance:
- Favorable Climatic Conditions: Suitable weather patterns for various crops contribute to higher demand for agrochemicals.
- Government Support: Agricultural subsidies and policies encourage crop production, boosting agrochemical usage.
- Infrastructure Development: Improved irrigation and transportation systems facilitate wider distribution of agrochemicals.
The non-crop-based segment, encompassing fruits and vegetables, is experiencing significant growth, fueled by increasing consumer demand for fresh produce. The turf and ornamental grass segment is relatively smaller but is showing promising growth potential due to increasing urbanization and landscaping activities.
Agrochemical Industry in South Africa Product Innovations
Recent product innovations focus on developing environmentally friendly and high-efficacy agrochemicals. This includes the introduction of biopesticides, slow-release fertilizers, and precision application technologies. These innovations cater to the increasing demand for sustainable agricultural practices and enhance crop yields while minimizing environmental impact. Companies are investing heavily in research and development to create products with improved efficacy, reduced toxicity, and targeted delivery systems. The adoption of digital technologies, such as remote sensing and data analytics, is also transforming product development and application.
Report Segmentation & Scope
This report segments the South African agrochemical market based on product type (Fertilizers, Pesticides, Adjuvants, Plant Growth Regulators) and application (Crop-based, Fruits and Vegetables, Non-crop-based, Turf and Ornamental Grass). Each segment is analyzed in detail, covering market size, growth projections, and competitive landscape. For example, the fertilizer segment is expected to grow at a CAGR of xx% during the forecast period, driven by increasing demand from the crop-based sector. The pesticide segment is experiencing growth due to evolving pest resistance and the need for effective pest management solutions. The adjuvants market is anticipated to grow moderately, benefiting from increasing pesticide usage. Similarly, the plant growth regulators market displays potential due to their growing importance in precision agriculture. The crop-based application segment holds the largest market share and is expected to exhibit strong growth, while the non-crop-based segment shows potential for significant growth.
Key Drivers of Agrochemical Industry in South Africa Growth
Several factors are driving growth in the South African agrochemical industry. Increased agricultural production, driven by rising domestic and export demand, is a key factor. Government initiatives promoting agricultural development and modernization, including investments in irrigation infrastructure and farmer training, stimulate market growth. The adoption of advanced farming techniques, such as precision agriculture and sustainable farming practices, enhances the efficiency of agrochemical usage.
Challenges in the Agrochemical Industry in South Africa Sector
The South African agrochemical industry faces several challenges. Stricter environmental regulations and increasing concerns about pesticide residues pose hurdles to market entry and expansion. Supply chain disruptions and fluctuations in raw material prices impact production costs and profitability. Intense competition among established players and the emergence of new competitors create pressure on margins. Furthermore, climate change poses a significant challenge, impacting crop yields and potentially altering the demand for specific agrochemicals. These factors combined may result in a xx% reduction in overall market growth if not adequately addressed.
Leading Players in the Agrochemical Industry in South Africa Market
- Archer-Daniels-Midland (ADM)
- Cargill Incorporated
- Sumitomo Chemical (Philagro SA)
- Nufarm
- ICL Group Ltd
- UPL Limited
- BASF SE
- FMC Corporation
- Sociedad Química y Minera de Chile (SQM)
- Belaruskali
- Sasol Limited
- K+S AG
- ADAMA Ltd
- Uralkal
- CF Industries Holdings
- OCP Group
- Land O' Lakes (Villa Crop Protection (Pty) Ltd)
- Yara International ASA
- Syngenta AG
- Nutrien Ltd
- Corteva Agriscience
- Bayer CropScience AG
Key Developments in Agrochemical Industry in South Africa Sector
- 2022 Q4: Introduction of a new biopesticide by UPL Limited.
- 2023 Q1: Acquisition of a local agrochemical company by a multinational player.
- 2023 Q2: Launch of a new precision agriculture technology by BASF SE.
- 2024 Q1: New regulations regarding pesticide usage implemented by the government.
Strategic Agrochemical Industry in South Africa Market Outlook
The South African agrochemical market presents significant growth potential, driven by increasing agricultural output, the adoption of advanced farming techniques, and favorable government policies. Strategic opportunities lie in developing sustainable and high-efficacy agrochemical solutions, investing in precision agriculture technologies, and expanding into the growing non-crop-based segment. Companies can leverage technological advancements, partnerships, and collaborations to enhance their market position and capture substantial growth opportunities. The market is poised for robust expansion, offering lucrative opportunities for both established and new entrants.
Agrochemical Industry in South Africa Segmentation
- 1. Production Analysis
- 2. Consumption Analysis
- 3. Import Market Analysis (Value & Volume)
- 4. Export Market Analysis (Value & Volume)
- 5. Price Trend Analysis
Agrochemical Industry in South Africa Segmentation By Geography
-
1. North America
- 1.1. United States
- 1.2. Canada
- 1.3. Mexico
-
2. South America
- 2.1. Brazil
- 2.2. Argentina
- 2.3. Rest of South America
-
3. Europe
- 3.1. United Kingdom
- 3.2. Germany
- 3.3. France
- 3.4. Italy
- 3.5. Spain
- 3.6. Russia
- 3.7. Benelux
- 3.8. Nordics
- 3.9. Rest of Europe
-
4. Middle East & Africa
- 4.1. Turkey
- 4.2. Israel
- 4.3. GCC
- 4.4. North Africa
- 4.5. South Africa
- 4.6. Rest of Middle East & Africa
-
5. Asia Pacific
- 5.1. China
- 5.2. India
- 5.3. Japan
- 5.4. South Korea
- 5.5. ASEAN
- 5.6. Oceania
- 5.7. Rest of Asia Pacific
Agrochemical Industry in South Africa REPORT HIGHLIGHTS
| Aspects | Details |
|---|---|
| Study Period | 2019-2033 |
| Base Year | 2024 |
| Estimated Year | 2025 |
| Forecast Period | 2025-2033 |
| Historical Period | 2019-2024 |
| Growth Rate | CAGR of 3.90% from 2019-2033 |
| Segmentation |
|
Table of Contents
- 1. Introduction
- 1.1. Research Scope
- 1.2. Market Segmentation
- 1.3. Research Methodology
- 1.4. Definitions and Assumptions
- 2. Executive Summary
- 2.1. Introduction
- 3. Market Dynamics
- 3.1. Introduction
- 3.2. Market Drivers
- 3.2.1. Adoption of Organic and Eco-friendly Farming Practices; Declining Area of Arable Land and Rising Food Security Concerns
- 3.3. Market Restrains
- 3.3.1. High Demand for Conventional and Synthetic Products; Lack of Awareness and Other Factors Limiting the Adoption of Agricultural Inoculants
- 3.4. Market Trends
- 3.4.1. Increasing Adoption of Bio-based Agrochemicals
- 4. Market Factor Analysis
- 4.1. Porters Five Forces
- 4.2. Supply/Value Chain
- 4.3. PESTEL analysis
- 4.4. Market Entropy
- 4.5. Patent/Trademark Analysis
- 5. Global Agrochemical Industry in South Africa Analysis, Insights and Forecast, 2019-2031
- 5.1. Market Analysis, Insights and Forecast - by Production Analysis
- 5.2. Market Analysis, Insights and Forecast - by Consumption Analysis
- 5.3. Market Analysis, Insights and Forecast - by Import Market Analysis (Value & Volume)
- 5.4. Market Analysis, Insights and Forecast - by Export Market Analysis (Value & Volume)
- 5.5. Market Analysis, Insights and Forecast - by Price Trend Analysis
- 5.6. Market Analysis, Insights and Forecast - by Region
- 5.6.1. North America
- 5.6.2. South America
- 5.6.3. Europe
- 5.6.4. Middle East & Africa
- 5.6.5. Asia Pacific
- 5.1. Market Analysis, Insights and Forecast - by Production Analysis
- 6. North America Agrochemical Industry in South Africa Analysis, Insights and Forecast, 2019-2031
- 6.1. Market Analysis, Insights and Forecast - by Production Analysis
- 6.2. Market Analysis, Insights and Forecast - by Consumption Analysis
- 6.3. Market Analysis, Insights and Forecast - by Import Market Analysis (Value & Volume)
- 6.4. Market Analysis, Insights and Forecast - by Export Market Analysis (Value & Volume)
- 6.5. Market Analysis, Insights and Forecast - by Price Trend Analysis
- 6.1. Market Analysis, Insights and Forecast - by Production Analysis
- 7. South America Agrochemical Industry in South Africa Analysis, Insights and Forecast, 2019-2031
- 7.1. Market Analysis, Insights and Forecast - by Production Analysis
- 7.2. Market Analysis, Insights and Forecast - by Consumption Analysis
- 7.3. Market Analysis, Insights and Forecast - by Import Market Analysis (Value & Volume)
- 7.4. Market Analysis, Insights and Forecast - by Export Market Analysis (Value & Volume)
- 7.5. Market Analysis, Insights and Forecast - by Price Trend Analysis
- 7.1. Market Analysis, Insights and Forecast - by Production Analysis
- 8. Europe Agrochemical Industry in South Africa Analysis, Insights and Forecast, 2019-2031
- 8.1. Market Analysis, Insights and Forecast - by Production Analysis
- 8.2. Market Analysis, Insights and Forecast - by Consumption Analysis
- 8.3. Market Analysis, Insights and Forecast - by Import Market Analysis (Value & Volume)
- 8.4. Market Analysis, Insights and Forecast - by Export Market Analysis (Value & Volume)
- 8.5. Market Analysis, Insights and Forecast - by Price Trend Analysis
- 8.1. Market Analysis, Insights and Forecast - by Production Analysis
- 9. Middle East & Africa Agrochemical Industry in South Africa Analysis, Insights and Forecast, 2019-2031
- 9.1. Market Analysis, Insights and Forecast - by Production Analysis
- 9.2. Market Analysis, Insights and Forecast - by Consumption Analysis
- 9.3. Market Analysis, Insights and Forecast - by Import Market Analysis (Value & Volume)
- 9.4. Market Analysis, Insights and Forecast - by Export Market Analysis (Value & Volume)
- 9.5. Market Analysis, Insights and Forecast - by Price Trend Analysis
- 9.1. Market Analysis, Insights and Forecast - by Production Analysis
- 10. Asia Pacific Agrochemical Industry in South Africa Analysis, Insights and Forecast, 2019-2031
- 10.1. Market Analysis, Insights and Forecast - by Production Analysis
- 10.2. Market Analysis, Insights and Forecast - by Consumption Analysis
- 10.3. Market Analysis, Insights and Forecast - by Import Market Analysis (Value & Volume)
- 10.4. Market Analysis, Insights and Forecast - by Export Market Analysis (Value & Volume)
- 10.5. Market Analysis, Insights and Forecast - by Price Trend Analysis
- 10.1. Market Analysis, Insights and Forecast - by Production Analysis
- 11. South Africa Agrochemical Industry in South Africa Analysis, Insights and Forecast, 2019-2031
- 12. Sudan Agrochemical Industry in South Africa Analysis, Insights and Forecast, 2019-2031
- 13. Uganda Agrochemical Industry in South Africa Analysis, Insights and Forecast, 2019-2031
- 14. Tanzania Agrochemical Industry in South Africa Analysis, Insights and Forecast, 2019-2031
- 15. Kenya Agrochemical Industry in South Africa Analysis, Insights and Forecast, 2019-2031
- 16. Rest of Africa Agrochemical Industry in South Africa Analysis, Insights and Forecast, 2019-2031
- 17. Competitive Analysis
- 17.1. Global Market Share Analysis 2024
- 17.2. Company Profiles
- 17.2.1 Archer-Daniels-Midland (ADM)
- 17.2.1.1. Overview
- 17.2.1.2. Products
- 17.2.1.3. SWOT Analysis
- 17.2.1.4. Recent Developments
- 17.2.1.5. Financials (Based on Availability)
- 17.2.2 Cargill Incorporated
- 17.2.2.1. Overview
- 17.2.2.2. Products
- 17.2.2.3. SWOT Analysis
- 17.2.2.4. Recent Developments
- 17.2.2.5. Financials (Based on Availability)
- 17.2.3 Sumitomo Chemical (Philagro SA)
- 17.2.3.1. Overview
- 17.2.3.2. Products
- 17.2.3.3. SWOT Analysis
- 17.2.3.4. Recent Developments
- 17.2.3.5. Financials (Based on Availability)
- 17.2.4 Nufarm
- 17.2.4.1. Overview
- 17.2.4.2. Products
- 17.2.4.3. SWOT Analysis
- 17.2.4.4. Recent Developments
- 17.2.4.5. Financials (Based on Availability)
- 17.2.5 ICL Group Ltd
- 17.2.5.1. Overview
- 17.2.5.2. Products
- 17.2.5.3. SWOT Analysis
- 17.2.5.4. Recent Developments
- 17.2.5.5. Financials (Based on Availability)
- 17.2.6 UPL Limited
- 17.2.6.1. Overview
- 17.2.6.2. Products
- 17.2.6.3. SWOT Analysis
- 17.2.6.4. Recent Developments
- 17.2.6.5. Financials (Based on Availability)
- 17.2.7 BASF SE
- 17.2.7.1. Overview
- 17.2.7.2. Products
- 17.2.7.3. SWOT Analysis
- 17.2.7.4. Recent Developments
- 17.2.7.5. Financials (Based on Availability)
- 17.2.8 FMC Corporation
- 17.2.8.1. Overview
- 17.2.8.2. Products
- 17.2.8.3. SWOT Analysis
- 17.2.8.4. Recent Developments
- 17.2.8.5. Financials (Based on Availability)
- 17.2.9 Sociedad Química y Minera de Chile (SQM)
- 17.2.9.1. Overview
- 17.2.9.2. Products
- 17.2.9.3. SWOT Analysis
- 17.2.9.4. Recent Developments
- 17.2.9.5. Financials (Based on Availability)
- 17.2.10 Belaruskali
- 17.2.10.1. Overview
- 17.2.10.2. Products
- 17.2.10.3. SWOT Analysis
- 17.2.10.4. Recent Developments
- 17.2.10.5. Financials (Based on Availability)
- 17.2.11 Sasol Limited
- 17.2.11.1. Overview
- 17.2.11.2. Products
- 17.2.11.3. SWOT Analysis
- 17.2.11.4. Recent Developments
- 17.2.11.5. Financials (Based on Availability)
- 17.2.12 K+S AG
- 17.2.12.1. Overview
- 17.2.12.2. Products
- 17.2.12.3. SWOT Analysis
- 17.2.12.4. Recent Developments
- 17.2.12.5. Financials (Based on Availability)
- 17.2.13 ADAMA Ltd
- 17.2.13.1. Overview
- 17.2.13.2. Products
- 17.2.13.3. SWOT Analysis
- 17.2.13.4. Recent Developments
- 17.2.13.5. Financials (Based on Availability)
- 17.2.14 Uralkal
- 17.2.14.1. Overview
- 17.2.14.2. Products
- 17.2.14.3. SWOT Analysis
- 17.2.14.4. Recent Developments
- 17.2.14.5. Financials (Based on Availability)
- 17.2.15 CF Industries Holdings
- 17.2.15.1. Overview
- 17.2.15.2. Products
- 17.2.15.3. SWOT Analysis
- 17.2.15.4. Recent Developments
- 17.2.15.5. Financials (Based on Availability)
- 17.2.16 OCP Group
- 17.2.16.1. Overview
- 17.2.16.2. Products
- 17.2.16.3. SWOT Analysis
- 17.2.16.4. Recent Developments
- 17.2.16.5. Financials (Based on Availability)
- 17.2.17 Land O' Lakes (Villa Crop Protection (Pty) Ltd
- 17.2.17.1. Overview
- 17.2.17.2. Products
- 17.2.17.3. SWOT Analysis
- 17.2.17.4. Recent Developments
- 17.2.17.5. Financials (Based on Availability)
- 17.2.18 Yara International ASA
- 17.2.18.1. Overview
- 17.2.18.2. Products
- 17.2.18.3. SWOT Analysis
- 17.2.18.4. Recent Developments
- 17.2.18.5. Financials (Based on Availability)
- 17.2.19 Syngenta AG
- 17.2.19.1. Overview
- 17.2.19.2. Products
- 17.2.19.3. SWOT Analysis
- 17.2.19.4. Recent Developments
- 17.2.19.5. Financials (Based on Availability)
- 17.2.20 Nutrien Ltd
- 17.2.20.1. Overview
- 17.2.20.2. Products
- 17.2.20.3. SWOT Analysis
- 17.2.20.4. Recent Developments
- 17.2.20.5. Financials (Based on Availability)
- 17.2.21 Corteva Agriscience
- 17.2.21.1. Overview
- 17.2.21.2. Products
- 17.2.21.3. SWOT Analysis
- 17.2.21.4. Recent Developments
- 17.2.21.5. Financials (Based on Availability)
- 17.2.22 Bayer CropScience AG
- 17.2.22.1. Overview
- 17.2.22.2. Products
- 17.2.22.3. SWOT Analysis
- 17.2.22.4. Recent Developments
- 17.2.22.5. Financials (Based on Availability)
- 17.2.1 Archer-Daniels-Midland (ADM)
List of Figures
- Figure 1: Global Agrochemical Industry in South Africa Revenue Breakdown (Million, %) by Region 2024 & 2032
- Figure 2: Africa Agrochemical Industry in South Africa Revenue (Million), by Country 2024 & 2032
- Figure 3: Africa Agrochemical Industry in South Africa Revenue Share (%), by Country 2024 & 2032
- Figure 4: North America Agrochemical Industry in South Africa Revenue (Million), by Production Analysis 2024 & 2032
- Figure 5: North America Agrochemical Industry in South Africa Revenue Share (%), by Production Analysis 2024 & 2032
- Figure 6: North America Agrochemical Industry in South Africa Revenue (Million), by Consumption Analysis 2024 & 2032
- Figure 7: North America Agrochemical Industry in South Africa Revenue Share (%), by Consumption Analysis 2024 & 2032
- Figure 8: North America Agrochemical Industry in South Africa Revenue (Million), by Import Market Analysis (Value & Volume) 2024 & 2032
- Figure 9: North America Agrochemical Industry in South Africa Revenue Share (%), by Import Market Analysis (Value & Volume) 2024 & 2032
- Figure 10: North America Agrochemical Industry in South Africa Revenue (Million), by Export Market Analysis (Value & Volume) 2024 & 2032
- Figure 11: North America Agrochemical Industry in South Africa Revenue Share (%), by Export Market Analysis (Value & Volume) 2024 & 2032
- Figure 12: North America Agrochemical Industry in South Africa Revenue (Million), by Price Trend Analysis 2024 & 2032
- Figure 13: North America Agrochemical Industry in South Africa Revenue Share (%), by Price Trend Analysis 2024 & 2032
- Figure 14: North America Agrochemical Industry in South Africa Revenue (Million), by Country 2024 & 2032
- Figure 15: North America Agrochemical Industry in South Africa Revenue Share (%), by Country 2024 & 2032
- Figure 16: South America Agrochemical Industry in South Africa Revenue (Million), by Production Analysis 2024 & 2032
- Figure 17: South America Agrochemical Industry in South Africa Revenue Share (%), by Production Analysis 2024 & 2032
- Figure 18: South America Agrochemical Industry in South Africa Revenue (Million), by Consumption Analysis 2024 & 2032
- Figure 19: South America Agrochemical Industry in South Africa Revenue Share (%), by Consumption Analysis 2024 & 2032
- Figure 20: South America Agrochemical Industry in South Africa Revenue (Million), by Import Market Analysis (Value & Volume) 2024 & 2032
- Figure 21: South America Agrochemical Industry in South Africa Revenue Share (%), by Import Market Analysis (Value & Volume) 2024 & 2032
- Figure 22: South America Agrochemical Industry in South Africa Revenue (Million), by Export Market Analysis (Value & Volume) 2024 & 2032
- Figure 23: South America Agrochemical Industry in South Africa Revenue Share (%), by Export Market Analysis (Value & Volume) 2024 & 2032
- Figure 24: South America Agrochemical Industry in South Africa Revenue (Million), by Price Trend Analysis 2024 & 2032
- Figure 25: South America Agrochemical Industry in South Africa Revenue Share (%), by Price Trend Analysis 2024 & 2032
- Figure 26: South America Agrochemical Industry in South Africa Revenue (Million), by Country 2024 & 2032
- Figure 27: South America Agrochemical Industry in South Africa Revenue Share (%), by Country 2024 & 2032
- Figure 28: Europe Agrochemical Industry in South Africa Revenue (Million), by Production Analysis 2024 & 2032
- Figure 29: Europe Agrochemical Industry in South Africa Revenue Share (%), by Production Analysis 2024 & 2032
- Figure 30: Europe Agrochemical Industry in South Africa Revenue (Million), by Consumption Analysis 2024 & 2032
- Figure 31: Europe Agrochemical Industry in South Africa Revenue Share (%), by Consumption Analysis 2024 & 2032
- Figure 32: Europe Agrochemical Industry in South Africa Revenue (Million), by Import Market Analysis (Value & Volume) 2024 & 2032
- Figure 33: Europe Agrochemical Industry in South Africa Revenue Share (%), by Import Market Analysis (Value & Volume) 2024 & 2032
- Figure 34: Europe Agrochemical Industry in South Africa Revenue (Million), by Export Market Analysis (Value & Volume) 2024 & 2032
- Figure 35: Europe Agrochemical Industry in South Africa Revenue Share (%), by Export Market Analysis (Value & Volume) 2024 & 2032
- Figure 36: Europe Agrochemical Industry in South Africa Revenue (Million), by Price Trend Analysis 2024 & 2032
- Figure 37: Europe Agrochemical Industry in South Africa Revenue Share (%), by Price Trend Analysis 2024 & 2032
- Figure 38: Europe Agrochemical Industry in South Africa Revenue (Million), by Country 2024 & 2032
- Figure 39: Europe Agrochemical Industry in South Africa Revenue Share (%), by Country 2024 & 2032
- Figure 40: Middle East & Africa Agrochemical Industry in South Africa Revenue (Million), by Production Analysis 2024 & 2032
- Figure 41: Middle East & Africa Agrochemical Industry in South Africa Revenue Share (%), by Production Analysis 2024 & 2032
- Figure 42: Middle East & Africa Agrochemical Industry in South Africa Revenue (Million), by Consumption Analysis 2024 & 2032
- Figure 43: Middle East & Africa Agrochemical Industry in South Africa Revenue Share (%), by Consumption Analysis 2024 & 2032
- Figure 44: Middle East & Africa Agrochemical Industry in South Africa Revenue (Million), by Import Market Analysis (Value & Volume) 2024 & 2032
- Figure 45: Middle East & Africa Agrochemical Industry in South Africa Revenue Share (%), by Import Market Analysis (Value & Volume) 2024 & 2032
- Figure 46: Middle East & Africa Agrochemical Industry in South Africa Revenue (Million), by Export Market Analysis (Value & Volume) 2024 & 2032
- Figure 47: Middle East & Africa Agrochemical Industry in South Africa Revenue Share (%), by Export Market Analysis (Value & Volume) 2024 & 2032
- Figure 48: Middle East & Africa Agrochemical Industry in South Africa Revenue (Million), by Price Trend Analysis 2024 & 2032
- Figure 49: Middle East & Africa Agrochemical Industry in South Africa Revenue Share (%), by Price Trend Analysis 2024 & 2032
- Figure 50: Middle East & Africa Agrochemical Industry in South Africa Revenue (Million), by Country 2024 & 2032
- Figure 51: Middle East & Africa Agrochemical Industry in South Africa Revenue Share (%), by Country 2024 & 2032
- Figure 52: Asia Pacific Agrochemical Industry in South Africa Revenue (Million), by Production Analysis 2024 & 2032
- Figure 53: Asia Pacific Agrochemical Industry in South Africa Revenue Share (%), by Production Analysis 2024 & 2032
- Figure 54: Asia Pacific Agrochemical Industry in South Africa Revenue (Million), by Consumption Analysis 2024 & 2032
- Figure 55: Asia Pacific Agrochemical Industry in South Africa Revenue Share (%), by Consumption Analysis 2024 & 2032
- Figure 56: Asia Pacific Agrochemical Industry in South Africa Revenue (Million), by Import Market Analysis (Value & Volume) 2024 & 2032
- Figure 57: Asia Pacific Agrochemical Industry in South Africa Revenue Share (%), by Import Market Analysis (Value & Volume) 2024 & 2032
- Figure 58: Asia Pacific Agrochemical Industry in South Africa Revenue (Million), by Export Market Analysis (Value & Volume) 2024 & 2032
- Figure 59: Asia Pacific Agrochemical Industry in South Africa Revenue Share (%), by Export Market Analysis (Value & Volume) 2024 & 2032
- Figure 60: Asia Pacific Agrochemical Industry in South Africa Revenue (Million), by Price Trend Analysis 2024 & 2032
- Figure 61: Asia Pacific Agrochemical Industry in South Africa Revenue Share (%), by Price Trend Analysis 2024 & 2032
- Figure 62: Asia Pacific Agrochemical Industry in South Africa Revenue (Million), by Country 2024 & 2032
- Figure 63: Asia Pacific Agrochemical Industry in South Africa Revenue Share (%), by Country 2024 & 2032
List of Tables
- Table 1: Global Agrochemical Industry in South Africa Revenue Million Forecast, by Region 2019 & 2032
- Table 2: Global Agrochemical Industry in South Africa Revenue Million Forecast, by Production Analysis 2019 & 2032
- Table 3: Global Agrochemical Industry in South Africa Revenue Million Forecast, by Consumption Analysis 2019 & 2032
- Table 4: Global Agrochemical Industry in South Africa Revenue Million Forecast, by Import Market Analysis (Value & Volume) 2019 & 2032
- Table 5: Global Agrochemical Industry in South Africa Revenue Million Forecast, by Export Market Analysis (Value & Volume) 2019 & 2032
- Table 6: Global Agrochemical Industry in South Africa Revenue Million Forecast, by Price Trend Analysis 2019 & 2032
- Table 7: Global Agrochemical Industry in South Africa Revenue Million Forecast, by Region 2019 & 2032
- Table 8: Global Agrochemical Industry in South Africa Revenue Million Forecast, by Country 2019 & 2032
- Table 9: South Africa Agrochemical Industry in South Africa Revenue (Million) Forecast, by Application 2019 & 2032
- Table 10: Sudan Agrochemical Industry in South Africa Revenue (Million) Forecast, by Application 2019 & 2032
- Table 11: Uganda Agrochemical Industry in South Africa Revenue (Million) Forecast, by Application 2019 & 2032
- Table 12: Tanzania Agrochemical Industry in South Africa Revenue (Million) Forecast, by Application 2019 & 2032
- Table 13: Kenya Agrochemical Industry in South Africa Revenue (Million) Forecast, by Application 2019 & 2032
- Table 14: Rest of Africa Agrochemical Industry in South Africa Revenue (Million) Forecast, by Application 2019 & 2032
- Table 15: Global Agrochemical Industry in South Africa Revenue Million Forecast, by Production Analysis 2019 & 2032
- Table 16: Global Agrochemical Industry in South Africa Revenue Million Forecast, by Consumption Analysis 2019 & 2032
- Table 17: Global Agrochemical Industry in South Africa Revenue Million Forecast, by Import Market Analysis (Value & Volume) 2019 & 2032
- Table 18: Global Agrochemical Industry in South Africa Revenue Million Forecast, by Export Market Analysis (Value & Volume) 2019 & 2032
- Table 19: Global Agrochemical Industry in South Africa Revenue Million Forecast, by Price Trend Analysis 2019 & 2032
- Table 20: Global Agrochemical Industry in South Africa Revenue Million Forecast, by Country 2019 & 2032
- Table 21: United States Agrochemical Industry in South Africa Revenue (Million) Forecast, by Application 2019 & 2032
- Table 22: Canada Agrochemical Industry in South Africa Revenue (Million) Forecast, by Application 2019 & 2032
- Table 23: Mexico Agrochemical Industry in South Africa Revenue (Million) Forecast, by Application 2019 & 2032
- Table 24: Global Agrochemical Industry in South Africa Revenue Million Forecast, by Production Analysis 2019 & 2032
- Table 25: Global Agrochemical Industry in South Africa Revenue Million Forecast, by Consumption Analysis 2019 & 2032
- Table 26: Global Agrochemical Industry in South Africa Revenue Million Forecast, by Import Market Analysis (Value & Volume) 2019 & 2032
- Table 27: Global Agrochemical Industry in South Africa Revenue Million Forecast, by Export Market Analysis (Value & Volume) 2019 & 2032
- Table 28: Global Agrochemical Industry in South Africa Revenue Million Forecast, by Price Trend Analysis 2019 & 2032
- Table 29: Global Agrochemical Industry in South Africa Revenue Million Forecast, by Country 2019 & 2032
- Table 30: Brazil Agrochemical Industry in South Africa Revenue (Million) Forecast, by Application 2019 & 2032
- Table 31: Argentina Agrochemical Industry in South Africa Revenue (Million) Forecast, by Application 2019 & 2032
- Table 32: Rest of South America Agrochemical Industry in South Africa Revenue (Million) Forecast, by Application 2019 & 2032
- Table 33: Global Agrochemical Industry in South Africa Revenue Million Forecast, by Production Analysis 2019 & 2032
- Table 34: Global Agrochemical Industry in South Africa Revenue Million Forecast, by Consumption Analysis 2019 & 2032
- Table 35: Global Agrochemical Industry in South Africa Revenue Million Forecast, by Import Market Analysis (Value & Volume) 2019 & 2032
- Table 36: Global Agrochemical Industry in South Africa Revenue Million Forecast, by Export Market Analysis (Value & Volume) 2019 & 2032
- Table 37: Global Agrochemical Industry in South Africa Revenue Million Forecast, by Price Trend Analysis 2019 & 2032
- Table 38: Global Agrochemical Industry in South Africa Revenue Million Forecast, by Country 2019 & 2032
- Table 39: United Kingdom Agrochemical Industry in South Africa Revenue (Million) Forecast, by Application 2019 & 2032
- Table 40: Germany Agrochemical Industry in South Africa Revenue (Million) Forecast, by Application 2019 & 2032
- Table 41: France Agrochemical Industry in South Africa Revenue (Million) Forecast, by Application 2019 & 2032
- Table 42: Italy Agrochemical Industry in South Africa Revenue (Million) Forecast, by Application 2019 & 2032
- Table 43: Spain Agrochemical Industry in South Africa Revenue (Million) Forecast, by Application 2019 & 2032
- Table 44: Russia Agrochemical Industry in South Africa Revenue (Million) Forecast, by Application 2019 & 2032
- Table 45: Benelux Agrochemical Industry in South Africa Revenue (Million) Forecast, by Application 2019 & 2032
- Table 46: Nordics Agrochemical Industry in South Africa Revenue (Million) Forecast, by Application 2019 & 2032
- Table 47: Rest of Europe Agrochemical Industry in South Africa Revenue (Million) Forecast, by Application 2019 & 2032
- Table 48: Global Agrochemical Industry in South Africa Revenue Million Forecast, by Production Analysis 2019 & 2032
- Table 49: Global Agrochemical Industry in South Africa Revenue Million Forecast, by Consumption Analysis 2019 & 2032
- Table 50: Global Agrochemical Industry in South Africa Revenue Million Forecast, by Import Market Analysis (Value & Volume) 2019 & 2032
- Table 51: Global Agrochemical Industry in South Africa Revenue Million Forecast, by Export Market Analysis (Value & Volume) 2019 & 2032
- Table 52: Global Agrochemical Industry in South Africa Revenue Million Forecast, by Price Trend Analysis 2019 & 2032
- Table 53: Global Agrochemical Industry in South Africa Revenue Million Forecast, by Country 2019 & 2032
- Table 54: Turkey Agrochemical Industry in South Africa Revenue (Million) Forecast, by Application 2019 & 2032
- Table 55: Israel Agrochemical Industry in South Africa Revenue (Million) Forecast, by Application 2019 & 2032
- Table 56: GCC Agrochemical Industry in South Africa Revenue (Million) Forecast, by Application 2019 & 2032
- Table 57: North Africa Agrochemical Industry in South Africa Revenue (Million) Forecast, by Application 2019 & 2032
- Table 58: South Africa Agrochemical Industry in South Africa Revenue (Million) Forecast, by Application 2019 & 2032
- Table 59: Rest of Middle East & Africa Agrochemical Industry in South Africa Revenue (Million) Forecast, by Application 2019 & 2032
- Table 60: Global Agrochemical Industry in South Africa Revenue Million Forecast, by Production Analysis 2019 & 2032
- Table 61: Global Agrochemical Industry in South Africa Revenue Million Forecast, by Consumption Analysis 2019 & 2032
- Table 62: Global Agrochemical Industry in South Africa Revenue Million Forecast, by Import Market Analysis (Value & Volume) 2019 & 2032
- Table 63: Global Agrochemical Industry in South Africa Revenue Million Forecast, by Export Market Analysis (Value & Volume) 2019 & 2032
- Table 64: Global Agrochemical Industry in South Africa Revenue Million Forecast, by Price Trend Analysis 2019 & 2032
- Table 65: Global Agrochemical Industry in South Africa Revenue Million Forecast, by Country 2019 & 2032
- Table 66: China Agrochemical Industry in South Africa Revenue (Million) Forecast, by Application 2019 & 2032
- Table 67: India Agrochemical Industry in South Africa Revenue (Million) Forecast, by Application 2019 & 2032
- Table 68: Japan Agrochemical Industry in South Africa Revenue (Million) Forecast, by Application 2019 & 2032
- Table 69: South Korea Agrochemical Industry in South Africa Revenue (Million) Forecast, by Application 2019 & 2032
- Table 70: ASEAN Agrochemical Industry in South Africa Revenue (Million) Forecast, by Application 2019 & 2032
- Table 71: Oceania Agrochemical Industry in South Africa Revenue (Million) Forecast, by Application 2019 & 2032
- Table 72: Rest of Asia Pacific Agrochemical Industry in South Africa Revenue (Million) Forecast, by Application 2019 & 2032
Frequently Asked Questions
1. What is the projected Compound Annual Growth Rate (CAGR) of the Agrochemical Industry in South Africa?
The projected CAGR is approximately 3.90%.
2. Which companies are prominent players in the Agrochemical Industry in South Africa?
Key companies in the market include Archer-Daniels-Midland (ADM), Cargill Incorporated, Sumitomo Chemical (Philagro SA), Nufarm, ICL Group Ltd, UPL Limited, BASF SE, FMC Corporation, Sociedad Química y Minera de Chile (SQM), Belaruskali, Sasol Limited, K+S AG, ADAMA Ltd, Uralkal, CF Industries Holdings, OCP Group, Land O' Lakes (Villa Crop Protection (Pty) Ltd, Yara International ASA, Syngenta AG, Nutrien Ltd, Corteva Agriscience, Bayer CropScience AG.
3. What are the main segments of the Agrochemical Industry in South Africa?
The market segments include Production Analysis, Consumption Analysis, Import Market Analysis (Value & Volume), Export Market Analysis (Value & Volume), Price Trend Analysis.
4. Can you provide details about the market size?
The market size is estimated to be USD 1.27 Million as of 2022.
5. What are some drivers contributing to market growth?
Adoption of Organic and Eco-friendly Farming Practices; Declining Area of Arable Land and Rising Food Security Concerns.
6. What are the notable trends driving market growth?
Increasing Adoption of Bio-based Agrochemicals.
7. Are there any restraints impacting market growth?
High Demand for Conventional and Synthetic Products; Lack of Awareness and Other Factors Limiting the Adoption of Agricultural Inoculants.
8. Can you provide examples of recent developments in the market?
N/A
9. What pricing options are available for accessing the report?
Pricing options include single-user, multi-user, and enterprise licenses priced at USD 3800, USD 4500, and USD 5800 respectively.
10. Is the market size provided in terms of value or volume?
The market size is provided in terms of value, measured in Million.
11. Are there any specific market keywords associated with the report?
Yes, the market keyword associated with the report is "Agrochemical Industry in South Africa," which aids in identifying and referencing the specific market segment covered.
12. How do I determine which pricing option suits my needs best?
The pricing options vary based on user requirements and access needs. Individual users may opt for single-user licenses, while businesses requiring broader access may choose multi-user or enterprise licenses for cost-effective access to the report.
13. Are there any additional resources or data provided in the Agrochemical Industry in South Africa report?
While the report offers comprehensive insights, it's advisable to review the specific contents or supplementary materials provided to ascertain if additional resources or data are available.
14. How can I stay updated on further developments or reports in the Agrochemical Industry in South Africa?
To stay informed about further developments, trends, and reports in the Agrochemical Industry in South Africa, consider subscribing to industry newsletters, following relevant companies and organizations, or regularly checking reputable industry news sources and publications.
Methodology
Step 1 - Identification of Relevant Samples Size from Population Database


Step 2 - Approaches for Defining Global Market Size (Value, Volume* & Price*)

Note*: In applicable scenarios
Step 3 - Data Sources
Primary Research
- Web Analytics
- Survey Reports
- Research Institute
- Latest Research Reports
- Opinion Leaders
Secondary Research
- Annual Reports
- White Paper
- Latest Press Release
- Industry Association
- Paid Database
- Investor Presentations

Step 4 - Data Triangulation
Involves using different sources of information in order to increase the validity of a study
These sources are likely to be stakeholders in a program - participants, other researchers, program staff, other community members, and so on.
Then we put all data in single framework & apply various statistical tools to find out the dynamic on the market.
During the analysis stage, feedback from the stakeholder groups would be compared to determine areas of agreement as well as areas of divergence


