
Key Insights
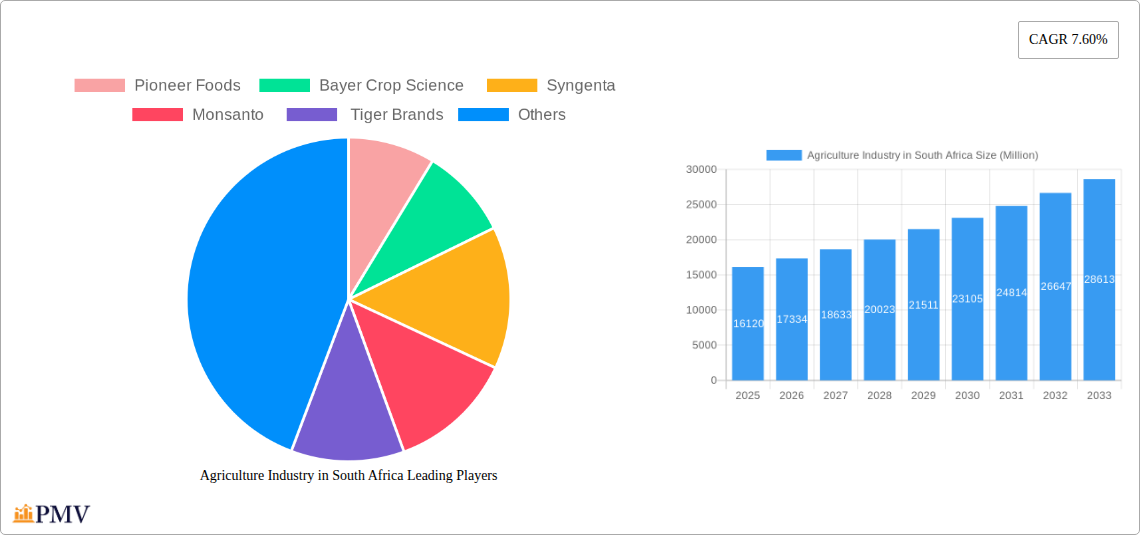
The South African agricultural industry, valued at $16.12 billion in 2025, is projected to experience robust growth, driven by increasing demand for food and agricultural products, both domestically and for export. A Compound Annual Growth Rate (CAGR) of 7.60% from 2025 to 2033 indicates a significant expansion of the market. Key drivers include government initiatives promoting agricultural modernization and sustainable farming practices, growing investment in irrigation and technology, and a rising middle class with increased disposable income fueling demand for diverse agricultural products. The industry's segmentation reveals strong performance across various crop types, with cereals, fruits, vegetables, and oilseeds all contributing to overall growth. Leading companies like Pioneer Foods, Bayer Crop Science, Syngenta, Monsanto, and Tiger Brands are actively shaping the market through innovation and strategic partnerships. However, challenges remain, including water scarcity in certain regions, climate change impacting yields, and the need for improved infrastructure and supply chain logistics. Addressing these constraints is critical to realizing the full potential of the South African agricultural sector.
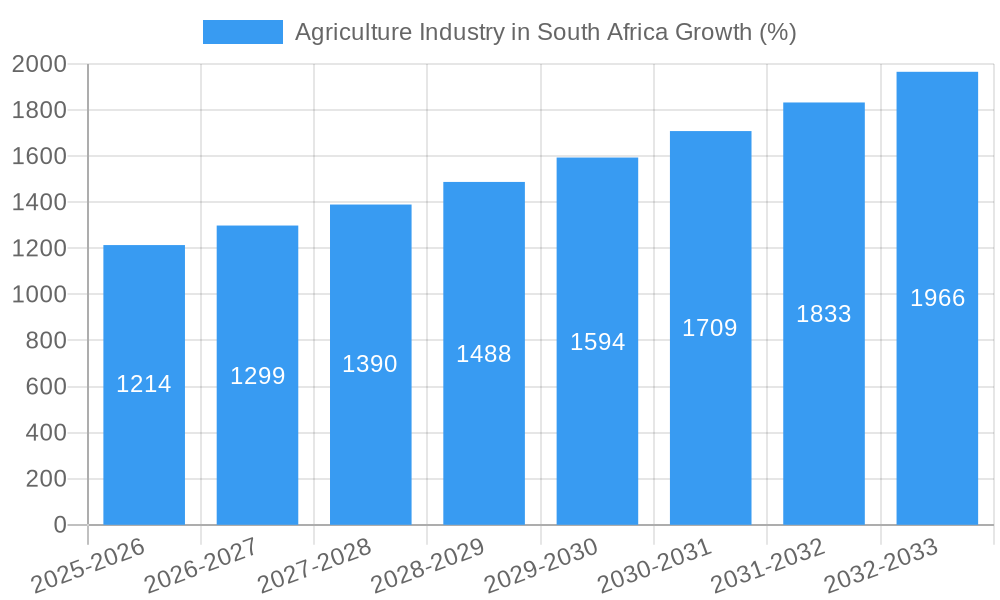
The forecast period (2025-2033) is expected to witness a continuous expansion, with significant growth anticipated in value-added agricultural products and processed foods. Regional variations within South Africa will likely persist, with some areas experiencing faster growth than others. The continued investment in research and development, coupled with the adoption of advanced agricultural technologies, will play a vital role in enhancing productivity and resilience. Furthermore, the government's focus on land reform and empowering smallholder farmers will be crucial in ensuring equitable growth and sustainability within the sector. The competitive landscape will continue to see consolidation and strategic alliances, with multinational corporations and local players vying for market share. The overall outlook for the South African agricultural sector is positive, offering significant opportunities for investors and stakeholders alike.
South Africa Agriculture Industry Report: 2019-2033 - Market Analysis, Trends & Forecasts
This comprehensive report provides an in-depth analysis of the South African agriculture industry, covering market structure, competitive dynamics, key segments, and future growth prospects. The study period spans from 2019 to 2033, with a focus on the forecast period of 2025-2033 and a base year of 2025. The report utilizes data from the historical period (2019-2024) to create a robust and accurate projection of future market trends. This report is invaluable for investors, industry professionals, and policymakers seeking to understand and capitalize on opportunities within this dynamic sector.
Agriculture Industry in South Africa Market Structure & Competitive Dynamics
The South African agriculture industry exhibits a moderately concentrated market structure, with several large players dominating specific segments. Pioneer Foods, Tiger Brands, Bayer Crop Science, Syngenta, and Monsanto are key players. Market share fluctuates based on crop type and seasonal conditions, with estimated combined market share of the top 5 players at approximately 60% in 2025. The industry is influenced by a dynamic regulatory framework focused on land reform and food security. Innovation ecosystems are primarily driven by multinational corporations investing in research and development for improved crop yields and pest control. The prevalence of product substitutes, particularly in the processed food sector, necessitates continuous innovation. End-user trends favor sustainably produced, high-quality agricultural products, driving demand for organic and traceable produce. M&A activity has been relatively modest in recent years, with total deal value estimated at xx Million in 2024. Future M&A activity may increase as companies seek economies of scale and access to new technologies.
- Market Concentration: Moderately concentrated with significant players holding substantial market share.
- Innovation: Driven by MNC R&D in improved crop yields and pest control.
- Regulatory Framework: Focused on land reform and food security, impacting market access and investment.
- Product Substitutes: Presence of substitutes necessitates continuous innovation for competitive advantage.
- End-User Trends: Growing preference for sustainably produced, high-quality agricultural products.
- M&A Activity: xx Million in deal value estimated in 2024, potential for increased activity in the forecast period.
Agriculture Industry in South Africa Industry Trends & Insights
The South African agriculture industry is experiencing notable growth, driven by increasing domestic consumption and export opportunities. Technological advancements, such as precision agriculture and improved irrigation techniques, are enhancing productivity. Consumer preferences are shifting towards healthier and more convenient food options, driving demand for value-added products. However, climate change poses a significant challenge, leading to unpredictable weather patterns and impacting crop yields. The industry faces ongoing pressures from fluctuating commodity prices and input costs. The Compound Annual Growth Rate (CAGR) for the overall agricultural sector is projected to be approximately 4% during the forecast period (2025-2033). Market penetration of new technologies, such as precision farming, is steadily increasing, with an estimated penetration rate of 25% by 2033. Competitive dynamics are marked by increased focus on sustainability and traceability, driving the need for eco-friendly practices and robust supply chain management.
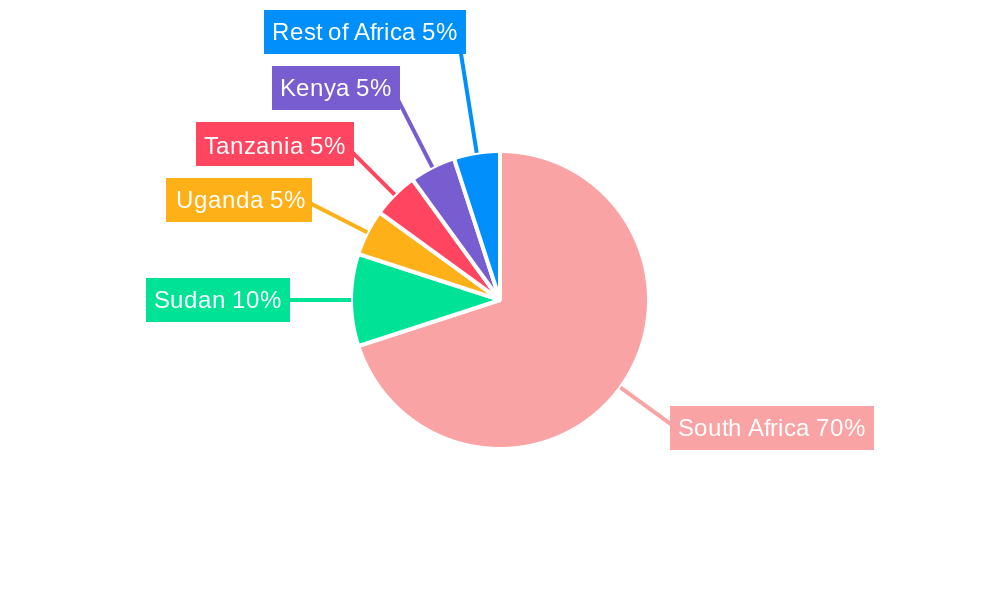
Dominant Markets & Segments in Agriculture Industry in South Africa
The South African agriculture industry displays significant regional variations, with certain areas excelling in specific crop types. While a detailed breakdown of regional dominance requires extensive local data, we can analyze the leading crop segments:
- Cereals: This segment continues to be a dominant force, driven by strong domestic demand and export opportunities for maize and wheat. Key drivers include favorable government policies supporting grain production and established infrastructure for storage and distribution. Market size for cereals was approximately xx Million in 2025.
- Fruits: The fruit sector, notably citrus and deciduous fruits, shows high export potential, dependent on global market demand and logistical efficiencies. Key drivers include favorable climatic conditions in certain regions and access to export markets. The market size for fruits is estimated to be xx Million in 2025.
- Vegetables: The vegetable segment is characterized by a mix of large-scale commercial production and smaller-scale farming. Key drivers include increasing health consciousness among consumers and government initiatives promoting local vegetable consumption. Market size is estimated at xx Million in 2025.
- Oilseeds: The oilseed sector, primarily sunflowers and soybeans, demonstrates fluctuating growth based on international oil prices and demand. Key drivers include government support for oilseed production and potential for biofuel applications. Market size is estimated to be xx Million in 2025.
Agriculture Industry in South Africa Product Innovations
The South African agriculture industry is witnessing significant product innovation, driven by the need for higher yields, pest resistance, and improved nutritional content. Technological advancements in seed technology, precision agriculture, and biotechnology are key drivers of innovation. New crop varieties with improved drought tolerance and disease resistance are gaining traction. The application of data analytics and remote sensing technologies is enhancing farm management practices and optimizing resource utilization. These innovations are leading to improved efficiency, reduced input costs, and enhanced competitiveness in both domestic and international markets.
Report Segmentation & Scope
This report segments the South African agriculture industry by crop type: Cereals, Fruits, Vegetables, and Oilseeds. Each segment's analysis includes market size estimations for 2025, growth projections for 2025-2033, and an assessment of the competitive landscape. This granular segmentation allows for a precise understanding of the opportunities and challenges within each specific crop type. The report further explores sub-segments within each category to give a more detailed market overview.
Key Drivers of Agriculture Industry in South Africa Growth
Several factors are driving the growth of South Africa's agriculture industry. These include:
- Technological advancements: Precision agriculture, improved irrigation systems, and biotechnology are boosting productivity and efficiency.
- Government policies: Initiatives promoting agricultural development and investment are creating a supportive environment.
- Favorable climatic conditions: In specific regions, climatic conditions are conducive to high yields for various crops.
- Growing domestic demand: Increasing population and rising incomes are fueling demand for agricultural products.
- Export opportunities: Access to international markets presents opportunities for growth, particularly for high-value crops.
Challenges in the Agriculture Industry in South Africa Sector
The South African agriculture industry faces several challenges, hindering growth potential:
- Climate change: Unpredictable weather patterns, including droughts and floods, significantly impact crop yields.
- Land reform issues: Land tenure and ownership remain complex, creating uncertainty for investment and long-term planning.
- Infrastructure constraints: Limited access to irrigation, storage, and transportation infrastructure hampers efficient operations.
- Input costs: Fluctuating prices for fertilizers, seeds, and fuel increase production expenses.
- Competition from imports: Imports of certain agricultural products pose a competitive threat to local producers.
Leading Players in the Agriculture Industry in South Africa Market
- Pioneer Foods
- Bayer Crop Science
- Syngenta
- Monsanto (Note: Monsanto is now part of Bayer)
- Tiger Brands
Key Developments in Agriculture Industry in South Africa Sector
- 2022 Q3: Government announces new agricultural investment incentives.
- 2023 Q1: Major drought impacts maize production in key regions.
- 2024 Q2: New precision agriculture technology introduced by a leading player.
- 2024 Q4: Increased investment in sustainable agriculture practices announced.
Strategic Agriculture Industry in South Africa Market Outlook
The South African agriculture industry presents significant opportunities for growth, despite the challenges. Technological advancements, coupled with strategic government policies and increasing domestic and export demand, will drive future growth. Investment in sustainable agriculture practices, infrastructure development, and addressing land reform issues are crucial for realizing the sector's full potential. The focus on value-added products and the integration of technology throughout the value chain will be key success factors in the years to come. The market is poised for continued expansion, particularly in high-value crops and value-added products.
Agriculture Industry in South Africa Segmentation
-
1. Crop Type
- 1.1. Cereals
- 1.2. Fruits
- 1.3. Vegetables
- 1.4. Oilseeds
-
2. Crop Type
- 2.1. Cereals
- 2.2. Fruits
- 2.3. Vegetables
- 2.4. Oilseeds
Agriculture Industry in South Africa Segmentation By Geography
-
1. North America
- 1.1. United States
- 1.2. Canada
- 1.3. Mexico
-
2. South America
- 2.1. Brazil
- 2.2. Argentina
- 2.3. Rest of South America
-
3. Europe
- 3.1. United Kingdom
- 3.2. Germany
- 3.3. France
- 3.4. Italy
- 3.5. Spain
- 3.6. Russia
- 3.7. Benelux
- 3.8. Nordics
- 3.9. Rest of Europe
-
4. Middle East & Africa
- 4.1. Turkey
- 4.2. Israel
- 4.3. GCC
- 4.4. North Africa
- 4.5. South Africa
- 4.6. Rest of Middle East & Africa
-
5. Asia Pacific
- 5.1. China
- 5.2. India
- 5.3. Japan
- 5.4. South Korea
- 5.5. ASEAN
- 5.6. Oceania
- 5.7. Rest of Asia Pacific
Agriculture Industry in South Africa REPORT HIGHLIGHTS
| Aspects | Details |
|---|---|
| Study Period | 2019-2033 |
| Base Year | 2024 |
| Estimated Year | 2025 |
| Forecast Period | 2025-2033 |
| Historical Period | 2019-2024 |
| Growth Rate | CAGR of 7.60% from 2019-2033 |
| Segmentation |
|
Table of Contents
- 1. Introduction
- 1.1. Research Scope
- 1.2. Market Segmentation
- 1.3. Research Methodology
- 1.4. Definitions and Assumptions
- 2. Executive Summary
- 2.1. Introduction
- 3. Market Dynamics
- 3.1. Introduction
- 3.2. Market Drivers
- 3.2.1. Rising Consumption of Cashew Nuts as a Healthy Snack; Increasing Government initiatives; Growing Cashew Nut Imports in The United States
- 3.3. Market Restrains
- 3.3.1. Hazardous Climatic Condition Hinders Cashew Production; Stringent Regulations Related To Food Quality Standards
- 3.4. Market Trends
- 3.4.1. High Demand for Food Crops with the rising population
- 4. Market Factor Analysis
- 4.1. Porters Five Forces
- 4.2. Supply/Value Chain
- 4.3. PESTEL analysis
- 4.4. Market Entropy
- 4.5. Patent/Trademark Analysis
- 5. Global Agriculture Industry in South Africa Analysis, Insights and Forecast, 2019-2031
- 5.1. Market Analysis, Insights and Forecast - by Crop Type
- 5.1.1. Cereals
- 5.1.2. Fruits
- 5.1.3. Vegetables
- 5.1.4. Oilseeds
- 5.2. Market Analysis, Insights and Forecast - by Crop Type
- 5.2.1. Cereals
- 5.2.2. Fruits
- 5.2.3. Vegetables
- 5.2.4. Oilseeds
- 5.3. Market Analysis, Insights and Forecast - by Region
- 5.3.1. North America
- 5.3.2. South America
- 5.3.3. Europe
- 5.3.4. Middle East & Africa
- 5.3.5. Asia Pacific
- 5.1. Market Analysis, Insights and Forecast - by Crop Type
- 6. North America Agriculture Industry in South Africa Analysis, Insights and Forecast, 2019-2031
- 6.1. Market Analysis, Insights and Forecast - by Crop Type
- 6.1.1. Cereals
- 6.1.2. Fruits
- 6.1.3. Vegetables
- 6.1.4. Oilseeds
- 6.2. Market Analysis, Insights and Forecast - by Crop Type
- 6.2.1. Cereals
- 6.2.2. Fruits
- 6.2.3. Vegetables
- 6.2.4. Oilseeds
- 6.1. Market Analysis, Insights and Forecast - by Crop Type
- 7. South America Agriculture Industry in South Africa Analysis, Insights and Forecast, 2019-2031
- 7.1. Market Analysis, Insights and Forecast - by Crop Type
- 7.1.1. Cereals
- 7.1.2. Fruits
- 7.1.3. Vegetables
- 7.1.4. Oilseeds
- 7.2. Market Analysis, Insights and Forecast - by Crop Type
- 7.2.1. Cereals
- 7.2.2. Fruits
- 7.2.3. Vegetables
- 7.2.4. Oilseeds
- 7.1. Market Analysis, Insights and Forecast - by Crop Type
- 8. Europe Agriculture Industry in South Africa Analysis, Insights and Forecast, 2019-2031
- 8.1. Market Analysis, Insights and Forecast - by Crop Type
- 8.1.1. Cereals
- 8.1.2. Fruits
- 8.1.3. Vegetables
- 8.1.4. Oilseeds
- 8.2. Market Analysis, Insights and Forecast - by Crop Type
- 8.2.1. Cereals
- 8.2.2. Fruits
- 8.2.3. Vegetables
- 8.2.4. Oilseeds
- 8.1. Market Analysis, Insights and Forecast - by Crop Type
- 9. Middle East & Africa Agriculture Industry in South Africa Analysis, Insights and Forecast, 2019-2031
- 9.1. Market Analysis, Insights and Forecast - by Crop Type
- 9.1.1. Cereals
- 9.1.2. Fruits
- 9.1.3. Vegetables
- 9.1.4. Oilseeds
- 9.2. Market Analysis, Insights and Forecast - by Crop Type
- 9.2.1. Cereals
- 9.2.2. Fruits
- 9.2.3. Vegetables
- 9.2.4. Oilseeds
- 9.1. Market Analysis, Insights and Forecast - by Crop Type
- 10. Asia Pacific Agriculture Industry in South Africa Analysis, Insights and Forecast, 2019-2031
- 10.1. Market Analysis, Insights and Forecast - by Crop Type
- 10.1.1. Cereals
- 10.1.2. Fruits
- 10.1.3. Vegetables
- 10.1.4. Oilseeds
- 10.2. Market Analysis, Insights and Forecast - by Crop Type
- 10.2.1. Cereals
- 10.2.2. Fruits
- 10.2.3. Vegetables
- 10.2.4. Oilseeds
- 10.1. Market Analysis, Insights and Forecast - by Crop Type
- 11. South Africa Agriculture Industry in South Africa Analysis, Insights and Forecast, 2019-2031
- 12. Sudan Agriculture Industry in South Africa Analysis, Insights and Forecast, 2019-2031
- 13. Uganda Agriculture Industry in South Africa Analysis, Insights and Forecast, 2019-2031
- 14. Tanzania Agriculture Industry in South Africa Analysis, Insights and Forecast, 2019-2031
- 15. Kenya Agriculture Industry in South Africa Analysis, Insights and Forecast, 2019-2031
- 16. Rest of Africa Agriculture Industry in South Africa Analysis, Insights and Forecast, 2019-2031
- 17. Competitive Analysis
- 17.1. Global Market Share Analysis 2024
- 17.2. Company Profiles
- 17.2.1 Pioneer Foods
- 17.2.1.1. Overview
- 17.2.1.2. Products
- 17.2.1.3. SWOT Analysis
- 17.2.1.4. Recent Developments
- 17.2.1.5. Financials (Based on Availability)
- 17.2.2 Bayer Crop Science
- 17.2.2.1. Overview
- 17.2.2.2. Products
- 17.2.2.3. SWOT Analysis
- 17.2.2.4. Recent Developments
- 17.2.2.5. Financials (Based on Availability)
- 17.2.3 Syngenta
- 17.2.3.1. Overview
- 17.2.3.2. Products
- 17.2.3.3. SWOT Analysis
- 17.2.3.4. Recent Developments
- 17.2.3.5. Financials (Based on Availability)
- 17.2.4 Monsanto
- 17.2.4.1. Overview
- 17.2.4.2. Products
- 17.2.4.3. SWOT Analysis
- 17.2.4.4. Recent Developments
- 17.2.4.5. Financials (Based on Availability)
- 17.2.5 Tiger Brands
- 17.2.5.1. Overview
- 17.2.5.2. Products
- 17.2.5.3. SWOT Analysis
- 17.2.5.4. Recent Developments
- 17.2.5.5. Financials (Based on Availability)
- 17.2.1 Pioneer Foods
List of Figures
- Figure 1: Global Agriculture Industry in South Africa Revenue Breakdown (Million, %) by Region 2024 & 2032
- Figure 2: Africa Agriculture Industry in South Africa Revenue (Million), by Country 2024 & 2032
- Figure 3: Africa Agriculture Industry in South Africa Revenue Share (%), by Country 2024 & 2032
- Figure 4: North America Agriculture Industry in South Africa Revenue (Million), by Crop Type 2024 & 2032
- Figure 5: North America Agriculture Industry in South Africa Revenue Share (%), by Crop Type 2024 & 2032
- Figure 6: North America Agriculture Industry in South Africa Revenue (Million), by Crop Type 2024 & 2032
- Figure 7: North America Agriculture Industry in South Africa Revenue Share (%), by Crop Type 2024 & 2032
- Figure 8: North America Agriculture Industry in South Africa Revenue (Million), by Country 2024 & 2032
- Figure 9: North America Agriculture Industry in South Africa Revenue Share (%), by Country 2024 & 2032
- Figure 10: South America Agriculture Industry in South Africa Revenue (Million), by Crop Type 2024 & 2032
- Figure 11: South America Agriculture Industry in South Africa Revenue Share (%), by Crop Type 2024 & 2032
- Figure 12: South America Agriculture Industry in South Africa Revenue (Million), by Crop Type 2024 & 2032
- Figure 13: South America Agriculture Industry in South Africa Revenue Share (%), by Crop Type 2024 & 2032
- Figure 14: South America Agriculture Industry in South Africa Revenue (Million), by Country 2024 & 2032
- Figure 15: South America Agriculture Industry in South Africa Revenue Share (%), by Country 2024 & 2032
- Figure 16: Europe Agriculture Industry in South Africa Revenue (Million), by Crop Type 2024 & 2032
- Figure 17: Europe Agriculture Industry in South Africa Revenue Share (%), by Crop Type 2024 & 2032
- Figure 18: Europe Agriculture Industry in South Africa Revenue (Million), by Crop Type 2024 & 2032
- Figure 19: Europe Agriculture Industry in South Africa Revenue Share (%), by Crop Type 2024 & 2032
- Figure 20: Europe Agriculture Industry in South Africa Revenue (Million), by Country 2024 & 2032
- Figure 21: Europe Agriculture Industry in South Africa Revenue Share (%), by Country 2024 & 2032
- Figure 22: Middle East & Africa Agriculture Industry in South Africa Revenue (Million), by Crop Type 2024 & 2032
- Figure 23: Middle East & Africa Agriculture Industry in South Africa Revenue Share (%), by Crop Type 2024 & 2032
- Figure 24: Middle East & Africa Agriculture Industry in South Africa Revenue (Million), by Crop Type 2024 & 2032
- Figure 25: Middle East & Africa Agriculture Industry in South Africa Revenue Share (%), by Crop Type 2024 & 2032
- Figure 26: Middle East & Africa Agriculture Industry in South Africa Revenue (Million), by Country 2024 & 2032
- Figure 27: Middle East & Africa Agriculture Industry in South Africa Revenue Share (%), by Country 2024 & 2032
- Figure 28: Asia Pacific Agriculture Industry in South Africa Revenue (Million), by Crop Type 2024 & 2032
- Figure 29: Asia Pacific Agriculture Industry in South Africa Revenue Share (%), by Crop Type 2024 & 2032
- Figure 30: Asia Pacific Agriculture Industry in South Africa Revenue (Million), by Crop Type 2024 & 2032
- Figure 31: Asia Pacific Agriculture Industry in South Africa Revenue Share (%), by Crop Type 2024 & 2032
- Figure 32: Asia Pacific Agriculture Industry in South Africa Revenue (Million), by Country 2024 & 2032
- Figure 33: Asia Pacific Agriculture Industry in South Africa Revenue Share (%), by Country 2024 & 2032
List of Tables
- Table 1: Global Agriculture Industry in South Africa Revenue Million Forecast, by Region 2019 & 2032
- Table 2: Global Agriculture Industry in South Africa Revenue Million Forecast, by Crop Type 2019 & 2032
- Table 3: Global Agriculture Industry in South Africa Revenue Million Forecast, by Crop Type 2019 & 2032
- Table 4: Global Agriculture Industry in South Africa Revenue Million Forecast, by Region 2019 & 2032
- Table 5: Global Agriculture Industry in South Africa Revenue Million Forecast, by Country 2019 & 2032
- Table 6: South Africa Agriculture Industry in South Africa Revenue (Million) Forecast, by Application 2019 & 2032
- Table 7: Sudan Agriculture Industry in South Africa Revenue (Million) Forecast, by Application 2019 & 2032
- Table 8: Uganda Agriculture Industry in South Africa Revenue (Million) Forecast, by Application 2019 & 2032
- Table 9: Tanzania Agriculture Industry in South Africa Revenue (Million) Forecast, by Application 2019 & 2032
- Table 10: Kenya Agriculture Industry in South Africa Revenue (Million) Forecast, by Application 2019 & 2032
- Table 11: Rest of Africa Agriculture Industry in South Africa Revenue (Million) Forecast, by Application 2019 & 2032
- Table 12: Global Agriculture Industry in South Africa Revenue Million Forecast, by Crop Type 2019 & 2032
- Table 13: Global Agriculture Industry in South Africa Revenue Million Forecast, by Crop Type 2019 & 2032
- Table 14: Global Agriculture Industry in South Africa Revenue Million Forecast, by Country 2019 & 2032
- Table 15: United States Agriculture Industry in South Africa Revenue (Million) Forecast, by Application 2019 & 2032
- Table 16: Canada Agriculture Industry in South Africa Revenue (Million) Forecast, by Application 2019 & 2032
- Table 17: Mexico Agriculture Industry in South Africa Revenue (Million) Forecast, by Application 2019 & 2032
- Table 18: Global Agriculture Industry in South Africa Revenue Million Forecast, by Crop Type 2019 & 2032
- Table 19: Global Agriculture Industry in South Africa Revenue Million Forecast, by Crop Type 2019 & 2032
- Table 20: Global Agriculture Industry in South Africa Revenue Million Forecast, by Country 2019 & 2032
- Table 21: Brazil Agriculture Industry in South Africa Revenue (Million) Forecast, by Application 2019 & 2032
- Table 22: Argentina Agriculture Industry in South Africa Revenue (Million) Forecast, by Application 2019 & 2032
- Table 23: Rest of South America Agriculture Industry in South Africa Revenue (Million) Forecast, by Application 2019 & 2032
- Table 24: Global Agriculture Industry in South Africa Revenue Million Forecast, by Crop Type 2019 & 2032
- Table 25: Global Agriculture Industry in South Africa Revenue Million Forecast, by Crop Type 2019 & 2032
- Table 26: Global Agriculture Industry in South Africa Revenue Million Forecast, by Country 2019 & 2032
- Table 27: United Kingdom Agriculture Industry in South Africa Revenue (Million) Forecast, by Application 2019 & 2032
- Table 28: Germany Agriculture Industry in South Africa Revenue (Million) Forecast, by Application 2019 & 2032
- Table 29: France Agriculture Industry in South Africa Revenue (Million) Forecast, by Application 2019 & 2032
- Table 30: Italy Agriculture Industry in South Africa Revenue (Million) Forecast, by Application 2019 & 2032
- Table 31: Spain Agriculture Industry in South Africa Revenue (Million) Forecast, by Application 2019 & 2032
- Table 32: Russia Agriculture Industry in South Africa Revenue (Million) Forecast, by Application 2019 & 2032
- Table 33: Benelux Agriculture Industry in South Africa Revenue (Million) Forecast, by Application 2019 & 2032
- Table 34: Nordics Agriculture Industry in South Africa Revenue (Million) Forecast, by Application 2019 & 2032
- Table 35: Rest of Europe Agriculture Industry in South Africa Revenue (Million) Forecast, by Application 2019 & 2032
- Table 36: Global Agriculture Industry in South Africa Revenue Million Forecast, by Crop Type 2019 & 2032
- Table 37: Global Agriculture Industry in South Africa Revenue Million Forecast, by Crop Type 2019 & 2032
- Table 38: Global Agriculture Industry in South Africa Revenue Million Forecast, by Country 2019 & 2032
- Table 39: Turkey Agriculture Industry in South Africa Revenue (Million) Forecast, by Application 2019 & 2032
- Table 40: Israel Agriculture Industry in South Africa Revenue (Million) Forecast, by Application 2019 & 2032
- Table 41: GCC Agriculture Industry in South Africa Revenue (Million) Forecast, by Application 2019 & 2032
- Table 42: North Africa Agriculture Industry in South Africa Revenue (Million) Forecast, by Application 2019 & 2032
- Table 43: South Africa Agriculture Industry in South Africa Revenue (Million) Forecast, by Application 2019 & 2032
- Table 44: Rest of Middle East & Africa Agriculture Industry in South Africa Revenue (Million) Forecast, by Application 2019 & 2032
- Table 45: Global Agriculture Industry in South Africa Revenue Million Forecast, by Crop Type 2019 & 2032
- Table 46: Global Agriculture Industry in South Africa Revenue Million Forecast, by Crop Type 2019 & 2032
- Table 47: Global Agriculture Industry in South Africa Revenue Million Forecast, by Country 2019 & 2032
- Table 48: China Agriculture Industry in South Africa Revenue (Million) Forecast, by Application 2019 & 2032
- Table 49: India Agriculture Industry in South Africa Revenue (Million) Forecast, by Application 2019 & 2032
- Table 50: Japan Agriculture Industry in South Africa Revenue (Million) Forecast, by Application 2019 & 2032
- Table 51: South Korea Agriculture Industry in South Africa Revenue (Million) Forecast, by Application 2019 & 2032
- Table 52: ASEAN Agriculture Industry in South Africa Revenue (Million) Forecast, by Application 2019 & 2032
- Table 53: Oceania Agriculture Industry in South Africa Revenue (Million) Forecast, by Application 2019 & 2032
- Table 54: Rest of Asia Pacific Agriculture Industry in South Africa Revenue (Million) Forecast, by Application 2019 & 2032
Frequently Asked Questions
1. What is the projected Compound Annual Growth Rate (CAGR) of the Agriculture Industry in South Africa?
The projected CAGR is approximately 7.60%.
2. Which companies are prominent players in the Agriculture Industry in South Africa?
Key companies in the market include Pioneer Foods , Bayer Crop Science , Syngenta , Monsanto , Tiger Brands.
3. What are the main segments of the Agriculture Industry in South Africa?
The market segments include Crop Type, Crop Type.
4. Can you provide details about the market size?
The market size is estimated to be USD 16.12 Million as of 2022.
5. What are some drivers contributing to market growth?
Rising Consumption of Cashew Nuts as a Healthy Snack; Increasing Government initiatives; Growing Cashew Nut Imports in The United States.
6. What are the notable trends driving market growth?
High Demand for Food Crops with the rising population.
7. Are there any restraints impacting market growth?
Hazardous Climatic Condition Hinders Cashew Production; Stringent Regulations Related To Food Quality Standards.
8. Can you provide examples of recent developments in the market?
N/A
9. What pricing options are available for accessing the report?
Pricing options include single-user, multi-user, and enterprise licenses priced at USD 3800, USD 4500, and USD 5800 respectively.
10. Is the market size provided in terms of value or volume?
The market size is provided in terms of value, measured in Million.
11. Are there any specific market keywords associated with the report?
Yes, the market keyword associated with the report is "Agriculture Industry in South Africa," which aids in identifying and referencing the specific market segment covered.
12. How do I determine which pricing option suits my needs best?
The pricing options vary based on user requirements and access needs. Individual users may opt for single-user licenses, while businesses requiring broader access may choose multi-user or enterprise licenses for cost-effective access to the report.
13. Are there any additional resources or data provided in the Agriculture Industry in South Africa report?
While the report offers comprehensive insights, it's advisable to review the specific contents or supplementary materials provided to ascertain if additional resources or data are available.
14. How can I stay updated on further developments or reports in the Agriculture Industry in South Africa?
To stay informed about further developments, trends, and reports in the Agriculture Industry in South Africa, consider subscribing to industry newsletters, following relevant companies and organizations, or regularly checking reputable industry news sources and publications.
Methodology
Step 1 - Identification of Relevant Samples Size from Population Database


Step 2 - Approaches for Defining Global Market Size (Value, Volume* & Price*)

Note*: In applicable scenarios
Step 3 - Data Sources
Primary Research
- Web Analytics
- Survey Reports
- Research Institute
- Latest Research Reports
- Opinion Leaders
Secondary Research
- Annual Reports
- White Paper
- Latest Press Release
- Industry Association
- Paid Database
- Investor Presentations

Step 4 - Data Triangulation
Involves using different sources of information in order to increase the validity of a study
These sources are likely to be stakeholders in a program - participants, other researchers, program staff, other community members, and so on.
Then we put all data in single framework & apply various statistical tools to find out the dynamic on the market.
During the analysis stage, feedback from the stakeholder groups would be compared to determine areas of agreement as well as areas of divergence


