
Key Insights
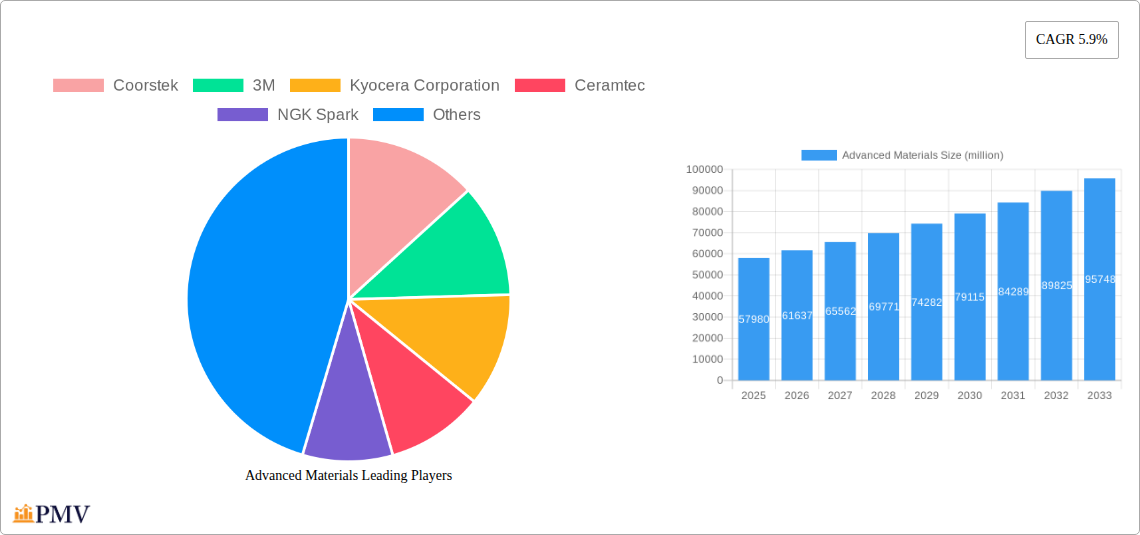
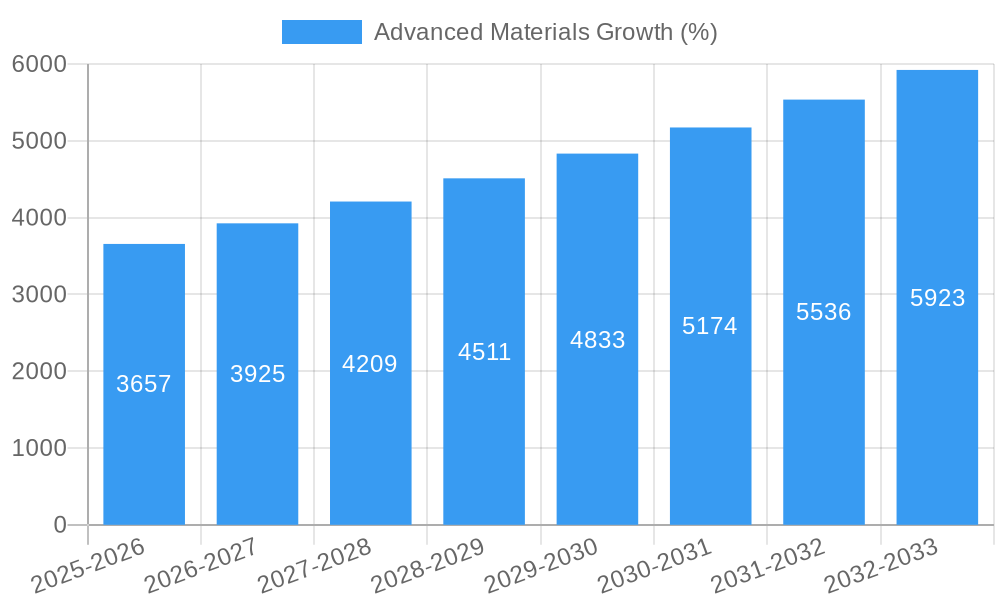
The advanced materials market, valued at $57,980 million in 2025, is projected to experience robust growth, driven by increasing demand across diverse sectors like aerospace, automotive, and electronics. A compound annual growth rate (CAGR) of 5.9% from 2025 to 2033 signifies a substantial expansion of this market. Key drivers include the rising need for lightweight yet high-strength materials in vehicles to improve fuel efficiency and reduce emissions, the burgeoning adoption of advanced ceramics in electronics for improved performance and durability, and the ongoing quest for innovative materials in aerospace applications to enhance aircraft performance and lifespan. Emerging trends, such as the development of bio-based advanced materials and the increasing focus on sustainable manufacturing practices, are further shaping the market landscape. While challenges such as high production costs and the complexity of material processing exist, the long-term outlook remains positive, fueled by continuous technological advancements and ongoing research and development efforts. The competitive landscape is marked by a diverse range of established players, including Coorstek, 3M, Kyocera Corporation, and others, engaged in continuous innovation to cater to specific industry needs. The market is segmented based on material type (e.g., ceramics, composites, polymers), application (e.g., aerospace, automotive, electronics), and geography, offering diverse investment opportunities.
The forecast period of 2025-2033 will see significant growth in several market segments. The automotive sector’s push for lightweighting and improved performance will drive demand for advanced composites and high-strength ceramics. Similarly, the electronics industry's need for miniaturization and higher performance will fuel demand for advanced materials with improved electrical and thermal properties. Regional variations in market growth are expected, with regions experiencing rapid industrialization and technological advancements likely to demonstrate faster adoption rates of advanced materials. However, regulatory changes regarding material safety and environmental impact will influence market growth trajectories in specific regions. The industry will continue to focus on material innovations, improved production techniques, and cost optimization strategies to ensure its sustained growth and competitiveness.
Advanced Materials Market Report: 2019-2033
This comprehensive report provides a detailed analysis of the global advanced materials market, offering invaluable insights for industry stakeholders, investors, and researchers. With a study period spanning 2019-2033, a base year of 2025, and a forecast period of 2025-2033, this report leverages rigorous research methodologies to present a precise and actionable outlook. The market size is projected to reach xx million by 2033, exhibiting a robust CAGR of xx% during the forecast period. This report delves deep into market segmentation, competitive landscape, technological advancements, and key growth drivers, offering a 360° view of this dynamic sector.
Advanced Materials Market Structure & Competitive Dynamics
The advanced materials market is characterized by a moderately concentrated structure with several major players holding significant market share. The top five companies—Coorstek, 3M, Kyocera Corporation, Ceramtec, and NGK Spark Plugs—collectively account for an estimated xx% of the global market in 2025. Market concentration is influenced by factors such as extensive R&D investments, strong intellectual property portfolios, and established global distribution networks.
The market witnesses consistent innovation, driven by collaborations between material scientists, manufacturers, and end-users. This fosters the development of advanced materials with enhanced properties like strength, durability, and lightweight characteristics. Stringent regulatory frameworks, particularly concerning environmental sustainability and material safety, significantly impact market dynamics. The market also exhibits some degree of substitutability, with certain advanced materials competing with traditional materials based on cost-effectiveness and performance trade-offs.
End-user trends, especially in the aerospace, automotive, and electronics industries, significantly influence the demand for specific advanced materials. M&A activities play a pivotal role in shaping the competitive landscape. Over the historical period (2019-2024), the total value of M&A deals in the advanced materials sector exceeded xx million, indicating substantial consolidation and strategic expansion efforts by major players.
- Market Concentration: Top 5 players hold xx% market share (2025).
- M&A Activity: Total deal value exceeded xx million (2019-2024).
- Innovation: Driven by collaborations and R&D investments.
- Regulatory Framework: Stringent environmental and safety regulations.
Advanced Materials Industry Trends & Insights
The global advanced materials market exhibits robust growth, propelled by several key factors. Technological advancements in material science continuously unlock new possibilities, leading to the development of materials with superior performance characteristics. The rising demand for lightweight, high-strength materials in sectors such as aerospace and automotive is a major market driver. Consumer preferences are shifting towards sustainable and eco-friendly products, driving the adoption of bio-based and recycled advanced materials.
Furthermore, increasing investments in infrastructure development globally, coupled with the growing need for advanced materials in electronics and renewable energy applications, significantly contribute to market growth. The competitive landscape is marked by continuous innovation, strategic partnerships, and intense competition, particularly amongst the leading players. The market demonstrates a notable preference for advanced materials offering enhanced functionality, durability, and cost-effectiveness. This necessitates ongoing investment in R&D and technology adoption across the value chain. The market is expected to witness xx million in revenue by 2033, with a projected CAGR of xx% during 2025-2033. Market penetration of advanced materials in key end-use sectors is also expected to significantly increase over this period.
Dominant Markets & Segments in Advanced Materials
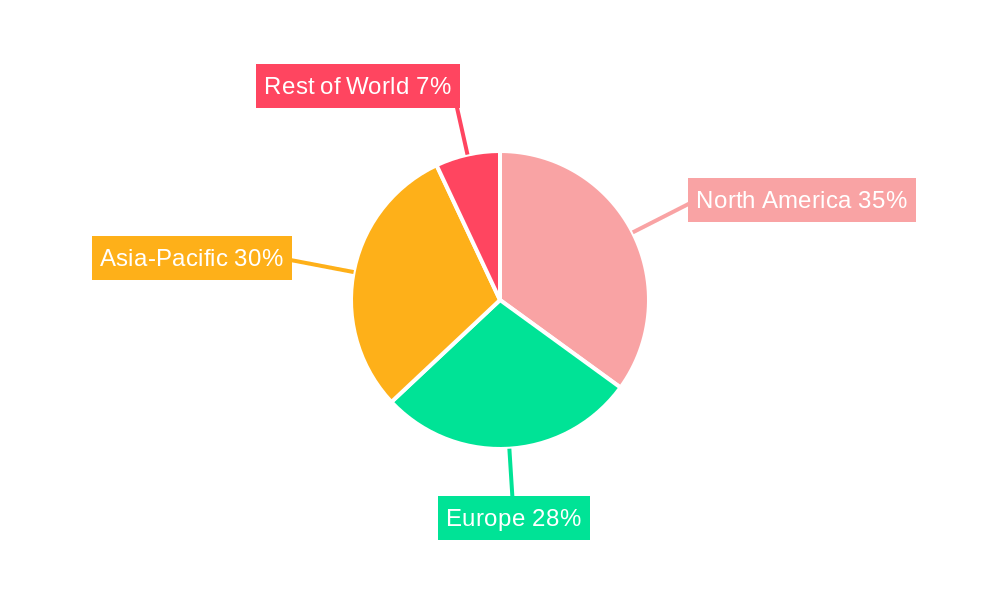
The Asia-Pacific region currently holds a dominant position in the global advanced materials market, driven by rapid industrialization, substantial infrastructure development, and the burgeoning electronics sector. China, in particular, plays a crucial role, fueled by robust economic growth and substantial government investment in advanced materials research and development.
- Key Drivers in Asia-Pacific:
- Rapid industrialization
- Extensive infrastructure development
- Growing electronics sector
- Supportive government policies
- Increasing investment in R&D
The dominance of the Asia-Pacific region is further strengthened by the presence of several leading advanced materials manufacturers in the region. These companies benefit from access to low-cost labor, abundant raw materials, and a large consumer base. While North America and Europe also hold significant market shares, the Asia-Pacific region is projected to maintain its leadership position throughout the forecast period, driven by continuous economic expansion and technological advancements.
Advanced Materials Product Innovations
Recent advancements in advanced materials encompass the development of high-performance polymers, carbon fiber composites, and bio-based materials. These innovations offer significant improvements in strength-to-weight ratio, durability, and sustainability, expanding applications in diverse sectors like aerospace, automotive, and medical devices. These materials often demonstrate enhanced functionalities, such as electrical conductivity, heat resistance, and biocompatibility. Their competitive advantage stems from superior performance, reduced weight, and increased energy efficiency compared to traditional materials. This is driving their adoption across various industries.
Report Segmentation & Scope
This report provides a detailed segmentation of the advanced materials market based on material type (e.g., ceramics, polymers, composites), application (e.g., aerospace, automotive, electronics), and region (e.g., North America, Europe, Asia-Pacific). Each segment is analyzed in depth, covering market size, growth projections, and competitive dynamics. Growth projections vary across segments, reflecting the diverse growth drivers and market opportunities within each area. Competitive dynamics also vary based on the specific segment, with certain segments exhibiting greater concentration than others. Detailed analysis of each segment provides granular insights into the market structure, competition, and future trends.
Key Drivers of Advanced Materials Growth
Several key factors fuel the growth of the advanced materials market. Technological advancements constantly improve material properties, leading to increased performance and efficiency. Strong economic growth in developing economies, particularly in Asia, significantly increases demand for infrastructure and industrial applications. Government policies promoting sustainability and innovation further stimulate the market, encouraging the development and adoption of eco-friendly advanced materials. The aerospace and automotive industries, driven by demand for lightweight and high-strength components, are significant contributors to market growth.
Challenges in the Advanced Materials Sector
The advanced materials sector faces challenges, including regulatory hurdles related to material safety and environmental impact. Supply chain disruptions, particularly concerning rare earth elements and specialized raw materials, can severely impact production and pricing. Intense competition from established players and new entrants constantly pushes for innovation and cost optimization. The high cost of R&D and the long lead times for new material development represent significant barriers to market entry for smaller players. These challenges require strategic management and proactive adaptation by companies operating in this sector. The total estimated impact of these challenges on market growth is approximately xx million annually.
Leading Players in the Advanced Materials Market
- Coorstek
- 3M
- Kyocera Corporation
- Ceramtec
- NGK Spark Plugs
- Morgan Advanced Materials
- ERIKS
- TOTO
- Rauschert Steinbach
- H.C. Starck
- Sinoma
- Schunk
- Mcdanel Advanced Ceramic
- Surpo
- Bakony Technical Ceramics Ltd
- HUAMEI Ceramics
- Doceram
- YIFEI Technology
Key Developments in Advanced Materials Sector
- 2023 Q3: 3M launches a new generation of high-strength polymer composite, expanding its presence in the automotive market.
- 2022 Q4: Kyocera Corporation announces a strategic partnership with a leading automotive manufacturer to develop advanced ceramic components for electric vehicles.
- 2021 Q1: Coorstek acquires a smaller competitor, strengthening its position in the high-temperature ceramic materials market.
- 2020 Q2: Significant investments in R&D across the sector focused on sustainable and bio-based advanced materials are announced.
Strategic Advanced Materials Market Outlook
The advanced materials market is poised for significant growth in the coming years, driven by technological advancements, increasing demand from key industries, and supportive government policies. Strategic opportunities exist in developing sustainable materials, exploring new applications in renewable energy, and optimizing manufacturing processes to improve cost-effectiveness. Companies with robust R&D capabilities and a focus on innovation are well-positioned to capture significant market share. The potential for growth is immense, particularly in emerging economies and in sectors where advanced materials offer significant performance advantages over traditional alternatives.
Advanced Materials Segmentation
-
1. Application
- 1.1. Aerospace
- 1.2. Electricals
- 1.3. Industrial
- 1.4. Transportation
- 1.5. Other
-
2. Types
- 2.1. Ceramic
- 2.2. Glass
- 2.3. Polymer
- 2.4. Metal
- 2.5. Other
Advanced Materials Segmentation By Geography
-
1. North America
- 1.1. United States
- 1.2. Canada
- 1.3. Mexico
-
2. South America
- 2.1. Brazil
- 2.2. Argentina
- 2.3. Rest of South America
-
3. Europe
- 3.1. United Kingdom
- 3.2. Germany
- 3.3. France
- 3.4. Italy
- 3.5. Spain
- 3.6. Russia
- 3.7. Benelux
- 3.8. Nordics
- 3.9. Rest of Europe
-
4. Middle East & Africa
- 4.1. Turkey
- 4.2. Israel
- 4.3. GCC
- 4.4. North Africa
- 4.5. South Africa
- 4.6. Rest of Middle East & Africa
-
5. Asia Pacific
- 5.1. China
- 5.2. India
- 5.3. Japan
- 5.4. South Korea
- 5.5. ASEAN
- 5.6. Oceania
- 5.7. Rest of Asia Pacific
Advanced Materials REPORT HIGHLIGHTS
| Aspects | Details |
|---|---|
| Study Period | 2019-2033 |
| Base Year | 2024 |
| Estimated Year | 2025 |
| Forecast Period | 2025-2033 |
| Historical Period | 2019-2024 |
| Growth Rate | CAGR of 5.9% from 2019-2033 |
| Segmentation |
|
Table of Contents
- 1. Introduction
- 1.1. Research Scope
- 1.2. Market Segmentation
- 1.3. Research Methodology
- 1.4. Definitions and Assumptions
- 2. Executive Summary
- 2.1. Introduction
- 3. Market Dynamics
- 3.1. Introduction
- 3.2. Market Drivers
- 3.3. Market Restrains
- 3.4. Market Trends
- 4. Market Factor Analysis
- 4.1. Porters Five Forces
- 4.2. Supply/Value Chain
- 4.3. PESTEL analysis
- 4.4. Market Entropy
- 4.5. Patent/Trademark Analysis
- 5. Global Advanced Materials Analysis, Insights and Forecast, 2019-2031
- 5.1. Market Analysis, Insights and Forecast - by Application
- 5.1.1. Aerospace
- 5.1.2. Electricals
- 5.1.3. Industrial
- 5.1.4. Transportation
- 5.1.5. Other
- 5.2. Market Analysis, Insights and Forecast - by Types
- 5.2.1. Ceramic
- 5.2.2. Glass
- 5.2.3. Polymer
- 5.2.4. Metal
- 5.2.5. Other
- 5.3. Market Analysis, Insights and Forecast - by Region
- 5.3.1. North America
- 5.3.2. South America
- 5.3.3. Europe
- 5.3.4. Middle East & Africa
- 5.3.5. Asia Pacific
- 5.1. Market Analysis, Insights and Forecast - by Application
- 6. North America Advanced Materials Analysis, Insights and Forecast, 2019-2031
- 6.1. Market Analysis, Insights and Forecast - by Application
- 6.1.1. Aerospace
- 6.1.2. Electricals
- 6.1.3. Industrial
- 6.1.4. Transportation
- 6.1.5. Other
- 6.2. Market Analysis, Insights and Forecast - by Types
- 6.2.1. Ceramic
- 6.2.2. Glass
- 6.2.3. Polymer
- 6.2.4. Metal
- 6.2.5. Other
- 6.1. Market Analysis, Insights and Forecast - by Application
- 7. South America Advanced Materials Analysis, Insights and Forecast, 2019-2031
- 7.1. Market Analysis, Insights and Forecast - by Application
- 7.1.1. Aerospace
- 7.1.2. Electricals
- 7.1.3. Industrial
- 7.1.4. Transportation
- 7.1.5. Other
- 7.2. Market Analysis, Insights and Forecast - by Types
- 7.2.1. Ceramic
- 7.2.2. Glass
- 7.2.3. Polymer
- 7.2.4. Metal
- 7.2.5. Other
- 7.1. Market Analysis, Insights and Forecast - by Application
- 8. Europe Advanced Materials Analysis, Insights and Forecast, 2019-2031
- 8.1. Market Analysis, Insights and Forecast - by Application
- 8.1.1. Aerospace
- 8.1.2. Electricals
- 8.1.3. Industrial
- 8.1.4. Transportation
- 8.1.5. Other
- 8.2. Market Analysis, Insights and Forecast - by Types
- 8.2.1. Ceramic
- 8.2.2. Glass
- 8.2.3. Polymer
- 8.2.4. Metal
- 8.2.5. Other
- 8.1. Market Analysis, Insights and Forecast - by Application
- 9. Middle East & Africa Advanced Materials Analysis, Insights and Forecast, 2019-2031
- 9.1. Market Analysis, Insights and Forecast - by Application
- 9.1.1. Aerospace
- 9.1.2. Electricals
- 9.1.3. Industrial
- 9.1.4. Transportation
- 9.1.5. Other
- 9.2. Market Analysis, Insights and Forecast - by Types
- 9.2.1. Ceramic
- 9.2.2. Glass
- 9.2.3. Polymer
- 9.2.4. Metal
- 9.2.5. Other
- 9.1. Market Analysis, Insights and Forecast - by Application
- 10. Asia Pacific Advanced Materials Analysis, Insights and Forecast, 2019-2031
- 10.1. Market Analysis, Insights and Forecast - by Application
- 10.1.1. Aerospace
- 10.1.2. Electricals
- 10.1.3. Industrial
- 10.1.4. Transportation
- 10.1.5. Other
- 10.2. Market Analysis, Insights and Forecast - by Types
- 10.2.1. Ceramic
- 10.2.2. Glass
- 10.2.3. Polymer
- 10.2.4. Metal
- 10.2.5. Other
- 10.1. Market Analysis, Insights and Forecast - by Application
- 11. Competitive Analysis
- 11.1. Global Market Share Analysis 2024
- 11.2. Company Profiles
- 11.2.1 Coorstek
- 11.2.1.1. Overview
- 11.2.1.2. Products
- 11.2.1.3. SWOT Analysis
- 11.2.1.4. Recent Developments
- 11.2.1.5. Financials (Based on Availability)
- 11.2.2 3M
- 11.2.2.1. Overview
- 11.2.2.2. Products
- 11.2.2.3. SWOT Analysis
- 11.2.2.4. Recent Developments
- 11.2.2.5. Financials (Based on Availability)
- 11.2.3 Kyocera Corporation
- 11.2.3.1. Overview
- 11.2.3.2. Products
- 11.2.3.3. SWOT Analysis
- 11.2.3.4. Recent Developments
- 11.2.3.5. Financials (Based on Availability)
- 11.2.4 Ceramtec
- 11.2.4.1. Overview
- 11.2.4.2. Products
- 11.2.4.3. SWOT Analysis
- 11.2.4.4. Recent Developments
- 11.2.4.5. Financials (Based on Availability)
- 11.2.5 NGK Spark
- 11.2.5.1. Overview
- 11.2.5.2. Products
- 11.2.5.3. SWOT Analysis
- 11.2.5.4. Recent Developments
- 11.2.5.5. Financials (Based on Availability)
- 11.2.6 Morgan Advanced Materials
- 11.2.6.1. Overview
- 11.2.6.2. Products
- 11.2.6.3. SWOT Analysis
- 11.2.6.4. Recent Developments
- 11.2.6.5. Financials (Based on Availability)
- 11.2.7 ERIKS
- 11.2.7.1. Overview
- 11.2.7.2. Products
- 11.2.7.3. SWOT Analysis
- 11.2.7.4. Recent Developments
- 11.2.7.5. Financials (Based on Availability)
- 11.2.8 TOTO
- 11.2.8.1. Overview
- 11.2.8.2. Products
- 11.2.8.3. SWOT Analysis
- 11.2.8.4. Recent Developments
- 11.2.8.5. Financials (Based on Availability)
- 11.2.9 Rauschert Steinbach
- 11.2.9.1. Overview
- 11.2.9.2. Products
- 11.2.9.3. SWOT Analysis
- 11.2.9.4. Recent Developments
- 11.2.9.5. Financials (Based on Availability)
- 11.2.10 H.C. Starck
- 11.2.10.1. Overview
- 11.2.10.2. Products
- 11.2.10.3. SWOT Analysis
- 11.2.10.4. Recent Developments
- 11.2.10.5. Financials (Based on Availability)
- 11.2.11 Sinoma
- 11.2.11.1. Overview
- 11.2.11.2. Products
- 11.2.11.3. SWOT Analysis
- 11.2.11.4. Recent Developments
- 11.2.11.5. Financials (Based on Availability)
- 11.2.12 Schunk
- 11.2.12.1. Overview
- 11.2.12.2. Products
- 11.2.12.3. SWOT Analysis
- 11.2.12.4. Recent Developments
- 11.2.12.5. Financials (Based on Availability)
- 11.2.13 Mcdanel Advanced Ceramic
- 11.2.13.1. Overview
- 11.2.13.2. Products
- 11.2.13.3. SWOT Analysis
- 11.2.13.4. Recent Developments
- 11.2.13.5. Financials (Based on Availability)
- 11.2.14 Surpo
- 11.2.14.1. Overview
- 11.2.14.2. Products
- 11.2.14.3. SWOT Analysis
- 11.2.14.4. Recent Developments
- 11.2.14.5. Financials (Based on Availability)
- 11.2.15 Bakony Technical Ceramics Ltd
- 11.2.15.1. Overview
- 11.2.15.2. Products
- 11.2.15.3. SWOT Analysis
- 11.2.15.4. Recent Developments
- 11.2.15.5. Financials (Based on Availability)
- 11.2.16 HUAMEI Ceramics
- 11.2.16.1. Overview
- 11.2.16.2. Products
- 11.2.16.3. SWOT Analysis
- 11.2.16.4. Recent Developments
- 11.2.16.5. Financials (Based on Availability)
- 11.2.17 Doceram
- 11.2.17.1. Overview
- 11.2.17.2. Products
- 11.2.17.3. SWOT Analysis
- 11.2.17.4. Recent Developments
- 11.2.17.5. Financials (Based on Availability)
- 11.2.18 YIFEI Technology
- 11.2.18.1. Overview
- 11.2.18.2. Products
- 11.2.18.3. SWOT Analysis
- 11.2.18.4. Recent Developments
- 11.2.18.5. Financials (Based on Availability)
- 11.2.1 Coorstek
List of Figures
- Figure 1: Global Advanced Materials Revenue Breakdown (million, %) by Region 2024 & 2032
- Figure 2: North America Advanced Materials Revenue (million), by Application 2024 & 2032
- Figure 3: North America Advanced Materials Revenue Share (%), by Application 2024 & 2032
- Figure 4: North America Advanced Materials Revenue (million), by Types 2024 & 2032
- Figure 5: North America Advanced Materials Revenue Share (%), by Types 2024 & 2032
- Figure 6: North America Advanced Materials Revenue (million), by Country 2024 & 2032
- Figure 7: North America Advanced Materials Revenue Share (%), by Country 2024 & 2032
- Figure 8: South America Advanced Materials Revenue (million), by Application 2024 & 2032
- Figure 9: South America Advanced Materials Revenue Share (%), by Application 2024 & 2032
- Figure 10: South America Advanced Materials Revenue (million), by Types 2024 & 2032
- Figure 11: South America Advanced Materials Revenue Share (%), by Types 2024 & 2032
- Figure 12: South America Advanced Materials Revenue (million), by Country 2024 & 2032
- Figure 13: South America Advanced Materials Revenue Share (%), by Country 2024 & 2032
- Figure 14: Europe Advanced Materials Revenue (million), by Application 2024 & 2032
- Figure 15: Europe Advanced Materials Revenue Share (%), by Application 2024 & 2032
- Figure 16: Europe Advanced Materials Revenue (million), by Types 2024 & 2032
- Figure 17: Europe Advanced Materials Revenue Share (%), by Types 2024 & 2032
- Figure 18: Europe Advanced Materials Revenue (million), by Country 2024 & 2032
- Figure 19: Europe Advanced Materials Revenue Share (%), by Country 2024 & 2032
- Figure 20: Middle East & Africa Advanced Materials Revenue (million), by Application 2024 & 2032
- Figure 21: Middle East & Africa Advanced Materials Revenue Share (%), by Application 2024 & 2032
- Figure 22: Middle East & Africa Advanced Materials Revenue (million), by Types 2024 & 2032
- Figure 23: Middle East & Africa Advanced Materials Revenue Share (%), by Types 2024 & 2032
- Figure 24: Middle East & Africa Advanced Materials Revenue (million), by Country 2024 & 2032
- Figure 25: Middle East & Africa Advanced Materials Revenue Share (%), by Country 2024 & 2032
- Figure 26: Asia Pacific Advanced Materials Revenue (million), by Application 2024 & 2032
- Figure 27: Asia Pacific Advanced Materials Revenue Share (%), by Application 2024 & 2032
- Figure 28: Asia Pacific Advanced Materials Revenue (million), by Types 2024 & 2032
- Figure 29: Asia Pacific Advanced Materials Revenue Share (%), by Types 2024 & 2032
- Figure 30: Asia Pacific Advanced Materials Revenue (million), by Country 2024 & 2032
- Figure 31: Asia Pacific Advanced Materials Revenue Share (%), by Country 2024 & 2032
List of Tables
- Table 1: Global Advanced Materials Revenue million Forecast, by Region 2019 & 2032
- Table 2: Global Advanced Materials Revenue million Forecast, by Application 2019 & 2032
- Table 3: Global Advanced Materials Revenue million Forecast, by Types 2019 & 2032
- Table 4: Global Advanced Materials Revenue million Forecast, by Region 2019 & 2032
- Table 5: Global Advanced Materials Revenue million Forecast, by Application 2019 & 2032
- Table 6: Global Advanced Materials Revenue million Forecast, by Types 2019 & 2032
- Table 7: Global Advanced Materials Revenue million Forecast, by Country 2019 & 2032
- Table 8: United States Advanced Materials Revenue (million) Forecast, by Application 2019 & 2032
- Table 9: Canada Advanced Materials Revenue (million) Forecast, by Application 2019 & 2032
- Table 10: Mexico Advanced Materials Revenue (million) Forecast, by Application 2019 & 2032
- Table 11: Global Advanced Materials Revenue million Forecast, by Application 2019 & 2032
- Table 12: Global Advanced Materials Revenue million Forecast, by Types 2019 & 2032
- Table 13: Global Advanced Materials Revenue million Forecast, by Country 2019 & 2032
- Table 14: Brazil Advanced Materials Revenue (million) Forecast, by Application 2019 & 2032
- Table 15: Argentina Advanced Materials Revenue (million) Forecast, by Application 2019 & 2032
- Table 16: Rest of South America Advanced Materials Revenue (million) Forecast, by Application 2019 & 2032
- Table 17: Global Advanced Materials Revenue million Forecast, by Application 2019 & 2032
- Table 18: Global Advanced Materials Revenue million Forecast, by Types 2019 & 2032
- Table 19: Global Advanced Materials Revenue million Forecast, by Country 2019 & 2032
- Table 20: United Kingdom Advanced Materials Revenue (million) Forecast, by Application 2019 & 2032
- Table 21: Germany Advanced Materials Revenue (million) Forecast, by Application 2019 & 2032
- Table 22: France Advanced Materials Revenue (million) Forecast, by Application 2019 & 2032
- Table 23: Italy Advanced Materials Revenue (million) Forecast, by Application 2019 & 2032
- Table 24: Spain Advanced Materials Revenue (million) Forecast, by Application 2019 & 2032
- Table 25: Russia Advanced Materials Revenue (million) Forecast, by Application 2019 & 2032
- Table 26: Benelux Advanced Materials Revenue (million) Forecast, by Application 2019 & 2032
- Table 27: Nordics Advanced Materials Revenue (million) Forecast, by Application 2019 & 2032
- Table 28: Rest of Europe Advanced Materials Revenue (million) Forecast, by Application 2019 & 2032
- Table 29: Global Advanced Materials Revenue million Forecast, by Application 2019 & 2032
- Table 30: Global Advanced Materials Revenue million Forecast, by Types 2019 & 2032
- Table 31: Global Advanced Materials Revenue million Forecast, by Country 2019 & 2032
- Table 32: Turkey Advanced Materials Revenue (million) Forecast, by Application 2019 & 2032
- Table 33: Israel Advanced Materials Revenue (million) Forecast, by Application 2019 & 2032
- Table 34: GCC Advanced Materials Revenue (million) Forecast, by Application 2019 & 2032
- Table 35: North Africa Advanced Materials Revenue (million) Forecast, by Application 2019 & 2032
- Table 36: South Africa Advanced Materials Revenue (million) Forecast, by Application 2019 & 2032
- Table 37: Rest of Middle East & Africa Advanced Materials Revenue (million) Forecast, by Application 2019 & 2032
- Table 38: Global Advanced Materials Revenue million Forecast, by Application 2019 & 2032
- Table 39: Global Advanced Materials Revenue million Forecast, by Types 2019 & 2032
- Table 40: Global Advanced Materials Revenue million Forecast, by Country 2019 & 2032
- Table 41: China Advanced Materials Revenue (million) Forecast, by Application 2019 & 2032
- Table 42: India Advanced Materials Revenue (million) Forecast, by Application 2019 & 2032
- Table 43: Japan Advanced Materials Revenue (million) Forecast, by Application 2019 & 2032
- Table 44: South Korea Advanced Materials Revenue (million) Forecast, by Application 2019 & 2032
- Table 45: ASEAN Advanced Materials Revenue (million) Forecast, by Application 2019 & 2032
- Table 46: Oceania Advanced Materials Revenue (million) Forecast, by Application 2019 & 2032
- Table 47: Rest of Asia Pacific Advanced Materials Revenue (million) Forecast, by Application 2019 & 2032
Frequently Asked Questions
1. What is the projected Compound Annual Growth Rate (CAGR) of the Advanced Materials?
The projected CAGR is approximately 5.9%.
2. Which companies are prominent players in the Advanced Materials?
Key companies in the market include Coorstek, 3M, Kyocera Corporation, Ceramtec, NGK Spark, Morgan Advanced Materials, ERIKS, TOTO, Rauschert Steinbach, H.C. Starck, Sinoma, Schunk, Mcdanel Advanced Ceramic, Surpo, Bakony Technical Ceramics Ltd, HUAMEI Ceramics, Doceram, YIFEI Technology.
3. What are the main segments of the Advanced Materials?
The market segments include Application, Types.
4. Can you provide details about the market size?
The market size is estimated to be USD 57980 million as of 2022.
5. What are some drivers contributing to market growth?
N/A
6. What are the notable trends driving market growth?
N/A
7. Are there any restraints impacting market growth?
N/A
8. Can you provide examples of recent developments in the market?
N/A
9. What pricing options are available for accessing the report?
Pricing options include single-user, multi-user, and enterprise licenses priced at USD 4900.00, USD 7350.00, and USD 9800.00 respectively.
10. Is the market size provided in terms of value or volume?
The market size is provided in terms of value, measured in million.
11. Are there any specific market keywords associated with the report?
Yes, the market keyword associated with the report is "Advanced Materials," which aids in identifying and referencing the specific market segment covered.
12. How do I determine which pricing option suits my needs best?
The pricing options vary based on user requirements and access needs. Individual users may opt for single-user licenses, while businesses requiring broader access may choose multi-user or enterprise licenses for cost-effective access to the report.
13. Are there any additional resources or data provided in the Advanced Materials report?
While the report offers comprehensive insights, it's advisable to review the specific contents or supplementary materials provided to ascertain if additional resources or data are available.
14. How can I stay updated on further developments or reports in the Advanced Materials?
To stay informed about further developments, trends, and reports in the Advanced Materials, consider subscribing to industry newsletters, following relevant companies and organizations, or regularly checking reputable industry news sources and publications.
Methodology
Step 1 - Identification of Relevant Samples Size from Population Database


Step 2 - Approaches for Defining Global Market Size (Value, Volume* & Price*)

Note*: In applicable scenarios
Step 3 - Data Sources
Primary Research
- Web Analytics
- Survey Reports
- Research Institute
- Latest Research Reports
- Opinion Leaders
Secondary Research
- Annual Reports
- White Paper
- Latest Press Release
- Industry Association
- Paid Database
- Investor Presentations

Step 4 - Data Triangulation
Involves using different sources of information in order to increase the validity of a study
These sources are likely to be stakeholders in a program - participants, other researchers, program staff, other community members, and so on.
Then we put all data in single framework & apply various statistical tools to find out the dynamic on the market.
During the analysis stage, feedback from the stakeholder groups would be compared to determine areas of agreement as well as areas of divergence


