
Key Insights
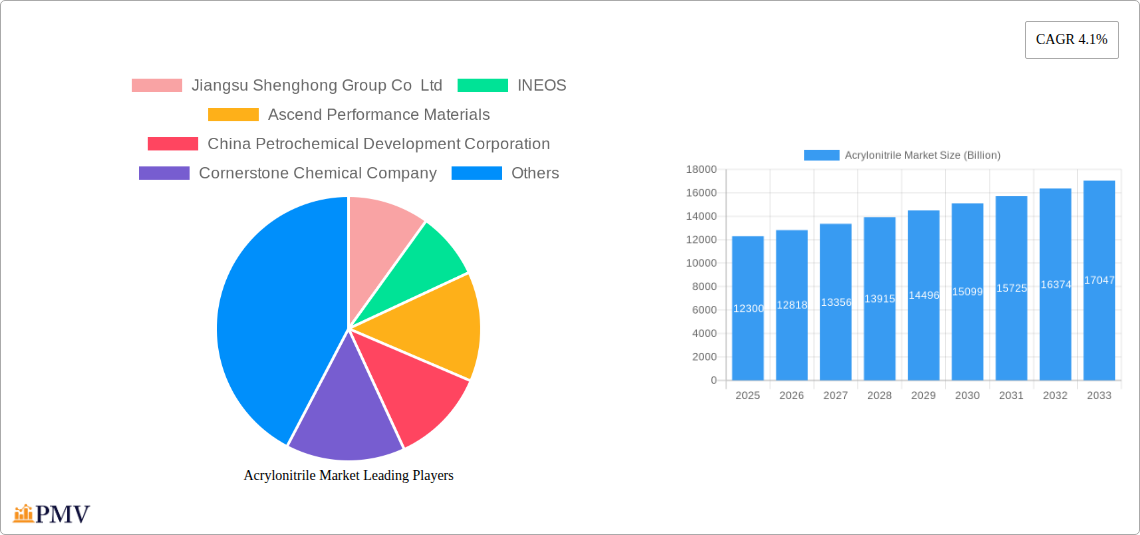
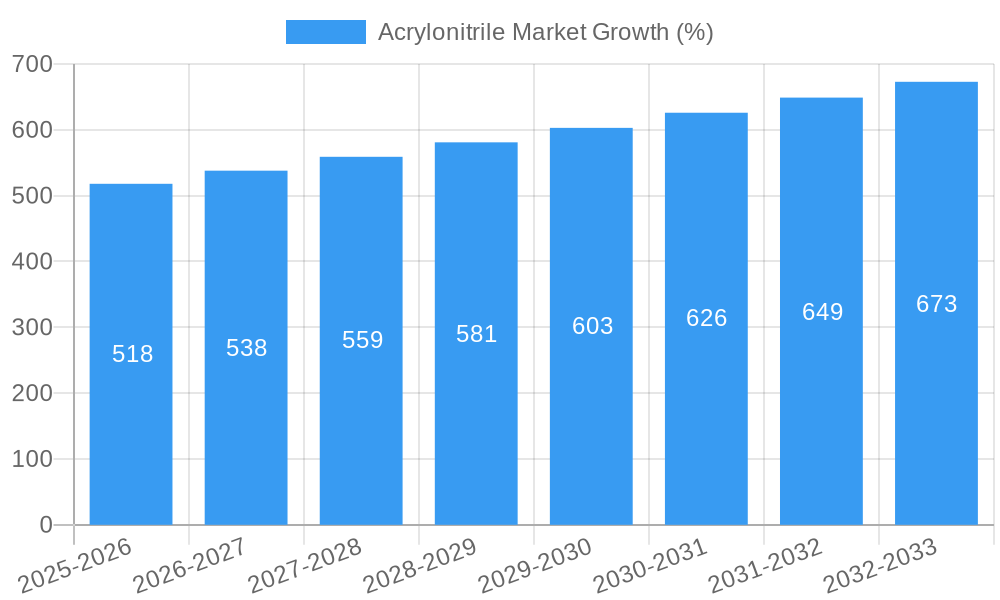
The global acrylonitrile market, valued at $12.3 billion in 2025, is projected to experience robust growth, driven by a compound annual growth rate (CAGR) of 4.1% from 2025 to 2033. This expansion is fueled by several key factors. The increasing demand for acrylonitrile-derived products in diverse end-use industries, particularly building and construction (residential, commercial, and industrial projects), automotive manufacturing (passenger and commercial vehicles), and packaging (both rigid and flexible), significantly contributes to market growth. Furthermore, the expanding electrical and electronics sector, along with the growth of the medical and pharmaceutical industries, are creating new avenues for acrylonitrile utilization. The shift towards sustainable building materials and the burgeoning automotive industry in developing economies are further propelling market expansion. However, fluctuating raw material prices and stringent environmental regulations present challenges to market growth. The market is segmented by process technology (ammoxidation and other processes), application (acrylic fiber, ABS/SAN resins, acrylamide, NBR, and others), and end-use industry, providing insights into specific growth drivers within each segment. Major players like Jiangsu Shenghong Group, INEOS, and Ascend Performance Materials are key contributors to the market's dynamics, constantly innovating and competing for market share.
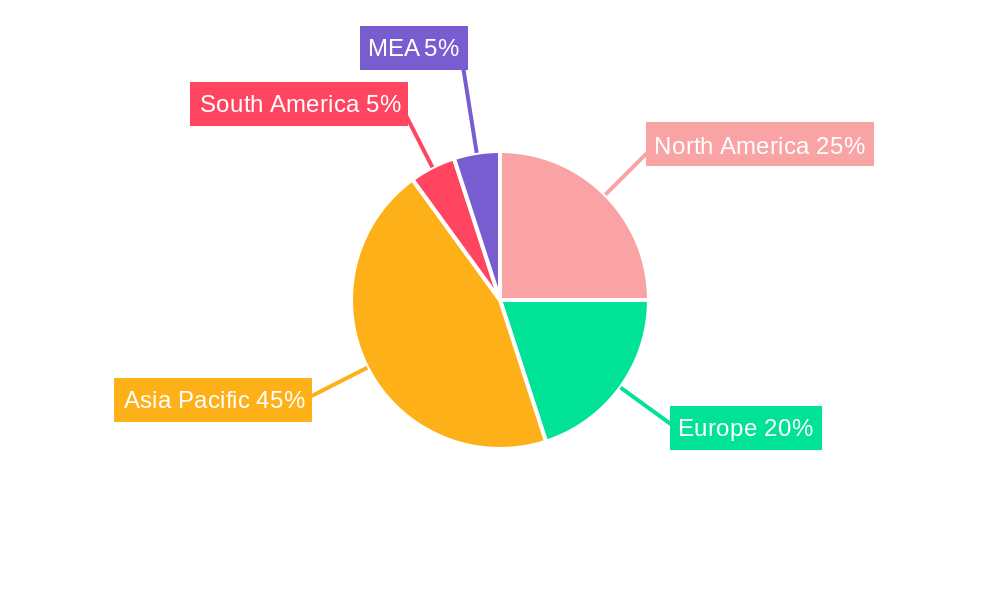
The geographical distribution of the acrylonitrile market reveals a strong presence in Asia Pacific, particularly in China, driven by its substantial manufacturing base and rapidly growing infrastructure development. North America and Europe also maintain significant market share, though growth rates may be slightly moderated by factors such as established regulations and mature markets. The competitive landscape involves a mix of large multinational corporations and regional players. These companies are constantly striving to improve production efficiency, expand product portfolios, and explore new applications to enhance their market position. Future growth is expected to be influenced by technological advancements in production processes, focused on enhancing efficiency and minimizing environmental impact, as well as continued growth in key end-use sectors. Continued investment in R&D will be crucial for players to maintain competitiveness.
Acrylonitrile Market: A Comprehensive Report (2019-2033)
This comprehensive report provides an in-depth analysis of the global acrylonitrile market, offering invaluable insights for stakeholders across the value chain. Covering the period from 2019 to 2033, with 2025 as the base year, this report forecasts market trends, identifies key players, and analyzes various segments to help businesses make informed strategic decisions. The market is projected to reach xx Billion by 2033, exhibiting a CAGR of xx% during the forecast period (2025-2033).
Acrylonitrile Market Structure & Competitive Dynamics
The acrylonitrile market exhibits a moderately concentrated structure, with a few major players holding significant market share. Key players like Jiangsu Shenghong Group Co Ltd, INEOS, Ascend Performance Materials, and China Petrochemical Development Corporation dominate the landscape. The market is characterized by intense competition, driven by factors such as pricing pressures, technological advancements, and stringent environmental regulations. Innovation ecosystems are crucial, with companies investing heavily in R&D to develop sustainable and high-performance acrylonitrile-based products. Regulatory frameworks, particularly concerning environmental protection and safety, play a significant role in shaping market dynamics. Product substitutes, such as other polymers, exert competitive pressure, pushing manufacturers to innovate and differentiate their offerings. End-user trends, especially toward sustainable materials and circular economy principles, are reshaping demand patterns. M&A activities have been relatively modest in recent years, with deal values ranging from xx Billion to xx Billion.
- Market Concentration: High, with top 5 players accounting for approximately xx% of global market share in 2024.
- Innovation Ecosystems: Significant R&D investments focused on sustainable production and new applications.
- Regulatory Frameworks: Stringent environmental regulations impacting production processes and product lifecycle.
- Product Substitutes: Competition from alternative materials like other polymers and bio-based alternatives.
- End-User Trends: Growing demand for sustainable and high-performance acrylonitrile-based products.
- M&A Activities: Moderate activity, with deal values averaging xx Billion in recent years.
Acrylonitrile Market Industry Trends & Insights
The global acrylonitrile market is witnessing robust growth, driven by several key factors. The increasing demand from the construction, automotive, and textile industries is a major contributor. Technological advancements in production processes, particularly focusing on sustainability and efficiency, are improving production yields and lowering costs. Consumer preferences are shifting toward sustainable and environmentally friendly products, which is stimulating the demand for bio-attributed acrylonitrile. However, fluctuating raw material prices and economic downturns pose challenges to the industry's growth. The market is also experiencing competitive dynamics, with companies vying for market share through innovation, cost optimization, and strategic partnerships. The market penetration of bio-attributed acrylonitrile is still relatively low, but it is expected to grow significantly in the coming years.
Dominant Markets & Segments in Acrylonitrile Market
The Asia-Pacific region, particularly China, dominates the global acrylonitrile market, driven by robust economic growth, expanding industrialization, and significant investments in infrastructure development.
Leading Region: Asia-Pacific (China being a key driver).
Dominant Segments:
- Process Technology: Ammoxidation Process holds the largest market share due to its economic efficiency and established infrastructure.
- Application: Acrylic fiber accounts for the largest share due to its wide usage in textiles and other applications.
- End-use Industry: Building & Construction is the largest end-use segment, followed by the Automotive industry. Within Building & Construction, the residential segment shows significant growth potential. In the automotive sector, the demand is largely driven by the growing PV and LCV markets.
Key Drivers for Dominant Segments:
- Acrylic Fiber: Growing demand for textiles, particularly in developing economies.
- Building & Construction: Infrastructure development and urbanization in developing countries.
- Automotive: Increasing production of vehicles globally, particularly in developing markets.
- Ammoxidation Process: Cost-effectiveness and established production infrastructure.
Acrylonitrile Market Product Innovations
Recent innovations in the acrylonitrile market focus on developing sustainable and high-performance products. INEOS Nitriles' launch of InvireoTM, a bio-attributed acrylonitrile, showcases the industry's commitment to environmental sustainability. Advancements in production processes aim to enhance efficiency and reduce the environmental footprint. New applications are being explored, further expanding the market potential for acrylonitrile. The focus on enhancing product performance and developing specialized grades for specific applications is driving innovation within the market.
Report Segmentation & Scope
This report segments the acrylonitrile market across various parameters:
- Process Technology: Ammoxidation Process and Other Production Processes. Growth in the Ammoxidation segment is projected to be xx Billion by 2033. The "Other Production Processes" segment is also expected to grow at xx Billion by 2033.
- Application: Acrylic Fiber, Acrylonitrile Butadiene Styrene (ABS)/Styrene-Acrylonitrile Resin (SAN), Acrylamide, Nitrile Butadiene Rubber (NBR), and Other Applications. Acrylic Fiber is the largest segment, projected to reach xx Billion by 2033.
- End-use Industry: Building & Construction (Residential, Commercial, Industrial and Infrastructural), Automotive (PVs, LCVs, and HCVs), Packaging (Rigid and Flexible), Electrical & Electronics (Home Appliances, Gadgets, and Others), Medical & Pharmaceuticals (Drugs, Medical Equipments and Others), Textiles and Others. The building and construction sector is expected to dominate, reaching xx Billion by 2033.
Each segment’s growth projection is detailed within the complete report.
Key Drivers of Acrylonitrile Market Growth
The acrylonitrile market's growth is propelled by several factors: increasing demand from key end-use industries (construction, automotive), technological advancements leading to improved production efficiency and cost reduction, the shift towards sustainable and bio-attributed products, and government initiatives promoting infrastructure development. The expanding global economy and urbanization also contribute significantly to market expansion.
Challenges in the Acrylonitrile Market Sector
Challenges facing the acrylonitrile market include fluctuating raw material prices, stringent environmental regulations impacting production costs, and the competitive pressure from substitute materials. Supply chain disruptions and geopolitical uncertainties also present risks to market stability. The impact of these factors on profitability and market growth varies but can be substantial.
Leading Players in the Acrylonitrile Market Market
- Jiangsu Shenghong Group Co Ltd
- INEOS
- Ascend Performance Materials
- China Petrochemical Development Corporation
- Cornerstone Chemical Company
- Taekwang Industrial Co Ltd
- AnQore
- Asahi Kasei Advance Corporation
- Formosa Plastics Corp
- China Petroleum & Chemical Corporation (SINOPEC)
- PetroChina (CNPC)
- SOCAR (Petkim Petrokimya Holding A)
Key Developments in Acrylonitrile Market Sector
- February 2024: The Mitsubishi Chemical Group announced the discontinuation of MMA monomer production and shift towards acrylonitrile and its derivatives. This signifies a strategic market repositioning.
- November 2023: China Petrochemical Development Corp resumed production at two acrylonitrile lines in Taiwan, boosting supply.
- June 2023: INEOS Nitriles launched InvireoTM, a bio-attributed acrylonitrile, highlighting the growing focus on sustainability.
- February 2023: Sumitomo Chemical Co. Ltd obtained ISCC PLUS certification for its acrylonitrile, demonstrating commitment to sustainable practices.
Strategic Acrylonitrile Market Outlook
The acrylonitrile market presents significant growth opportunities, fueled by continued expansion in key end-use sectors, particularly construction and automotive. The increasing adoption of sustainable production methods and the development of innovative applications will further drive market expansion. Companies focusing on innovation, sustainability, and efficient supply chains are poised to capture significant market share in the coming years. Strategic partnerships and collaborations will also play a crucial role in shaping the future of the acrylonitrile market.
Acrylonitrile Market Segmentation
-
1. Process Technology
- 1.1. Ammoxidation Process
- 1.2. Other Production Processes
-
2. Application
- 2.1. Acrylic Fiber
- 2.2. Acryloni
- 2.3. Acrylamide
- 2.4. Nitrile Butadiene Rubber (NBR)
- 2.5. Other Applications
Acrylonitrile Market Segmentation By Geography
-
1. Asia Pacific
- 1.1. China
- 1.2. India
- 1.3. Japan
- 1.4. South Korea
- 1.5. Rest of Asia Pacific
-
2. North America
- 2.1. United States
- 2.2. Canada
-
3. Europe
- 3.1. Germany
- 3.2. United Kingdom
- 3.3. Italy
- 3.4. France
- 3.5. Russia
- 3.6. Rest of Europe
-
4. Latin America
- 4.1. Brazil
- 4.2. Argentina
- 4.3. Colombia
- 4.4. Rest of Latin America
- 5. Middle East and Africa
Acrylonitrile Market REPORT HIGHLIGHTS
| Aspects | Details |
|---|---|
| Study Period | 2019-2033 |
| Base Year | 2024 |
| Estimated Year | 2025 |
| Forecast Period | 2025-2033 |
| Historical Period | 2019-2024 |
| Growth Rate | CAGR of 4.1% from 2019-2033 |
| Segmentation |
|
Table of Contents
- 1. Introduction
- 1.1. Research Scope
- 1.2. Market Segmentation
- 1.3. Research Methodology
- 1.4. Definitions and Assumptions
- 2. Executive Summary
- 2.1. Introduction
- 3. Market Dynamics
- 3.1. Introduction
- 3.2. Market Drivers
- 3.2.1. Increasing Demand for Acrylonitrile Butadiene Styrene (ABS) in the Automotive and Construction Industries; Growing Textile Industry
- 3.3. Market Restrains
- 3.3.1. Toxicity and Regulations of Acrylonitrile; Other Restraints
- 3.4. Market Trends
- 3.4.1. The Demand for Acrylonitrile for Acrylonitrile Butadiene Styrene (ABS) is Rising
- 4. Market Factor Analysis
- 4.1. Porters Five Forces
- 4.2. Supply/Value Chain
- 4.3. PESTEL analysis
- 4.4. Market Entropy
- 4.5. Patent/Trademark Analysis
- 5. Global Acrylonitrile Market Analysis, Insights and Forecast, 2019-2031
- 5.1. Market Analysis, Insights and Forecast - by Process Technology
- 5.1.1. Ammoxidation Process
- 5.1.2. Other Production Processes
- 5.2. Market Analysis, Insights and Forecast - by Application
- 5.2.1. Acrylic Fiber
- 5.2.2. Acryloni
- 5.2.3. Acrylamide
- 5.2.4. Nitrile Butadiene Rubber (NBR)
- 5.2.5. Other Applications
- 5.3. Market Analysis, Insights and Forecast - by Region
- 5.3.1. Asia Pacific
- 5.3.2. North America
- 5.3.3. Europe
- 5.3.4. Latin America
- 5.3.5. Middle East and Africa
- 5.1. Market Analysis, Insights and Forecast - by Process Technology
- 6. Asia Pacific Acrylonitrile Market Analysis, Insights and Forecast, 2019-2031
- 6.1. Market Analysis, Insights and Forecast - by Process Technology
- 6.1.1. Ammoxidation Process
- 6.1.2. Other Production Processes
- 6.2. Market Analysis, Insights and Forecast - by Application
- 6.2.1. Acrylic Fiber
- 6.2.2. Acryloni
- 6.2.3. Acrylamide
- 6.2.4. Nitrile Butadiene Rubber (NBR)
- 6.2.5. Other Applications
- 6.1. Market Analysis, Insights and Forecast - by Process Technology
- 7. North America Acrylonitrile Market Analysis, Insights and Forecast, 2019-2031
- 7.1. Market Analysis, Insights and Forecast - by Process Technology
- 7.1.1. Ammoxidation Process
- 7.1.2. Other Production Processes
- 7.2. Market Analysis, Insights and Forecast - by Application
- 7.2.1. Acrylic Fiber
- 7.2.2. Acryloni
- 7.2.3. Acrylamide
- 7.2.4. Nitrile Butadiene Rubber (NBR)
- 7.2.5. Other Applications
- 7.1. Market Analysis, Insights and Forecast - by Process Technology
- 8. Europe Acrylonitrile Market Analysis, Insights and Forecast, 2019-2031
- 8.1. Market Analysis, Insights and Forecast - by Process Technology
- 8.1.1. Ammoxidation Process
- 8.1.2. Other Production Processes
- 8.2. Market Analysis, Insights and Forecast - by Application
- 8.2.1. Acrylic Fiber
- 8.2.2. Acryloni
- 8.2.3. Acrylamide
- 8.2.4. Nitrile Butadiene Rubber (NBR)
- 8.2.5. Other Applications
- 8.1. Market Analysis, Insights and Forecast - by Process Technology
- 9. Latin America Acrylonitrile Market Analysis, Insights and Forecast, 2019-2031
- 9.1. Market Analysis, Insights and Forecast - by Process Technology
- 9.1.1. Ammoxidation Process
- 9.1.2. Other Production Processes
- 9.2. Market Analysis, Insights and Forecast - by Application
- 9.2.1. Acrylic Fiber
- 9.2.2. Acryloni
- 9.2.3. Acrylamide
- 9.2.4. Nitrile Butadiene Rubber (NBR)
- 9.2.5. Other Applications
- 9.1. Market Analysis, Insights and Forecast - by Process Technology
- 10. Middle East and Africa Acrylonitrile Market Analysis, Insights and Forecast, 2019-2031
- 10.1. Market Analysis, Insights and Forecast - by Process Technology
- 10.1.1. Ammoxidation Process
- 10.1.2. Other Production Processes
- 10.2. Market Analysis, Insights and Forecast - by Application
- 10.2.1. Acrylic Fiber
- 10.2.2. Acryloni
- 10.2.3. Acrylamide
- 10.2.4. Nitrile Butadiene Rubber (NBR)
- 10.2.5. Other Applications
- 10.1. Market Analysis, Insights and Forecast - by Process Technology
- 11. North America Acrylonitrile Market Analysis, Insights and Forecast, 2019-2031
- 11.1. Market Analysis, Insights and Forecast - By Country/Sub-region
- 11.1.1 United States
- 11.1.2 Canada
- 11.1.3 Mexico
- 12. Europe Acrylonitrile Market Analysis, Insights and Forecast, 2019-2031
- 12.1. Market Analysis, Insights and Forecast - By Country/Sub-region
- 12.1.1 Germany
- 12.1.2 France
- 12.1.3 Italy
- 12.1.4 United Kingdom
- 12.1.5 Netherlands
- 12.1.6 Rest of Europe
- 13. Asia Pacific Acrylonitrile Market Analysis, Insights and Forecast, 2019-2031
- 13.1. Market Analysis, Insights and Forecast - By Country/Sub-region
- 13.1.1 China
- 13.1.2 Japan
- 13.1.3 India
- 13.1.4 South Korea
- 13.1.5 Taiwan
- 13.1.6 Australia
- 13.1.7 Rest of Asia-Pacific
- 14. South America Acrylonitrile Market Analysis, Insights and Forecast, 2019-2031
- 14.1. Market Analysis, Insights and Forecast - By Country/Sub-region
- 14.1.1 Brazil
- 14.1.2 Argentina
- 14.1.3 Rest of South America
- 15. MEA Acrylonitrile Market Analysis, Insights and Forecast, 2019-2031
- 15.1. Market Analysis, Insights and Forecast - By Country/Sub-region
- 15.1.1 Middle East
- 15.1.2 Africa
- 16. Competitive Analysis
- 16.1. Global Market Share Analysis 2024
- 16.2. Company Profiles
- 16.2.1 Jiangsu Shenghong Group Co Ltd
- 16.2.1.1. Overview
- 16.2.1.2. Products
- 16.2.1.3. SWOT Analysis
- 16.2.1.4. Recent Developments
- 16.2.1.5. Financials (Based on Availability)
- 16.2.2 INEOS
- 16.2.2.1. Overview
- 16.2.2.2. Products
- 16.2.2.3. SWOT Analysis
- 16.2.2.4. Recent Developments
- 16.2.2.5. Financials (Based on Availability)
- 16.2.3 Ascend Performance Materials
- 16.2.3.1. Overview
- 16.2.3.2. Products
- 16.2.3.3. SWOT Analysis
- 16.2.3.4. Recent Developments
- 16.2.3.5. Financials (Based on Availability)
- 16.2.4 China Petrochemical Development Corporation
- 16.2.4.1. Overview
- 16.2.4.2. Products
- 16.2.4.3. SWOT Analysis
- 16.2.4.4. Recent Developments
- 16.2.4.5. Financials (Based on Availability)
- 16.2.5 Cornerstone Chemical Company
- 16.2.5.1. Overview
- 16.2.5.2. Products
- 16.2.5.3. SWOT Analysis
- 16.2.5.4. Recent Developments
- 16.2.5.5. Financials (Based on Availability)
- 16.2.6 Taekwang Industrial Co Ltd
- 16.2.6.1. Overview
- 16.2.6.2. Products
- 16.2.6.3. SWOT Analysis
- 16.2.6.4. Recent Developments
- 16.2.6.5. Financials (Based on Availability)
- 16.2.7 AnQore
- 16.2.7.1. Overview
- 16.2.7.2. Products
- 16.2.7.3. SWOT Analysis
- 16.2.7.4. Recent Developments
- 16.2.7.5. Financials (Based on Availability)
- 16.2.8 Asahi Kasei Advance Corporation
- 16.2.8.1. Overview
- 16.2.8.2. Products
- 16.2.8.3. SWOT Analysis
- 16.2.8.4. Recent Developments
- 16.2.8.5. Financials (Based on Availability)
- 16.2.9 Formosa Plastics Corp
- 16.2.9.1. Overview
- 16.2.9.2. Products
- 16.2.9.3. SWOT Analysis
- 16.2.9.4. Recent Developments
- 16.2.9.5. Financials (Based on Availability)
- 16.2.10 China Petroleum & Chemical Corporation (SINOPEC)
- 16.2.10.1. Overview
- 16.2.10.2. Products
- 16.2.10.3. SWOT Analysis
- 16.2.10.4. Recent Developments
- 16.2.10.5. Financials (Based on Availability)
- 16.2.11 PetroChina (CNPC)
- 16.2.11.1. Overview
- 16.2.11.2. Products
- 16.2.11.3. SWOT Analysis
- 16.2.11.4. Recent Developments
- 16.2.11.5. Financials (Based on Availability)
- 16.2.12 SOCAR (Petkim Petrokimya Holding A)
- 16.2.12.1. Overview
- 16.2.12.2. Products
- 16.2.12.3. SWOT Analysis
- 16.2.12.4. Recent Developments
- 16.2.12.5. Financials (Based on Availability)
- 16.2.1 Jiangsu Shenghong Group Co Ltd
List of Figures
- Figure 1: Global Acrylonitrile Market Revenue Breakdown (Billion, %) by Region 2024 & 2032
- Figure 2: Global Acrylonitrile Market Volume Breakdown (K Tons, %) by Region 2024 & 2032
- Figure 3: North America Acrylonitrile Market Revenue (Billion), by Country 2024 & 2032
- Figure 4: North America Acrylonitrile Market Volume (K Tons), by Country 2024 & 2032
- Figure 5: North America Acrylonitrile Market Revenue Share (%), by Country 2024 & 2032
- Figure 6: North America Acrylonitrile Market Volume Share (%), by Country 2024 & 2032
- Figure 7: Europe Acrylonitrile Market Revenue (Billion), by Country 2024 & 2032
- Figure 8: Europe Acrylonitrile Market Volume (K Tons), by Country 2024 & 2032
- Figure 9: Europe Acrylonitrile Market Revenue Share (%), by Country 2024 & 2032
- Figure 10: Europe Acrylonitrile Market Volume Share (%), by Country 2024 & 2032
- Figure 11: Asia Pacific Acrylonitrile Market Revenue (Billion), by Country 2024 & 2032
- Figure 12: Asia Pacific Acrylonitrile Market Volume (K Tons), by Country 2024 & 2032
- Figure 13: Asia Pacific Acrylonitrile Market Revenue Share (%), by Country 2024 & 2032
- Figure 14: Asia Pacific Acrylonitrile Market Volume Share (%), by Country 2024 & 2032
- Figure 15: South America Acrylonitrile Market Revenue (Billion), by Country 2024 & 2032
- Figure 16: South America Acrylonitrile Market Volume (K Tons), by Country 2024 & 2032
- Figure 17: South America Acrylonitrile Market Revenue Share (%), by Country 2024 & 2032
- Figure 18: South America Acrylonitrile Market Volume Share (%), by Country 2024 & 2032
- Figure 19: MEA Acrylonitrile Market Revenue (Billion), by Country 2024 & 2032
- Figure 20: MEA Acrylonitrile Market Volume (K Tons), by Country 2024 & 2032
- Figure 21: MEA Acrylonitrile Market Revenue Share (%), by Country 2024 & 2032
- Figure 22: MEA Acrylonitrile Market Volume Share (%), by Country 2024 & 2032
- Figure 23: Asia Pacific Acrylonitrile Market Revenue (Billion), by Process Technology 2024 & 2032
- Figure 24: Asia Pacific Acrylonitrile Market Volume (K Tons), by Process Technology 2024 & 2032
- Figure 25: Asia Pacific Acrylonitrile Market Revenue Share (%), by Process Technology 2024 & 2032
- Figure 26: Asia Pacific Acrylonitrile Market Volume Share (%), by Process Technology 2024 & 2032
- Figure 27: Asia Pacific Acrylonitrile Market Revenue (Billion), by Application 2024 & 2032
- Figure 28: Asia Pacific Acrylonitrile Market Volume (K Tons), by Application 2024 & 2032
- Figure 29: Asia Pacific Acrylonitrile Market Revenue Share (%), by Application 2024 & 2032
- Figure 30: Asia Pacific Acrylonitrile Market Volume Share (%), by Application 2024 & 2032
- Figure 31: Asia Pacific Acrylonitrile Market Revenue (Billion), by Country 2024 & 2032
- Figure 32: Asia Pacific Acrylonitrile Market Volume (K Tons), by Country 2024 & 2032
- Figure 33: Asia Pacific Acrylonitrile Market Revenue Share (%), by Country 2024 & 2032
- Figure 34: Asia Pacific Acrylonitrile Market Volume Share (%), by Country 2024 & 2032
- Figure 35: North America Acrylonitrile Market Revenue (Billion), by Process Technology 2024 & 2032
- Figure 36: North America Acrylonitrile Market Volume (K Tons), by Process Technology 2024 & 2032
- Figure 37: North America Acrylonitrile Market Revenue Share (%), by Process Technology 2024 & 2032
- Figure 38: North America Acrylonitrile Market Volume Share (%), by Process Technology 2024 & 2032
- Figure 39: North America Acrylonitrile Market Revenue (Billion), by Application 2024 & 2032
- Figure 40: North America Acrylonitrile Market Volume (K Tons), by Application 2024 & 2032
- Figure 41: North America Acrylonitrile Market Revenue Share (%), by Application 2024 & 2032
- Figure 42: North America Acrylonitrile Market Volume Share (%), by Application 2024 & 2032
- Figure 43: North America Acrylonitrile Market Revenue (Billion), by Country 2024 & 2032
- Figure 44: North America Acrylonitrile Market Volume (K Tons), by Country 2024 & 2032
- Figure 45: North America Acrylonitrile Market Revenue Share (%), by Country 2024 & 2032
- Figure 46: North America Acrylonitrile Market Volume Share (%), by Country 2024 & 2032
- Figure 47: Europe Acrylonitrile Market Revenue (Billion), by Process Technology 2024 & 2032
- Figure 48: Europe Acrylonitrile Market Volume (K Tons), by Process Technology 2024 & 2032
- Figure 49: Europe Acrylonitrile Market Revenue Share (%), by Process Technology 2024 & 2032
- Figure 50: Europe Acrylonitrile Market Volume Share (%), by Process Technology 2024 & 2032
- Figure 51: Europe Acrylonitrile Market Revenue (Billion), by Application 2024 & 2032
- Figure 52: Europe Acrylonitrile Market Volume (K Tons), by Application 2024 & 2032
- Figure 53: Europe Acrylonitrile Market Revenue Share (%), by Application 2024 & 2032
- Figure 54: Europe Acrylonitrile Market Volume Share (%), by Application 2024 & 2032
- Figure 55: Europe Acrylonitrile Market Revenue (Billion), by Country 2024 & 2032
- Figure 56: Europe Acrylonitrile Market Volume (K Tons), by Country 2024 & 2032
- Figure 57: Europe Acrylonitrile Market Revenue Share (%), by Country 2024 & 2032
- Figure 58: Europe Acrylonitrile Market Volume Share (%), by Country 2024 & 2032
- Figure 59: Latin America Acrylonitrile Market Revenue (Billion), by Process Technology 2024 & 2032
- Figure 60: Latin America Acrylonitrile Market Volume (K Tons), by Process Technology 2024 & 2032
- Figure 61: Latin America Acrylonitrile Market Revenue Share (%), by Process Technology 2024 & 2032
- Figure 62: Latin America Acrylonitrile Market Volume Share (%), by Process Technology 2024 & 2032
- Figure 63: Latin America Acrylonitrile Market Revenue (Billion), by Application 2024 & 2032
- Figure 64: Latin America Acrylonitrile Market Volume (K Tons), by Application 2024 & 2032
- Figure 65: Latin America Acrylonitrile Market Revenue Share (%), by Application 2024 & 2032
- Figure 66: Latin America Acrylonitrile Market Volume Share (%), by Application 2024 & 2032
- Figure 67: Latin America Acrylonitrile Market Revenue (Billion), by Country 2024 & 2032
- Figure 68: Latin America Acrylonitrile Market Volume (K Tons), by Country 2024 & 2032
- Figure 69: Latin America Acrylonitrile Market Revenue Share (%), by Country 2024 & 2032
- Figure 70: Latin America Acrylonitrile Market Volume Share (%), by Country 2024 & 2032
- Figure 71: Middle East and Africa Acrylonitrile Market Revenue (Billion), by Process Technology 2024 & 2032
- Figure 72: Middle East and Africa Acrylonitrile Market Volume (K Tons), by Process Technology 2024 & 2032
- Figure 73: Middle East and Africa Acrylonitrile Market Revenue Share (%), by Process Technology 2024 & 2032
- Figure 74: Middle East and Africa Acrylonitrile Market Volume Share (%), by Process Technology 2024 & 2032
- Figure 75: Middle East and Africa Acrylonitrile Market Revenue (Billion), by Application 2024 & 2032
- Figure 76: Middle East and Africa Acrylonitrile Market Volume (K Tons), by Application 2024 & 2032
- Figure 77: Middle East and Africa Acrylonitrile Market Revenue Share (%), by Application 2024 & 2032
- Figure 78: Middle East and Africa Acrylonitrile Market Volume Share (%), by Application 2024 & 2032
- Figure 79: Middle East and Africa Acrylonitrile Market Revenue (Billion), by Country 2024 & 2032
- Figure 80: Middle East and Africa Acrylonitrile Market Volume (K Tons), by Country 2024 & 2032
- Figure 81: Middle East and Africa Acrylonitrile Market Revenue Share (%), by Country 2024 & 2032
- Figure 82: Middle East and Africa Acrylonitrile Market Volume Share (%), by Country 2024 & 2032
List of Tables
- Table 1: Global Acrylonitrile Market Revenue Billion Forecast, by Region 2019 & 2032
- Table 2: Global Acrylonitrile Market Volume K Tons Forecast, by Region 2019 & 2032
- Table 3: Global Acrylonitrile Market Revenue Billion Forecast, by Process Technology 2019 & 2032
- Table 4: Global Acrylonitrile Market Volume K Tons Forecast, by Process Technology 2019 & 2032
- Table 5: Global Acrylonitrile Market Revenue Billion Forecast, by Application 2019 & 2032
- Table 6: Global Acrylonitrile Market Volume K Tons Forecast, by Application 2019 & 2032
- Table 7: Global Acrylonitrile Market Revenue Billion Forecast, by Region 2019 & 2032
- Table 8: Global Acrylonitrile Market Volume K Tons Forecast, by Region 2019 & 2032
- Table 9: Global Acrylonitrile Market Revenue Billion Forecast, by Country 2019 & 2032
- Table 10: Global Acrylonitrile Market Volume K Tons Forecast, by Country 2019 & 2032
- Table 11: United States Acrylonitrile Market Revenue (Billion) Forecast, by Application 2019 & 2032
- Table 12: United States Acrylonitrile Market Volume (K Tons) Forecast, by Application 2019 & 2032
- Table 13: Canada Acrylonitrile Market Revenue (Billion) Forecast, by Application 2019 & 2032
- Table 14: Canada Acrylonitrile Market Volume (K Tons) Forecast, by Application 2019 & 2032
- Table 15: Mexico Acrylonitrile Market Revenue (Billion) Forecast, by Application 2019 & 2032
- Table 16: Mexico Acrylonitrile Market Volume (K Tons) Forecast, by Application 2019 & 2032
- Table 17: Global Acrylonitrile Market Revenue Billion Forecast, by Country 2019 & 2032
- Table 18: Global Acrylonitrile Market Volume K Tons Forecast, by Country 2019 & 2032
- Table 19: Germany Acrylonitrile Market Revenue (Billion) Forecast, by Application 2019 & 2032
- Table 20: Germany Acrylonitrile Market Volume (K Tons) Forecast, by Application 2019 & 2032
- Table 21: France Acrylonitrile Market Revenue (Billion) Forecast, by Application 2019 & 2032
- Table 22: France Acrylonitrile Market Volume (K Tons) Forecast, by Application 2019 & 2032
- Table 23: Italy Acrylonitrile Market Revenue (Billion) Forecast, by Application 2019 & 2032
- Table 24: Italy Acrylonitrile Market Volume (K Tons) Forecast, by Application 2019 & 2032
- Table 25: United Kingdom Acrylonitrile Market Revenue (Billion) Forecast, by Application 2019 & 2032
- Table 26: United Kingdom Acrylonitrile Market Volume (K Tons) Forecast, by Application 2019 & 2032
- Table 27: Netherlands Acrylonitrile Market Revenue (Billion) Forecast, by Application 2019 & 2032
- Table 28: Netherlands Acrylonitrile Market Volume (K Tons) Forecast, by Application 2019 & 2032
- Table 29: Rest of Europe Acrylonitrile Market Revenue (Billion) Forecast, by Application 2019 & 2032
- Table 30: Rest of Europe Acrylonitrile Market Volume (K Tons) Forecast, by Application 2019 & 2032
- Table 31: Global Acrylonitrile Market Revenue Billion Forecast, by Country 2019 & 2032
- Table 32: Global Acrylonitrile Market Volume K Tons Forecast, by Country 2019 & 2032
- Table 33: China Acrylonitrile Market Revenue (Billion) Forecast, by Application 2019 & 2032
- Table 34: China Acrylonitrile Market Volume (K Tons) Forecast, by Application 2019 & 2032
- Table 35: Japan Acrylonitrile Market Revenue (Billion) Forecast, by Application 2019 & 2032
- Table 36: Japan Acrylonitrile Market Volume (K Tons) Forecast, by Application 2019 & 2032
- Table 37: India Acrylonitrile Market Revenue (Billion) Forecast, by Application 2019 & 2032
- Table 38: India Acrylonitrile Market Volume (K Tons) Forecast, by Application 2019 & 2032
- Table 39: South Korea Acrylonitrile Market Revenue (Billion) Forecast, by Application 2019 & 2032
- Table 40: South Korea Acrylonitrile Market Volume (K Tons) Forecast, by Application 2019 & 2032
- Table 41: Taiwan Acrylonitrile Market Revenue (Billion) Forecast, by Application 2019 & 2032
- Table 42: Taiwan Acrylonitrile Market Volume (K Tons) Forecast, by Application 2019 & 2032
- Table 43: Australia Acrylonitrile Market Revenue (Billion) Forecast, by Application 2019 & 2032
- Table 44: Australia Acrylonitrile Market Volume (K Tons) Forecast, by Application 2019 & 2032
- Table 45: Rest of Asia-Pacific Acrylonitrile Market Revenue (Billion) Forecast, by Application 2019 & 2032
- Table 46: Rest of Asia-Pacific Acrylonitrile Market Volume (K Tons) Forecast, by Application 2019 & 2032
- Table 47: Global Acrylonitrile Market Revenue Billion Forecast, by Country 2019 & 2032
- Table 48: Global Acrylonitrile Market Volume K Tons Forecast, by Country 2019 & 2032
- Table 49: Brazil Acrylonitrile Market Revenue (Billion) Forecast, by Application 2019 & 2032
- Table 50: Brazil Acrylonitrile Market Volume (K Tons) Forecast, by Application 2019 & 2032
- Table 51: Argentina Acrylonitrile Market Revenue (Billion) Forecast, by Application 2019 & 2032
- Table 52: Argentina Acrylonitrile Market Volume (K Tons) Forecast, by Application 2019 & 2032
- Table 53: Rest of South America Acrylonitrile Market Revenue (Billion) Forecast, by Application 2019 & 2032
- Table 54: Rest of South America Acrylonitrile Market Volume (K Tons) Forecast, by Application 2019 & 2032
- Table 55: Global Acrylonitrile Market Revenue Billion Forecast, by Country 2019 & 2032
- Table 56: Global Acrylonitrile Market Volume K Tons Forecast, by Country 2019 & 2032
- Table 57: Middle East Acrylonitrile Market Revenue (Billion) Forecast, by Application 2019 & 2032
- Table 58: Middle East Acrylonitrile Market Volume (K Tons) Forecast, by Application 2019 & 2032
- Table 59: Africa Acrylonitrile Market Revenue (Billion) Forecast, by Application 2019 & 2032
- Table 60: Africa Acrylonitrile Market Volume (K Tons) Forecast, by Application 2019 & 2032
- Table 61: Global Acrylonitrile Market Revenue Billion Forecast, by Process Technology 2019 & 2032
- Table 62: Global Acrylonitrile Market Volume K Tons Forecast, by Process Technology 2019 & 2032
- Table 63: Global Acrylonitrile Market Revenue Billion Forecast, by Application 2019 & 2032
- Table 64: Global Acrylonitrile Market Volume K Tons Forecast, by Application 2019 & 2032
- Table 65: Global Acrylonitrile Market Revenue Billion Forecast, by Country 2019 & 2032
- Table 66: Global Acrylonitrile Market Volume K Tons Forecast, by Country 2019 & 2032
- Table 67: China Acrylonitrile Market Revenue (Billion) Forecast, by Application 2019 & 2032
- Table 68: China Acrylonitrile Market Volume (K Tons) Forecast, by Application 2019 & 2032
- Table 69: India Acrylonitrile Market Revenue (Billion) Forecast, by Application 2019 & 2032
- Table 70: India Acrylonitrile Market Volume (K Tons) Forecast, by Application 2019 & 2032
- Table 71: Japan Acrylonitrile Market Revenue (Billion) Forecast, by Application 2019 & 2032
- Table 72: Japan Acrylonitrile Market Volume (K Tons) Forecast, by Application 2019 & 2032
- Table 73: South Korea Acrylonitrile Market Revenue (Billion) Forecast, by Application 2019 & 2032
- Table 74: South Korea Acrylonitrile Market Volume (K Tons) Forecast, by Application 2019 & 2032
- Table 75: Rest of Asia Pacific Acrylonitrile Market Revenue (Billion) Forecast, by Application 2019 & 2032
- Table 76: Rest of Asia Pacific Acrylonitrile Market Volume (K Tons) Forecast, by Application 2019 & 2032
- Table 77: Global Acrylonitrile Market Revenue Billion Forecast, by Process Technology 2019 & 2032
- Table 78: Global Acrylonitrile Market Volume K Tons Forecast, by Process Technology 2019 & 2032
- Table 79: Global Acrylonitrile Market Revenue Billion Forecast, by Application 2019 & 2032
- Table 80: Global Acrylonitrile Market Volume K Tons Forecast, by Application 2019 & 2032
- Table 81: Global Acrylonitrile Market Revenue Billion Forecast, by Country 2019 & 2032
- Table 82: Global Acrylonitrile Market Volume K Tons Forecast, by Country 2019 & 2032
- Table 83: United States Acrylonitrile Market Revenue (Billion) Forecast, by Application 2019 & 2032
- Table 84: United States Acrylonitrile Market Volume (K Tons) Forecast, by Application 2019 & 2032
- Table 85: Canada Acrylonitrile Market Revenue (Billion) Forecast, by Application 2019 & 2032
- Table 86: Canada Acrylonitrile Market Volume (K Tons) Forecast, by Application 2019 & 2032
- Table 87: Global Acrylonitrile Market Revenue Billion Forecast, by Process Technology 2019 & 2032
- Table 88: Global Acrylonitrile Market Volume K Tons Forecast, by Process Technology 2019 & 2032
- Table 89: Global Acrylonitrile Market Revenue Billion Forecast, by Application 2019 & 2032
- Table 90: Global Acrylonitrile Market Volume K Tons Forecast, by Application 2019 & 2032
- Table 91: Global Acrylonitrile Market Revenue Billion Forecast, by Country 2019 & 2032
- Table 92: Global Acrylonitrile Market Volume K Tons Forecast, by Country 2019 & 2032
- Table 93: Germany Acrylonitrile Market Revenue (Billion) Forecast, by Application 2019 & 2032
- Table 94: Germany Acrylonitrile Market Volume (K Tons) Forecast, by Application 2019 & 2032
- Table 95: United Kingdom Acrylonitrile Market Revenue (Billion) Forecast, by Application 2019 & 2032
- Table 96: United Kingdom Acrylonitrile Market Volume (K Tons) Forecast, by Application 2019 & 2032
- Table 97: Italy Acrylonitrile Market Revenue (Billion) Forecast, by Application 2019 & 2032
- Table 98: Italy Acrylonitrile Market Volume (K Tons) Forecast, by Application 2019 & 2032
- Table 99: France Acrylonitrile Market Revenue (Billion) Forecast, by Application 2019 & 2032
- Table 100: France Acrylonitrile Market Volume (K Tons) Forecast, by Application 2019 & 2032
- Table 101: Russia Acrylonitrile Market Revenue (Billion) Forecast, by Application 2019 & 2032
- Table 102: Russia Acrylonitrile Market Volume (K Tons) Forecast, by Application 2019 & 2032
- Table 103: Rest of Europe Acrylonitrile Market Revenue (Billion) Forecast, by Application 2019 & 2032
- Table 104: Rest of Europe Acrylonitrile Market Volume (K Tons) Forecast, by Application 2019 & 2032
- Table 105: Global Acrylonitrile Market Revenue Billion Forecast, by Process Technology 2019 & 2032
- Table 106: Global Acrylonitrile Market Volume K Tons Forecast, by Process Technology 2019 & 2032
- Table 107: Global Acrylonitrile Market Revenue Billion Forecast, by Application 2019 & 2032
- Table 108: Global Acrylonitrile Market Volume K Tons Forecast, by Application 2019 & 2032
- Table 109: Global Acrylonitrile Market Revenue Billion Forecast, by Country 2019 & 2032
- Table 110: Global Acrylonitrile Market Volume K Tons Forecast, by Country 2019 & 2032
- Table 111: Brazil Acrylonitrile Market Revenue (Billion) Forecast, by Application 2019 & 2032
- Table 112: Brazil Acrylonitrile Market Volume (K Tons) Forecast, by Application 2019 & 2032
- Table 113: Argentina Acrylonitrile Market Revenue (Billion) Forecast, by Application 2019 & 2032
- Table 114: Argentina Acrylonitrile Market Volume (K Tons) Forecast, by Application 2019 & 2032
- Table 115: Colombia Acrylonitrile Market Revenue (Billion) Forecast, by Application 2019 & 2032
- Table 116: Colombia Acrylonitrile Market Volume (K Tons) Forecast, by Application 2019 & 2032
- Table 117: Rest of Latin America Acrylonitrile Market Revenue (Billion) Forecast, by Application 2019 & 2032
- Table 118: Rest of Latin America Acrylonitrile Market Volume (K Tons) Forecast, by Application 2019 & 2032
- Table 119: Global Acrylonitrile Market Revenue Billion Forecast, by Process Technology 2019 & 2032
- Table 120: Global Acrylonitrile Market Volume K Tons Forecast, by Process Technology 2019 & 2032
- Table 121: Global Acrylonitrile Market Revenue Billion Forecast, by Application 2019 & 2032
- Table 122: Global Acrylonitrile Market Volume K Tons Forecast, by Application 2019 & 2032
- Table 123: Global Acrylonitrile Market Revenue Billion Forecast, by Country 2019 & 2032
- Table 124: Global Acrylonitrile Market Volume K Tons Forecast, by Country 2019 & 2032
Frequently Asked Questions
1. What is the projected Compound Annual Growth Rate (CAGR) of the Acrylonitrile Market?
The projected CAGR is approximately 4.1%.
2. Which companies are prominent players in the Acrylonitrile Market?
Key companies in the market include Jiangsu Shenghong Group Co Ltd, INEOS, Ascend Performance Materials, China Petrochemical Development Corporation, Cornerstone Chemical Company, Taekwang Industrial Co Ltd, AnQore, Asahi Kasei Advance Corporation, Formosa Plastics Corp, China Petroleum & Chemical Corporation (SINOPEC), PetroChina (CNPC), SOCAR (Petkim Petrokimya Holding A).
3. What are the main segments of the Acrylonitrile Market?
The market segments include Process Technology, Application.
4. Can you provide details about the market size?
The market size is estimated to be USD 12.3 Billion as of 2022.
5. What are some drivers contributing to market growth?
Increasing Demand for Acrylonitrile Butadiene Styrene (ABS) in the Automotive and Construction Industries; Growing Textile Industry.
6. What are the notable trends driving market growth?
The Demand for Acrylonitrile for Acrylonitrile Butadiene Styrene (ABS) is Rising.
7. Are there any restraints impacting market growth?
Toxicity and Regulations of Acrylonitrile; Other Restraints.
8. Can you provide examples of recent developments in the market?
February 2024: The Mitsubishi Chemical Group announced the discontinuation of MMA monomer production by the ACH process and the production of acrylonitrile and acrylonitrile derivatives at the Mitsubishi Chemical Hiroshima Plant (Otake City, Hiroshima Prefecture).
9. What pricing options are available for accessing the report?
Pricing options include single-user, multi-user, and enterprise licenses priced at USD 4750, USD 5250, and USD 8750 respectively.
10. Is the market size provided in terms of value or volume?
The market size is provided in terms of value, measured in Billion and volume, measured in K Tons.
11. Are there any specific market keywords associated with the report?
Yes, the market keyword associated with the report is "Acrylonitrile Market," which aids in identifying and referencing the specific market segment covered.
12. How do I determine which pricing option suits my needs best?
The pricing options vary based on user requirements and access needs. Individual users may opt for single-user licenses, while businesses requiring broader access may choose multi-user or enterprise licenses for cost-effective access to the report.
13. Are there any additional resources or data provided in the Acrylonitrile Market report?
While the report offers comprehensive insights, it's advisable to review the specific contents or supplementary materials provided to ascertain if additional resources or data are available.
14. How can I stay updated on further developments or reports in the Acrylonitrile Market?
To stay informed about further developments, trends, and reports in the Acrylonitrile Market, consider subscribing to industry newsletters, following relevant companies and organizations, or regularly checking reputable industry news sources and publications.
Methodology
Step 1 - Identification of Relevant Samples Size from Population Database


Step 2 - Approaches for Defining Global Market Size (Value, Volume* & Price*)

Note*: In applicable scenarios
Step 3 - Data Sources
Primary Research
- Web Analytics
- Survey Reports
- Research Institute
- Latest Research Reports
- Opinion Leaders
Secondary Research
- Annual Reports
- White Paper
- Latest Press Release
- Industry Association
- Paid Database
- Investor Presentations

Step 4 - Data Triangulation
Involves using different sources of information in order to increase the validity of a study
These sources are likely to be stakeholders in a program - participants, other researchers, program staff, other community members, and so on.
Then we put all data in single framework & apply various statistical tools to find out the dynamic on the market.
During the analysis stage, feedback from the stakeholder groups would be compared to determine areas of agreement as well as areas of divergence


