
Key Insights
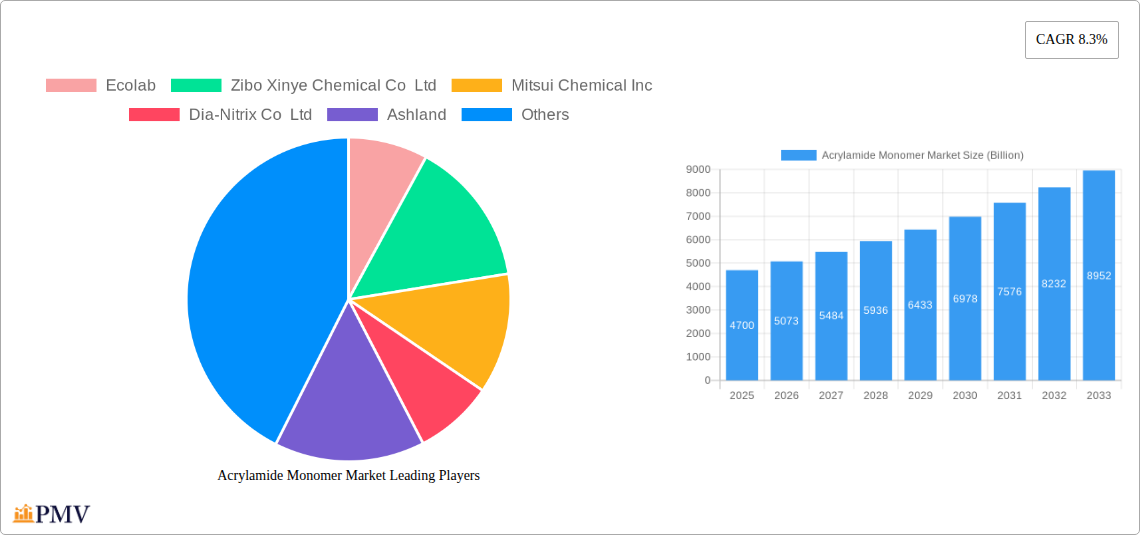
The Acrylamide Monomer market, valued at $4.7 billion in 2025, is projected to experience robust growth, exhibiting a compound annual growth rate (CAGR) of 8.3% from 2025 to 2033. This expansion is fueled by several key drivers. The increasing demand for water treatment solutions globally, driven by stringent environmental regulations and rising awareness of water scarcity, significantly boosts acrylamide monomer consumption in flocculant production. Simultaneously, the burgeoning pulp and paper industry, a major consumer of acrylamide-based flocculants for papermaking processes, contributes considerably to market growth. Furthermore, the expansion of enhanced oil recovery (EOR) techniques in the oil and gas sector, relying on acrylamide polymers for improved oil extraction, fuels market demand. Growth is also spurred by the diverse applications of acrylamide monomer in other industries, including cosmetics and construction. However, potential restraints include stringent environmental regulations regarding acrylamide handling and disposal, as well as concerns surrounding its potential toxicity, necessitating careful handling and waste management practices. The market is segmented by application (water treatment, pulp and paper, EOR, others) and sales channel (direct and indirect). Leading players include Ecolab, BASF, and several prominent Asian chemical manufacturers, competing based on product quality, price, and geographical reach. Regional analysis indicates strong growth in Asia-Pacific, driven by rapid industrialization and infrastructure development in countries like China and India. North America and Europe also maintain significant market shares, propelled by established industries and technological advancements in water treatment and oil recovery.
The competitive landscape is characterized by both large multinational corporations and specialized regional players. Larger companies leverage their extensive distribution networks and technological expertise to maintain market dominance, while smaller players focus on niche applications and regional markets. Future market growth will depend on technological innovations leading to more efficient and environmentally friendly acrylamide production and application methods, alongside the continued growth of key end-use sectors. Successful players will need to focus on sustainable manufacturing practices and comply with evolving environmental regulations to mitigate potential risks and maintain long-term market competitiveness. The market’s projected growth trajectory presents significant opportunities for both established players and new entrants, particularly those focused on sustainable and innovative solutions.
Acrylamide Monomer Market: A Comprehensive Report (2019-2033)
This comprehensive report provides an in-depth analysis of the global Acrylamide Monomer market, offering valuable insights for stakeholders seeking to understand market dynamics, competitive landscapes, and future growth opportunities. The report covers the period from 2019 to 2033, with a focus on the forecast period 2025-2033 and a base year of 2025. The total market size is projected to reach xx Billion by 2033.
Acrylamide Monomer Market Market Structure & Competitive Dynamics
The global acrylamide monomer market exhibits a moderately concentrated structure, with a few major players holding significant market share. The market is characterized by intense competition, driven by ongoing innovation in production technologies, a wide range of applications, and the continuous development of new product variants. Regulatory frameworks concerning acrylamide safety and environmental impact play a significant role in shaping market dynamics. The presence of substitute materials, albeit limited, necessitates continuous innovation to maintain competitiveness. End-user trends, particularly in the water treatment and pulp & paper industries, are major growth drivers. The market has witnessed several mergers and acquisitions (M&A) in recent years, with deal values reaching xx Billion in the past five years, primarily focused on expanding production capacities and gaining access to new markets.
- Market Concentration: Moderately concentrated, with the top 5 players holding approximately xx% of the market share.
- Innovation Ecosystems: Strong focus on improving production efficiency, reducing environmental impact, and developing specialized grades for various applications.
- Regulatory Frameworks: Stringent regulations regarding acrylamide safety and handling influence market growth and player strategies.
- Product Substitutes: Limited substitutes exist, primarily focused on specific niche applications.
- End-User Trends: Growing demand from water treatment and pulp & paper industries is a primary growth driver.
- M&A Activities: Significant M&A activity observed in recent years, driven by expansion strategies and market consolidation.
Acrylamide Monomer Market Industry Trends & Insights
The global acrylamide monomer market is experiencing robust growth, driven by increasing demand from various end-use sectors. The compound annual growth rate (CAGR) is estimated at xx% during the forecast period (2025-2033). Technological advancements in production processes, leading to higher efficiency and reduced costs, are a significant contributing factor. Consumer preferences for sustainable and environmentally friendly solutions are influencing the market, pushing manufacturers to adopt more sustainable practices. Competitive dynamics are characterized by continuous innovation, strategic partnerships, and M&A activities, aiming to enhance market share and product portfolio diversification. Market penetration is gradually increasing in emerging economies, driven by infrastructure development and rising industrialization.

Dominant Markets & Segments in Acrylamide Monomer Market
The Asia-Pacific region dominates the acrylamide monomer market, driven by rapid industrialization, expanding infrastructure projects, and increasing demand from key industries such as water treatment and pulp and paper. Within applications, the flocculant for water treatment segment holds the largest market share due to stringent regulations regarding water quality and increasing urbanization. Direct sales currently account for the largest portion of the sales channels.
Key Drivers in Asia-Pacific:
- Rapid industrialization and economic growth.
- Expanding infrastructure projects, especially in water treatment facilities.
- Growing awareness of water quality and environmental regulations.
Dominance Analysis: Asia-Pacific's dominance stems from its high population density, rapid economic growth, and increasing investments in infrastructure. The flocculant for water treatment segment's leading position is attributed to its crucial role in maintaining water quality and fulfilling stringent environmental regulations.
Acrylamide Monomer Market Product Innovations
Recent innovations in acrylamide monomer production focus on improving efficiency, reducing environmental impact, and developing specialized grades for specific applications. These innovations encompass the use of biocatalysts in production and the development of acrylamide-reducing yeast for reducing the formation of acrylamide in food processing. Such technological advancements provide manufacturers with a competitive edge by enhancing product quality, sustainability, and cost-effectiveness, improving market fit and attracting a wider customer base.
Report Segmentation & Scope
The report segments the acrylamide monomer market by application and sales channel:
By Application:
- Flocculant for Water Treatment: This segment is characterized by strong growth, driven by stringent water quality regulations and increasing urbanization. Market size is projected to reach xx Billion by 2033. Competitive dynamics are shaped by technological advancements and environmental concerns.
- Pulp and Paper Manufacturing: This segment experiences steady growth, driven by the expanding paper and packaging industry. Market size is projected to reach xx Billion by 2033. Competition is focused on providing high-quality products that meet industry standards.
- Enhanced Oil Recovery: This niche segment exhibits moderate growth, influenced by fluctuations in oil prices and technological advancements in oil extraction. Market size is projected to reach xx Billion by 2033. Competition is concentrated among a few specialized players.
- Other Applications: This segment includes diverse applications such as textile manufacturing and cosmetics. Market size is projected to reach xx Billion by 2033. Growth is driven by the specific demands of each sub-application.
By Sales Channel:
- Direct Sale: This channel dominates the market, offering manufacturers greater control over distribution and pricing. Market size is projected to reach xx Billion by 2033. Competition is based on factors like customer relationship management and pricing strategies.
- Indirect Sale: This channel involves distributors and resellers, providing wider market reach. Market size is projected to reach xx Billion by 2033. Competition is influenced by distributor networks and logistics capabilities.
Key Drivers of Acrylamide Monomer Market Growth
Several key factors drive the growth of the acrylamide monomer market. The increasing demand for water purification solutions in developing and developed economies fuels the growth of the water treatment segment. The expanding pulp and paper industry continues to be a major consumer of acrylamide monomer. Technological advancements in production processes enhance efficiency and reduce costs, boosting market growth. Furthermore, supportive government policies and regulations regarding water quality and environmental protection are contributing factors.
Challenges in the Acrylamide Monomer Market Sector
The acrylamide monomer market faces several challenges. Stringent regulations regarding acrylamide safety and handling impose costs on manufacturers. Fluctuations in raw material prices and supply chain disruptions can impact production costs and profitability. Intense competition among established players necessitates continuous innovation and cost optimization to maintain market share. Environmental concerns related to acrylamide production and disposal also pose significant challenges.
Leading Players in the Acrylamide Monomer Market Market
- Ecolab
- Zibo Xinye Chemical Co Ltd
- Mitsui Chemical Inc
- Dia-Nitrix Co Ltd
- Ashland
- BASF SE
- AnHui JuCheng Fine Chemicals Co Ltd
- Jiangxi Changjiu Agrochemical Co Ltd
- Anhui Tianrun Chemicals
- Shandong Dongying Chemicals Co Ltd
- Beijing Hengju Chemical Group Corporation
- SNF Group
Key Developments in Acrylamide Monomer Market Sector
- August 2023: Mitsui Chemicals Inc. announced that Polaris Chemicals Inc. had begun production of biocatalysts used in the production of acrylamide. This signifies a move towards more sustainable and efficient production methods, impacting market competitiveness.
- November 2022: Kerry released Acryleast Pro, an advanced acrylamide-reducing yeast. This development addresses concerns about acrylamide formation in food products, potentially impacting market demand in related sectors.
- March 2022: Renaissance BioScience was granted new patents for its non-GMO acrylamide-reducing yeast (ARY) in India, China, Australia, Vietnam, and Russia. This expands the availability of sustainable solutions for acrylamide reduction, altering the competitive landscape.
Strategic Acrylamide Monomer Market Market Outlook
The acrylamide monomer market is poised for continued growth, driven by increasing demand from key application sectors, ongoing technological advancements, and supportive government regulations. Strategic opportunities exist in developing sustainable production methods, expanding into emerging markets, and focusing on niche applications. Companies investing in research and development, adopting sustainable practices, and building strong supply chains are expected to gain a competitive advantage in this dynamic market.
Acrylamide Monomer Market Segmentation
-
1. Application
- 1.1. Flocculant for Water Treatment
- 1.2. Pulp and Paper Manufacturing
- 1.3. Enhanced Oil Recovery
- 1.4. Other Applications
Acrylamide Monomer Market Segmentation By Geography
-
1. Asia Pacific
- 1.1. China
- 1.2. India
- 1.3. Japan
- 1.4. South Korea
- 1.5. Thailand
- 1.6. Indoneisa
- 1.7. Vietnam
- 1.8. Malaysia
- 1.9. Rest of Asia Pacific
-
2. North America
- 2.1. United States
- 2.2. Canada
- 2.3. Mexico
-
3. Europe
- 3.1. Germany
- 3.2. United Kingdom
- 3.3. France
- 3.4. Italy
- 3.5. Spain
- 3.6. NORDIC
- 3.7. Russia
- 3.8. Turkey
- 3.9. Rest of Europe
-
4. South America
- 4.1. Brazil
- 4.2. Argentina
- 4.3. Colombia
- 4.4. Rest of South America
-
5. Middle East and Africa
- 5.1. Saudi Arabia
- 5.2. South Africa
- 5.3. United Arab Emirates
- 5.4. Egypt
- 5.5. Nigeria
- 5.6. Qatar
- 5.7. Rest of Middle East and Africa

Acrylamide Monomer Market REPORT HIGHLIGHTS
| Aspects | Details |
|---|---|
| Study Period | 2019-2033 |
| Base Year | 2024 |
| Estimated Year | 2025 |
| Forecast Period | 2025-2033 |
| Historical Period | 2019-2024 |
| Growth Rate | CAGR of 8.3% from 2019-2033 |
| Segmentation |
|
Table of Contents
- 1. Introduction
- 1.1. Research Scope
- 1.2. Market Segmentation
- 1.3. Research Methodology
- 1.4. Definitions and Assumptions
- 2. Executive Summary
- 2.1. Introduction
- 3. Market Dynamics
- 3.1. Introduction
- 3.2. Market Drivers
- 3.2.1. Rising Use for Enhanced Oil Recovery in Petroleum Industry; Increased Demand from Paper Mills
- 3.3. Market Restrains
- 3.3.1. Strigent Regulations towards the Usage of Acrylamide owing to its Toxicity; Other Restraints
- 3.4. Market Trends
- 3.4.1. Water Treatment Application to Dominate the Market
- 4. Market Factor Analysis
- 4.1. Porters Five Forces
- 4.2. Supply/Value Chain
- 4.3. PESTEL analysis
- 4.4. Market Entropy
- 4.5. Patent/Trademark Analysis
- 5. Global Acrylamide Monomer Market Analysis, Insights and Forecast, 2019-2031
- 5.1. Market Analysis, Insights and Forecast - by Application
- 5.1.1. Flocculant for Water Treatment
- 5.1.2. Pulp and Paper Manufacturing
- 5.1.3. Enhanced Oil Recovery
- 5.1.4. Other Applications
- 5.2. Market Analysis, Insights and Forecast - by Region
- 5.2.1. Asia Pacific
- 5.2.2. North America
- 5.2.3. Europe
- 5.2.4. South America
- 5.2.5. Middle East and Africa
- 5.1. Market Analysis, Insights and Forecast - by Application
- 6. Asia Pacific Acrylamide Monomer Market Analysis, Insights and Forecast, 2019-2031
- 6.1. Market Analysis, Insights and Forecast - by Application
- 6.1.1. Flocculant for Water Treatment
- 6.1.2. Pulp and Paper Manufacturing
- 6.1.3. Enhanced Oil Recovery
- 6.1.4. Other Applications
- 6.1. Market Analysis, Insights and Forecast - by Application
- 7. North America Acrylamide Monomer Market Analysis, Insights and Forecast, 2019-2031
- 7.1. Market Analysis, Insights and Forecast - by Application
- 7.1.1. Flocculant for Water Treatment
- 7.1.2. Pulp and Paper Manufacturing
- 7.1.3. Enhanced Oil Recovery
- 7.1.4. Other Applications
- 7.1. Market Analysis, Insights and Forecast - by Application
- 8. Europe Acrylamide Monomer Market Analysis, Insights and Forecast, 2019-2031
- 8.1. Market Analysis, Insights and Forecast - by Application
- 8.1.1. Flocculant for Water Treatment
- 8.1.2. Pulp and Paper Manufacturing
- 8.1.3. Enhanced Oil Recovery
- 8.1.4. Other Applications
- 8.1. Market Analysis, Insights and Forecast - by Application
- 9. South America Acrylamide Monomer Market Analysis, Insights and Forecast, 2019-2031
- 9.1. Market Analysis, Insights and Forecast - by Application
- 9.1.1. Flocculant for Water Treatment
- 9.1.2. Pulp and Paper Manufacturing
- 9.1.3. Enhanced Oil Recovery
- 9.1.4. Other Applications
- 9.1. Market Analysis, Insights and Forecast - by Application
- 10. Middle East and Africa Acrylamide Monomer Market Analysis, Insights and Forecast, 2019-2031
- 10.1. Market Analysis, Insights and Forecast - by Application
- 10.1.1. Flocculant for Water Treatment
- 10.1.2. Pulp and Paper Manufacturing
- 10.1.3. Enhanced Oil Recovery
- 10.1.4. Other Applications
- 10.1. Market Analysis, Insights and Forecast - by Application
- 11. North America Acrylamide Monomer Market Analysis, Insights and Forecast, 2019-2031
- 11.1. Market Analysis, Insights and Forecast - By Country/Sub-region
- 11.1.1 United States
- 11.1.2 Canada
- 11.1.3 Mexico
- 12. Europe Acrylamide Monomer Market Analysis, Insights and Forecast, 2019-2031
- 12.1. Market Analysis, Insights and Forecast - By Country/Sub-region
- 12.1.1 Germany
- 12.1.2 France
- 12.1.3 Italy
- 12.1.4 United Kingdom
- 12.1.5 Netherlands
- 12.1.6 Rest of Europe
- 13. Asia Pacific Acrylamide Monomer Market Analysis, Insights and Forecast, 2019-2031
- 13.1. Market Analysis, Insights and Forecast - By Country/Sub-region
- 13.1.1 China
- 13.1.2 Japan
- 13.1.3 India
- 13.1.4 South Korea
- 13.1.5 Taiwan
- 13.1.6 Australia
- 13.1.7 Rest of Asia-Pacific
- 14. South America Acrylamide Monomer Market Analysis, Insights and Forecast, 2019-2031
- 14.1. Market Analysis, Insights and Forecast - By Country/Sub-region
- 14.1.1 Brazil
- 14.1.2 Argentina
- 14.1.3 Rest of South America
- 15. MEA Acrylamide Monomer Market Analysis, Insights and Forecast, 2019-2031
- 15.1. Market Analysis, Insights and Forecast - By Country/Sub-region
- 15.1.1 Middle East
- 15.1.2 Africa
- 16. Competitive Analysis
- 16.1. Global Market Share Analysis 2024
- 16.2. Company Profiles
- 16.2.1 Ecolab
- 16.2.1.1. Overview
- 16.2.1.2. Products
- 16.2.1.3. SWOT Analysis
- 16.2.1.4. Recent Developments
- 16.2.1.5. Financials (Based on Availability)
- 16.2.2 Zibo Xinye Chemical Co Ltd
- 16.2.2.1. Overview
- 16.2.2.2. Products
- 16.2.2.3. SWOT Analysis
- 16.2.2.4. Recent Developments
- 16.2.2.5. Financials (Based on Availability)
- 16.2.3 Mitsui Chemical Inc
- 16.2.3.1. Overview
- 16.2.3.2. Products
- 16.2.3.3. SWOT Analysis
- 16.2.3.4. Recent Developments
- 16.2.3.5. Financials (Based on Availability)
- 16.2.4 Dia-Nitrix Co Ltd
- 16.2.4.1. Overview
- 16.2.4.2. Products
- 16.2.4.3. SWOT Analysis
- 16.2.4.4. Recent Developments
- 16.2.4.5. Financials (Based on Availability)
- 16.2.5 Ashland
- 16.2.5.1. Overview
- 16.2.5.2. Products
- 16.2.5.3. SWOT Analysis
- 16.2.5.4. Recent Developments
- 16.2.5.5. Financials (Based on Availability)
- 16.2.6 BASF SE
- 16.2.6.1. Overview
- 16.2.6.2. Products
- 16.2.6.3. SWOT Analysis
- 16.2.6.4. Recent Developments
- 16.2.6.5. Financials (Based on Availability)
- 16.2.7 AnHui JuCheng Fine Chemicals Co Ltd
- 16.2.7.1. Overview
- 16.2.7.2. Products
- 16.2.7.3. SWOT Analysis
- 16.2.7.4. Recent Developments
- 16.2.7.5. Financials (Based on Availability)
- 16.2.8 Jiangxi Changjiu Agrochemical Co Ltd
- 16.2.8.1. Overview
- 16.2.8.2. Products
- 16.2.8.3. SWOT Analysis
- 16.2.8.4. Recent Developments
- 16.2.8.5. Financials (Based on Availability)
- 16.2.9 Anhui Tianrun Chemicals
- 16.2.9.1. Overview
- 16.2.9.2. Products
- 16.2.9.3. SWOT Analysis
- 16.2.9.4. Recent Developments
- 16.2.9.5. Financials (Based on Availability)
- 16.2.10 Shandong Dongying Chemicals Co Ltd
- 16.2.10.1. Overview
- 16.2.10.2. Products
- 16.2.10.3. SWOT Analysis
- 16.2.10.4. Recent Developments
- 16.2.10.5. Financials (Based on Availability)
- 16.2.11 Beijing Hengju Chemical Group Corporation
- 16.2.11.1. Overview
- 16.2.11.2. Products
- 16.2.11.3. SWOT Analysis
- 16.2.11.4. Recent Developments
- 16.2.11.5. Financials (Based on Availability)
- 16.2.12 SNF Group
- 16.2.12.1. Overview
- 16.2.12.2. Products
- 16.2.12.3. SWOT Analysis
- 16.2.12.4. Recent Developments
- 16.2.12.5. Financials (Based on Availability)
- 16.2.1 Ecolab
List of Figures
- Figure 1: Global Acrylamide Monomer Market Revenue Breakdown (Billion, %) by Region 2024 & 2032
- Figure 2: Global Acrylamide Monomer Market Volume Breakdown (K Tons, %) by Region 2024 & 2032
- Figure 3: North America Acrylamide Monomer Market Revenue (Billion), by Country 2024 & 2032
- Figure 4: North America Acrylamide Monomer Market Volume (K Tons), by Country 2024 & 2032
- Figure 5: North America Acrylamide Monomer Market Revenue Share (%), by Country 2024 & 2032
- Figure 6: North America Acrylamide Monomer Market Volume Share (%), by Country 2024 & 2032
- Figure 7: Europe Acrylamide Monomer Market Revenue (Billion), by Country 2024 & 2032
- Figure 8: Europe Acrylamide Monomer Market Volume (K Tons), by Country 2024 & 2032
- Figure 9: Europe Acrylamide Monomer Market Revenue Share (%), by Country 2024 & 2032
- Figure 10: Europe Acrylamide Monomer Market Volume Share (%), by Country 2024 & 2032
- Figure 11: Asia Pacific Acrylamide Monomer Market Revenue (Billion), by Country 2024 & 2032
- Figure 12: Asia Pacific Acrylamide Monomer Market Volume (K Tons), by Country 2024 & 2032
- Figure 13: Asia Pacific Acrylamide Monomer Market Revenue Share (%), by Country 2024 & 2032
- Figure 14: Asia Pacific Acrylamide Monomer Market Volume Share (%), by Country 2024 & 2032
- Figure 15: South America Acrylamide Monomer Market Revenue (Billion), by Country 2024 & 2032
- Figure 16: South America Acrylamide Monomer Market Volume (K Tons), by Country 2024 & 2032
- Figure 17: South America Acrylamide Monomer Market Revenue Share (%), by Country 2024 & 2032
- Figure 18: South America Acrylamide Monomer Market Volume Share (%), by Country 2024 & 2032
- Figure 19: MEA Acrylamide Monomer Market Revenue (Billion), by Country 2024 & 2032
- Figure 20: MEA Acrylamide Monomer Market Volume (K Tons), by Country 2024 & 2032
- Figure 21: MEA Acrylamide Monomer Market Revenue Share (%), by Country 2024 & 2032
- Figure 22: MEA Acrylamide Monomer Market Volume Share (%), by Country 2024 & 2032
- Figure 23: Asia Pacific Acrylamide Monomer Market Revenue (Billion), by Application 2024 & 2032
- Figure 24: Asia Pacific Acrylamide Monomer Market Volume (K Tons), by Application 2024 & 2032
- Figure 25: Asia Pacific Acrylamide Monomer Market Revenue Share (%), by Application 2024 & 2032
- Figure 26: Asia Pacific Acrylamide Monomer Market Volume Share (%), by Application 2024 & 2032
- Figure 27: Asia Pacific Acrylamide Monomer Market Revenue (Billion), by Country 2024 & 2032
- Figure 28: Asia Pacific Acrylamide Monomer Market Volume (K Tons), by Country 2024 & 2032
- Figure 29: Asia Pacific Acrylamide Monomer Market Revenue Share (%), by Country 2024 & 2032
- Figure 30: Asia Pacific Acrylamide Monomer Market Volume Share (%), by Country 2024 & 2032
- Figure 31: North America Acrylamide Monomer Market Revenue (Billion), by Application 2024 & 2032
- Figure 32: North America Acrylamide Monomer Market Volume (K Tons), by Application 2024 & 2032
- Figure 33: North America Acrylamide Monomer Market Revenue Share (%), by Application 2024 & 2032
- Figure 34: North America Acrylamide Monomer Market Volume Share (%), by Application 2024 & 2032
- Figure 35: North America Acrylamide Monomer Market Revenue (Billion), by Country 2024 & 2032
- Figure 36: North America Acrylamide Monomer Market Volume (K Tons), by Country 2024 & 2032
- Figure 37: North America Acrylamide Monomer Market Revenue Share (%), by Country 2024 & 2032
- Figure 38: North America Acrylamide Monomer Market Volume Share (%), by Country 2024 & 2032
- Figure 39: Europe Acrylamide Monomer Market Revenue (Billion), by Application 2024 & 2032
- Figure 40: Europe Acrylamide Monomer Market Volume (K Tons), by Application 2024 & 2032
- Figure 41: Europe Acrylamide Monomer Market Revenue Share (%), by Application 2024 & 2032
- Figure 42: Europe Acrylamide Monomer Market Volume Share (%), by Application 2024 & 2032
- Figure 43: Europe Acrylamide Monomer Market Revenue (Billion), by Country 2024 & 2032
- Figure 44: Europe Acrylamide Monomer Market Volume (K Tons), by Country 2024 & 2032
- Figure 45: Europe Acrylamide Monomer Market Revenue Share (%), by Country 2024 & 2032
- Figure 46: Europe Acrylamide Monomer Market Volume Share (%), by Country 2024 & 2032
- Figure 47: South America Acrylamide Monomer Market Revenue (Billion), by Application 2024 & 2032
- Figure 48: South America Acrylamide Monomer Market Volume (K Tons), by Application 2024 & 2032
- Figure 49: South America Acrylamide Monomer Market Revenue Share (%), by Application 2024 & 2032
- Figure 50: South America Acrylamide Monomer Market Volume Share (%), by Application 2024 & 2032
- Figure 51: South America Acrylamide Monomer Market Revenue (Billion), by Country 2024 & 2032
- Figure 52: South America Acrylamide Monomer Market Volume (K Tons), by Country 2024 & 2032
- Figure 53: South America Acrylamide Monomer Market Revenue Share (%), by Country 2024 & 2032
- Figure 54: South America Acrylamide Monomer Market Volume Share (%), by Country 2024 & 2032
- Figure 55: Middle East and Africa Acrylamide Monomer Market Revenue (Billion), by Application 2024 & 2032
- Figure 56: Middle East and Africa Acrylamide Monomer Market Volume (K Tons), by Application 2024 & 2032
- Figure 57: Middle East and Africa Acrylamide Monomer Market Revenue Share (%), by Application 2024 & 2032
- Figure 58: Middle East and Africa Acrylamide Monomer Market Volume Share (%), by Application 2024 & 2032
- Figure 59: Middle East and Africa Acrylamide Monomer Market Revenue (Billion), by Country 2024 & 2032
- Figure 60: Middle East and Africa Acrylamide Monomer Market Volume (K Tons), by Country 2024 & 2032
- Figure 61: Middle East and Africa Acrylamide Monomer Market Revenue Share (%), by Country 2024 & 2032
- Figure 62: Middle East and Africa Acrylamide Monomer Market Volume Share (%), by Country 2024 & 2032
List of Tables
- Table 1: Global Acrylamide Monomer Market Revenue Billion Forecast, by Region 2019 & 2032
- Table 2: Global Acrylamide Monomer Market Volume K Tons Forecast, by Region 2019 & 2032
- Table 3: Global Acrylamide Monomer Market Revenue Billion Forecast, by Application 2019 & 2032
- Table 4: Global Acrylamide Monomer Market Volume K Tons Forecast, by Application 2019 & 2032
- Table 5: Global Acrylamide Monomer Market Revenue Billion Forecast, by Region 2019 & 2032
- Table 6: Global Acrylamide Monomer Market Volume K Tons Forecast, by Region 2019 & 2032
- Table 7: Global Acrylamide Monomer Market Revenue Billion Forecast, by Country 2019 & 2032
- Table 8: Global Acrylamide Monomer Market Volume K Tons Forecast, by Country 2019 & 2032
- Table 9: United States Acrylamide Monomer Market Revenue (Billion) Forecast, by Application 2019 & 2032
- Table 10: United States Acrylamide Monomer Market Volume (K Tons) Forecast, by Application 2019 & 2032
- Table 11: Canada Acrylamide Monomer Market Revenue (Billion) Forecast, by Application 2019 & 2032
- Table 12: Canada Acrylamide Monomer Market Volume (K Tons) Forecast, by Application 2019 & 2032
- Table 13: Mexico Acrylamide Monomer Market Revenue (Billion) Forecast, by Application 2019 & 2032
- Table 14: Mexico Acrylamide Monomer Market Volume (K Tons) Forecast, by Application 2019 & 2032
- Table 15: Global Acrylamide Monomer Market Revenue Billion Forecast, by Country 2019 & 2032
- Table 16: Global Acrylamide Monomer Market Volume K Tons Forecast, by Country 2019 & 2032
- Table 17: Germany Acrylamide Monomer Market Revenue (Billion) Forecast, by Application 2019 & 2032
- Table 18: Germany Acrylamide Monomer Market Volume (K Tons) Forecast, by Application 2019 & 2032
- Table 19: France Acrylamide Monomer Market Revenue (Billion) Forecast, by Application 2019 & 2032
- Table 20: France Acrylamide Monomer Market Volume (K Tons) Forecast, by Application 2019 & 2032
- Table 21: Italy Acrylamide Monomer Market Revenue (Billion) Forecast, by Application 2019 & 2032
- Table 22: Italy Acrylamide Monomer Market Volume (K Tons) Forecast, by Application 2019 & 2032
- Table 23: United Kingdom Acrylamide Monomer Market Revenue (Billion) Forecast, by Application 2019 & 2032
- Table 24: United Kingdom Acrylamide Monomer Market Volume (K Tons) Forecast, by Application 2019 & 2032
- Table 25: Netherlands Acrylamide Monomer Market Revenue (Billion) Forecast, by Application 2019 & 2032
- Table 26: Netherlands Acrylamide Monomer Market Volume (K Tons) Forecast, by Application 2019 & 2032
- Table 27: Rest of Europe Acrylamide Monomer Market Revenue (Billion) Forecast, by Application 2019 & 2032
- Table 28: Rest of Europe Acrylamide Monomer Market Volume (K Tons) Forecast, by Application 2019 & 2032
- Table 29: Global Acrylamide Monomer Market Revenue Billion Forecast, by Country 2019 & 2032
- Table 30: Global Acrylamide Monomer Market Volume K Tons Forecast, by Country 2019 & 2032
- Table 31: China Acrylamide Monomer Market Revenue (Billion) Forecast, by Application 2019 & 2032
- Table 32: China Acrylamide Monomer Market Volume (K Tons) Forecast, by Application 2019 & 2032
- Table 33: Japan Acrylamide Monomer Market Revenue (Billion) Forecast, by Application 2019 & 2032
- Table 34: Japan Acrylamide Monomer Market Volume (K Tons) Forecast, by Application 2019 & 2032
- Table 35: India Acrylamide Monomer Market Revenue (Billion) Forecast, by Application 2019 & 2032
- Table 36: India Acrylamide Monomer Market Volume (K Tons) Forecast, by Application 2019 & 2032
- Table 37: South Korea Acrylamide Monomer Market Revenue (Billion) Forecast, by Application 2019 & 2032
- Table 38: South Korea Acrylamide Monomer Market Volume (K Tons) Forecast, by Application 2019 & 2032
- Table 39: Taiwan Acrylamide Monomer Market Revenue (Billion) Forecast, by Application 2019 & 2032
- Table 40: Taiwan Acrylamide Monomer Market Volume (K Tons) Forecast, by Application 2019 & 2032
- Table 41: Australia Acrylamide Monomer Market Revenue (Billion) Forecast, by Application 2019 & 2032
- Table 42: Australia Acrylamide Monomer Market Volume (K Tons) Forecast, by Application 2019 & 2032
- Table 43: Rest of Asia-Pacific Acrylamide Monomer Market Revenue (Billion) Forecast, by Application 2019 & 2032
- Table 44: Rest of Asia-Pacific Acrylamide Monomer Market Volume (K Tons) Forecast, by Application 2019 & 2032
- Table 45: Global Acrylamide Monomer Market Revenue Billion Forecast, by Country 2019 & 2032
- Table 46: Global Acrylamide Monomer Market Volume K Tons Forecast, by Country 2019 & 2032
- Table 47: Brazil Acrylamide Monomer Market Revenue (Billion) Forecast, by Application 2019 & 2032
- Table 48: Brazil Acrylamide Monomer Market Volume (K Tons) Forecast, by Application 2019 & 2032
- Table 49: Argentina Acrylamide Monomer Market Revenue (Billion) Forecast, by Application 2019 & 2032
- Table 50: Argentina Acrylamide Monomer Market Volume (K Tons) Forecast, by Application 2019 & 2032
- Table 51: Rest of South America Acrylamide Monomer Market Revenue (Billion) Forecast, by Application 2019 & 2032
- Table 52: Rest of South America Acrylamide Monomer Market Volume (K Tons) Forecast, by Application 2019 & 2032
- Table 53: Global Acrylamide Monomer Market Revenue Billion Forecast, by Country 2019 & 2032
- Table 54: Global Acrylamide Monomer Market Volume K Tons Forecast, by Country 2019 & 2032
- Table 55: Middle East Acrylamide Monomer Market Revenue (Billion) Forecast, by Application 2019 & 2032
- Table 56: Middle East Acrylamide Monomer Market Volume (K Tons) Forecast, by Application 2019 & 2032
- Table 57: Africa Acrylamide Monomer Market Revenue (Billion) Forecast, by Application 2019 & 2032
- Table 58: Africa Acrylamide Monomer Market Volume (K Tons) Forecast, by Application 2019 & 2032
- Table 59: Global Acrylamide Monomer Market Revenue Billion Forecast, by Application 2019 & 2032
- Table 60: Global Acrylamide Monomer Market Volume K Tons Forecast, by Application 2019 & 2032
- Table 61: Global Acrylamide Monomer Market Revenue Billion Forecast, by Country 2019 & 2032
- Table 62: Global Acrylamide Monomer Market Volume K Tons Forecast, by Country 2019 & 2032
- Table 63: China Acrylamide Monomer Market Revenue (Billion) Forecast, by Application 2019 & 2032
- Table 64: China Acrylamide Monomer Market Volume (K Tons) Forecast, by Application 2019 & 2032
- Table 65: India Acrylamide Monomer Market Revenue (Billion) Forecast, by Application 2019 & 2032
- Table 66: India Acrylamide Monomer Market Volume (K Tons) Forecast, by Application 2019 & 2032
- Table 67: Japan Acrylamide Monomer Market Revenue (Billion) Forecast, by Application 2019 & 2032
- Table 68: Japan Acrylamide Monomer Market Volume (K Tons) Forecast, by Application 2019 & 2032
- Table 69: South Korea Acrylamide Monomer Market Revenue (Billion) Forecast, by Application 2019 & 2032
- Table 70: South Korea Acrylamide Monomer Market Volume (K Tons) Forecast, by Application 2019 & 2032
- Table 71: Thailand Acrylamide Monomer Market Revenue (Billion) Forecast, by Application 2019 & 2032
- Table 72: Thailand Acrylamide Monomer Market Volume (K Tons) Forecast, by Application 2019 & 2032
- Table 73: Indoneisa Acrylamide Monomer Market Revenue (Billion) Forecast, by Application 2019 & 2032
- Table 74: Indoneisa Acrylamide Monomer Market Volume (K Tons) Forecast, by Application 2019 & 2032
- Table 75: Vietnam Acrylamide Monomer Market Revenue (Billion) Forecast, by Application 2019 & 2032
- Table 76: Vietnam Acrylamide Monomer Market Volume (K Tons) Forecast, by Application 2019 & 2032
- Table 77: Malaysia Acrylamide Monomer Market Revenue (Billion) Forecast, by Application 2019 & 2032
- Table 78: Malaysia Acrylamide Monomer Market Volume (K Tons) Forecast, by Application 2019 & 2032
- Table 79: Rest of Asia Pacific Acrylamide Monomer Market Revenue (Billion) Forecast, by Application 2019 & 2032
- Table 80: Rest of Asia Pacific Acrylamide Monomer Market Volume (K Tons) Forecast, by Application 2019 & 2032
- Table 81: Global Acrylamide Monomer Market Revenue Billion Forecast, by Application 2019 & 2032
- Table 82: Global Acrylamide Monomer Market Volume K Tons Forecast, by Application 2019 & 2032
- Table 83: Global Acrylamide Monomer Market Revenue Billion Forecast, by Country 2019 & 2032
- Table 84: Global Acrylamide Monomer Market Volume K Tons Forecast, by Country 2019 & 2032
- Table 85: United States Acrylamide Monomer Market Revenue (Billion) Forecast, by Application 2019 & 2032
- Table 86: United States Acrylamide Monomer Market Volume (K Tons) Forecast, by Application 2019 & 2032
- Table 87: Canada Acrylamide Monomer Market Revenue (Billion) Forecast, by Application 2019 & 2032
- Table 88: Canada Acrylamide Monomer Market Volume (K Tons) Forecast, by Application 2019 & 2032
- Table 89: Mexico Acrylamide Monomer Market Revenue (Billion) Forecast, by Application 2019 & 2032
- Table 90: Mexico Acrylamide Monomer Market Volume (K Tons) Forecast, by Application 2019 & 2032
- Table 91: Global Acrylamide Monomer Market Revenue Billion Forecast, by Application 2019 & 2032
- Table 92: Global Acrylamide Monomer Market Volume K Tons Forecast, by Application 2019 & 2032
- Table 93: Global Acrylamide Monomer Market Revenue Billion Forecast, by Country 2019 & 2032
- Table 94: Global Acrylamide Monomer Market Volume K Tons Forecast, by Country 2019 & 2032
- Table 95: Germany Acrylamide Monomer Market Revenue (Billion) Forecast, by Application 2019 & 2032
- Table 96: Germany Acrylamide Monomer Market Volume (K Tons) Forecast, by Application 2019 & 2032
- Table 97: United Kingdom Acrylamide Monomer Market Revenue (Billion) Forecast, by Application 2019 & 2032
- Table 98: United Kingdom Acrylamide Monomer Market Volume (K Tons) Forecast, by Application 2019 & 2032
- Table 99: France Acrylamide Monomer Market Revenue (Billion) Forecast, by Application 2019 & 2032
- Table 100: France Acrylamide Monomer Market Volume (K Tons) Forecast, by Application 2019 & 2032
- Table 101: Italy Acrylamide Monomer Market Revenue (Billion) Forecast, by Application 2019 & 2032
- Table 102: Italy Acrylamide Monomer Market Volume (K Tons) Forecast, by Application 2019 & 2032
- Table 103: Spain Acrylamide Monomer Market Revenue (Billion) Forecast, by Application 2019 & 2032
- Table 104: Spain Acrylamide Monomer Market Volume (K Tons) Forecast, by Application 2019 & 2032
- Table 105: NORDIC Acrylamide Monomer Market Revenue (Billion) Forecast, by Application 2019 & 2032
- Table 106: NORDIC Acrylamide Monomer Market Volume (K Tons) Forecast, by Application 2019 & 2032
- Table 107: Russia Acrylamide Monomer Market Revenue (Billion) Forecast, by Application 2019 & 2032
- Table 108: Russia Acrylamide Monomer Market Volume (K Tons) Forecast, by Application 2019 & 2032
- Table 109: Turkey Acrylamide Monomer Market Revenue (Billion) Forecast, by Application 2019 & 2032
- Table 110: Turkey Acrylamide Monomer Market Volume (K Tons) Forecast, by Application 2019 & 2032
- Table 111: Rest of Europe Acrylamide Monomer Market Revenue (Billion) Forecast, by Application 2019 & 2032
- Table 112: Rest of Europe Acrylamide Monomer Market Volume (K Tons) Forecast, by Application 2019 & 2032
- Table 113: Global Acrylamide Monomer Market Revenue Billion Forecast, by Application 2019 & 2032
- Table 114: Global Acrylamide Monomer Market Volume K Tons Forecast, by Application 2019 & 2032
- Table 115: Global Acrylamide Monomer Market Revenue Billion Forecast, by Country 2019 & 2032
- Table 116: Global Acrylamide Monomer Market Volume K Tons Forecast, by Country 2019 & 2032
- Table 117: Brazil Acrylamide Monomer Market Revenue (Billion) Forecast, by Application 2019 & 2032
- Table 118: Brazil Acrylamide Monomer Market Volume (K Tons) Forecast, by Application 2019 & 2032
- Table 119: Argentina Acrylamide Monomer Market Revenue (Billion) Forecast, by Application 2019 & 2032
- Table 120: Argentina Acrylamide Monomer Market Volume (K Tons) Forecast, by Application 2019 & 2032
- Table 121: Colombia Acrylamide Monomer Market Revenue (Billion) Forecast, by Application 2019 & 2032
- Table 122: Colombia Acrylamide Monomer Market Volume (K Tons) Forecast, by Application 2019 & 2032
- Table 123: Rest of South America Acrylamide Monomer Market Revenue (Billion) Forecast, by Application 2019 & 2032
- Table 124: Rest of South America Acrylamide Monomer Market Volume (K Tons) Forecast, by Application 2019 & 2032
- Table 125: Global Acrylamide Monomer Market Revenue Billion Forecast, by Application 2019 & 2032
- Table 126: Global Acrylamide Monomer Market Volume K Tons Forecast, by Application 2019 & 2032
- Table 127: Global Acrylamide Monomer Market Revenue Billion Forecast, by Country 2019 & 2032
- Table 128: Global Acrylamide Monomer Market Volume K Tons Forecast, by Country 2019 & 2032
- Table 129: Saudi Arabia Acrylamide Monomer Market Revenue (Billion) Forecast, by Application 2019 & 2032
- Table 130: Saudi Arabia Acrylamide Monomer Market Volume (K Tons) Forecast, by Application 2019 & 2032
- Table 131: South Africa Acrylamide Monomer Market Revenue (Billion) Forecast, by Application 2019 & 2032
- Table 132: South Africa Acrylamide Monomer Market Volume (K Tons) Forecast, by Application 2019 & 2032
- Table 133: United Arab Emirates Acrylamide Monomer Market Revenue (Billion) Forecast, by Application 2019 & 2032
- Table 134: United Arab Emirates Acrylamide Monomer Market Volume (K Tons) Forecast, by Application 2019 & 2032
- Table 135: Egypt Acrylamide Monomer Market Revenue (Billion) Forecast, by Application 2019 & 2032
- Table 136: Egypt Acrylamide Monomer Market Volume (K Tons) Forecast, by Application 2019 & 2032
- Table 137: Nigeria Acrylamide Monomer Market Revenue (Billion) Forecast, by Application 2019 & 2032
- Table 138: Nigeria Acrylamide Monomer Market Volume (K Tons) Forecast, by Application 2019 & 2032
- Table 139: Qatar Acrylamide Monomer Market Revenue (Billion) Forecast, by Application 2019 & 2032
- Table 140: Qatar Acrylamide Monomer Market Volume (K Tons) Forecast, by Application 2019 & 2032
- Table 141: Rest of Middle East and Africa Acrylamide Monomer Market Revenue (Billion) Forecast, by Application 2019 & 2032
- Table 142: Rest of Middle East and Africa Acrylamide Monomer Market Volume (K Tons) Forecast, by Application 2019 & 2032
Frequently Asked Questions
1. What is the projected Compound Annual Growth Rate (CAGR) of the Acrylamide Monomer Market?
The projected CAGR is approximately 8.3%.
2. Which companies are prominent players in the Acrylamide Monomer Market?
Key companies in the market include Ecolab, Zibo Xinye Chemical Co Ltd, Mitsui Chemical Inc, Dia-Nitrix Co Ltd, Ashland, BASF SE, AnHui JuCheng Fine Chemicals Co Ltd, Jiangxi Changjiu Agrochemical Co Ltd, Anhui Tianrun Chemicals, Shandong Dongying Chemicals Co Ltd, Beijing Hengju Chemical Group Corporation, SNF Group.
3. What are the main segments of the Acrylamide Monomer Market?
The market segments include Application.
4. Can you provide details about the market size?
The market size is estimated to be USD 4.7 Billion as of 2022.
5. What are some drivers contributing to market growth?
Rising Use for Enhanced Oil Recovery in Petroleum Industry; Increased Demand from Paper Mills.
6. What are the notable trends driving market growth?
Water Treatment Application to Dominate the Market.
7. Are there any restraints impacting market growth?
Strigent Regulations towards the Usage of Acrylamide owing to its Toxicity; Other Restraints.
8. Can you provide examples of recent developments in the market?
August 2023: Mitsui Chemicals Inc. announced that Polaris Chemicals Inc. had begun production of biocatalysts used in the production of acrylamide.
9. What pricing options are available for accessing the report?
Pricing options include single-user, multi-user, and enterprise licenses priced at USD 4750, USD 5250, and USD 8750 respectively.
10. Is the market size provided in terms of value or volume?
The market size is provided in terms of value, measured in Billion and volume, measured in K Tons.
11. Are there any specific market keywords associated with the report?
Yes, the market keyword associated with the report is "Acrylamide Monomer Market," which aids in identifying and referencing the specific market segment covered.
12. How do I determine which pricing option suits my needs best?
The pricing options vary based on user requirements and access needs. Individual users may opt for single-user licenses, while businesses requiring broader access may choose multi-user or enterprise licenses for cost-effective access to the report.
13. Are there any additional resources or data provided in the Acrylamide Monomer Market report?
While the report offers comprehensive insights, it's advisable to review the specific contents or supplementary materials provided to ascertain if additional resources or data are available.
14. How can I stay updated on further developments or reports in the Acrylamide Monomer Market?
To stay informed about further developments, trends, and reports in the Acrylamide Monomer Market, consider subscribing to industry newsletters, following relevant companies and organizations, or regularly checking reputable industry news sources and publications.
Methodology
Step 1 - Identification of Relevant Samples Size from Population Database


Step 2 - Approaches for Defining Global Market Size (Value, Volume* & Price*)

Note*: In applicable scenarios
Step 3 - Data Sources
Primary Research
- Web Analytics
- Survey Reports
- Research Institute
- Latest Research Reports
- Opinion Leaders
Secondary Research
- Annual Reports
- White Paper
- Latest Press Release
- Industry Association
- Paid Database
- Investor Presentations

Step 4 - Data Triangulation
Involves using different sources of information in order to increase the validity of a study
These sources are likely to be stakeholders in a program - participants, other researchers, program staff, other community members, and so on.
Then we put all data in single framework & apply various statistical tools to find out the dynamic on the market.
During the analysis stage, feedback from the stakeholder groups would be compared to determine areas of agreement as well as areas of divergence


