
Key Insights
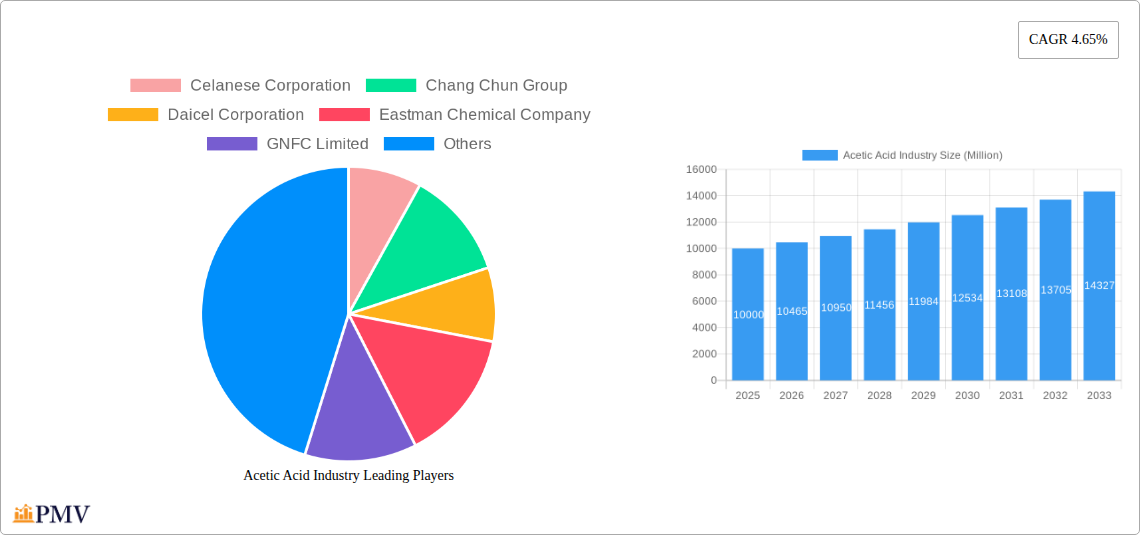
The global acetic acid market, valued at approximately $10 billion in 2025, is projected to experience robust growth, driven by increasing demand from key applications such as the production of vinyl acetate monomer (VAM), which is crucial for adhesives, paints, and coatings. The rising construction and automotive industries significantly fuel this demand. Furthermore, the growing use of acetic acid in the food and beverage industries as a preservative and acidulant, alongside its use in the pharmaceutical sector, contributes to market expansion. A compound annual growth rate (CAGR) of 4.65% from 2025 to 2033 indicates a steady trajectory of growth. This growth, however, faces some restraints, primarily including fluctuations in crude oil prices (a key feedstock for acetic acid production) and stringent environmental regulations concerning emissions. The market is segmented by application (VAM, PTA, others), geographic region (North America, Europe, Asia-Pacific, etc.), and production method (e.g., methanol carbonylation, oxidation of acetaldehyde). Leading companies like Celanese Corporation, Eastman Chemical Company, and others, are leveraging technological advancements and strategic collaborations to enhance production efficiency and expand their market share. The competitive landscape is characterized by both large multinational corporations and regional players.
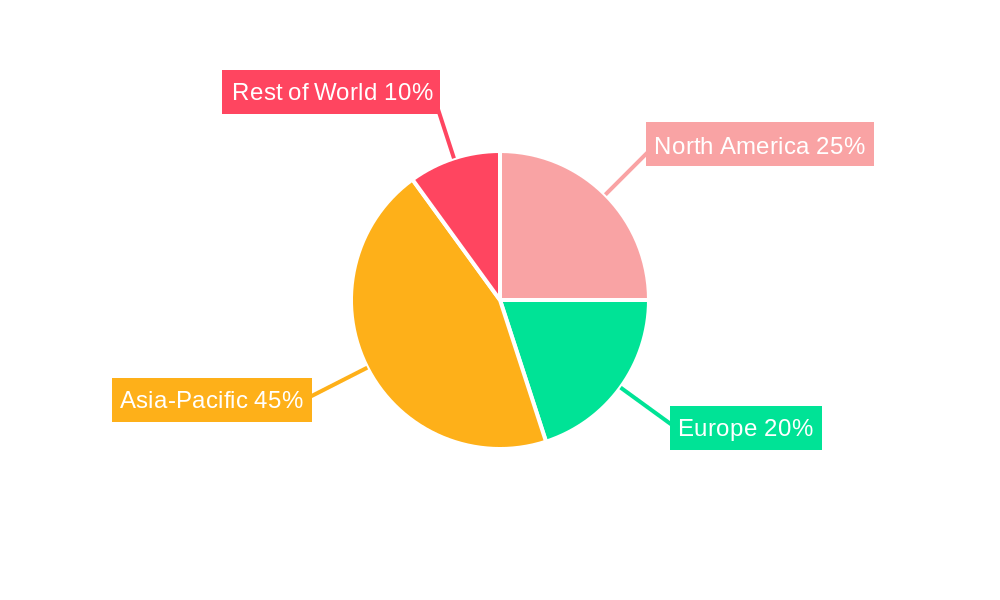
The Asia-Pacific region is expected to dominate the market due to its significant industrial growth, particularly in countries like China and India. Growth in these regions is further fueled by rising disposable incomes and increasing urbanization, leading to higher demand for products that utilize acetic acid. Europe and North America, while exhibiting mature markets, still contribute substantially to global demand, mainly driven by established industrial sectors and technological advancements in acetic acid production and applications. Companies are focusing on sustainable production methods and expanding their product portfolios to cater to evolving market needs and stringent environmental regulations. The long-term outlook for the acetic acid market remains positive, with continuous innovation and expansion in application areas expected to drive continued growth throughout the forecast period.
Acetic Acid Industry: A Comprehensive Market Report (2019-2033)
This in-depth report provides a comprehensive analysis of the global acetic acid industry, offering valuable insights for stakeholders seeking to navigate this dynamic market. Covering the period from 2019 to 2033, with a base year of 2025, this report projects future trends and identifies key opportunities for growth and investment. The study encompasses market sizing, segmentation, competitive dynamics, technological advancements, and regulatory landscapes. With a focus on actionable intelligence, this report is essential for strategic decision-making within the acetic acid sector.
Acetic Acid Industry Market Structure & Competitive Dynamics
The global acetic acid market is characterized by a moderately concentrated structure, with several major players holding significant market share. Celanese Corporation, Eastman Chemical Company, and Ineos are among the leading producers, collectively accounting for an estimated xx% of global production in 2024. The industry's competitive landscape is dynamic, influenced by factors such as technological innovation, capacity expansions, and mergers and acquisitions (M&A) activities.
- Market Concentration: The top five players command approximately xx% of the market share.
- Innovation Ecosystems: Significant R&D investments are driving process improvements and the development of new applications.
- Regulatory Frameworks: Environmental regulations, particularly concerning emissions and waste management, play a significant role in shaping industry practices. Stringent regulations in some regions are driving the adoption of cleaner production technologies.
- Product Substitutes: Limited direct substitutes exist for acetic acid in its primary applications, although some bio-based alternatives are emerging.
- End-User Trends: Demand is largely driven by the growth of key end-use sectors such as VAM, PTA, and vinyl acetate. Shifts in these sectors influence the overall demand for acetic acid.
- M&A Activities: The past five years have witnessed several significant M&A deals, totaling an estimated USD xx Million, primarily focused on consolidating production capacities and expanding geographic reach. Examples include (but are not limited to) [Insert specific examples of M&A activity with deal values if available. Otherwise, state "Specific deal details are commercially sensitive and unavailable for public disclosure"].
Acetic Acid Industry Trends & Insights
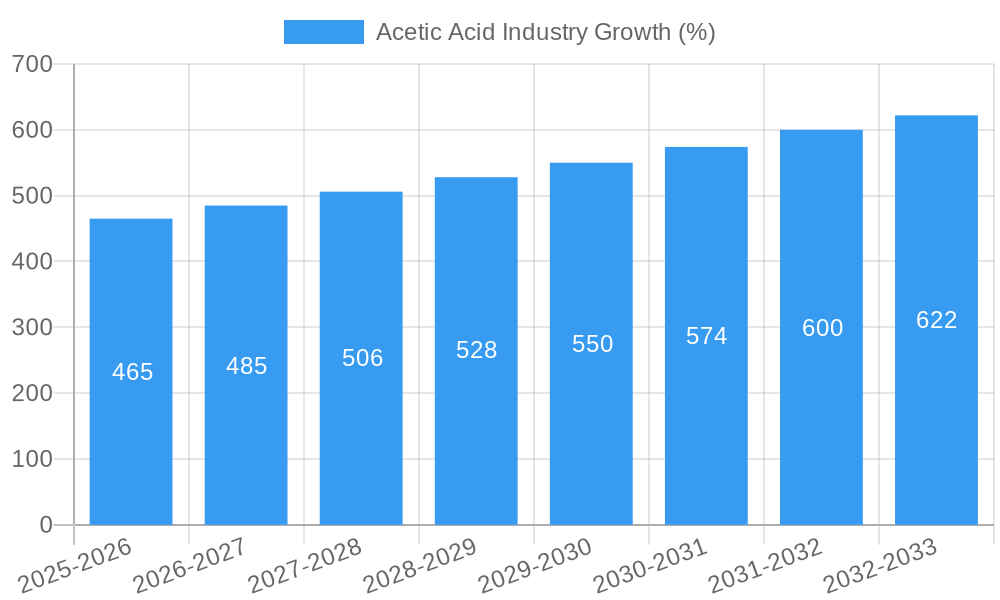
The global acetic acid market is expected to witness a Compound Annual Growth Rate (CAGR) of xx% during the forecast period (2025-2033), driven by factors such as increasing demand from key downstream industries and ongoing capacity expansions by major players. Technological advancements, such as the adoption of more efficient production processes and the integration of renewable feedstocks, are also contributing to market growth. However, price fluctuations and regulatory pressures pose challenges to sustained growth. Market penetration of bio-based acetic acid remains limited, but it is gradually increasing, driven by sustainability concerns and governmental incentives.
Dominant Markets & Segments in Acetic Acid Industry
Asia-Pacific, particularly China, holds the dominant position in the global acetic acid market, accounting for approximately xx% of global consumption in 2024. This dominance is attributed to several factors:
- Key Drivers:
- Rapid industrialization and economic growth.
- Significant investments in petrochemical infrastructure.
- Favorable government policies supporting the chemical industry.
- Large-scale production facilities.
- Dominance Analysis: China's robust manufacturing sector, particularly its textile and packaging industries, fuels the high demand for acetic acid. The region also benefits from a well-established supply chain and cost-competitive production capabilities. Other key regions include North America and Europe, exhibiting significant consumption although at a lower rate than Asia Pacific.
Acetic Acid Industry Product Innovations
Recent product innovations focus on enhancing production efficiency, reducing environmental impact, and exploring new applications. Companies are actively investing in technologies like carbon capture and utilization (CCU) to minimize greenhouse gas emissions. The development of bio-based acetic acid is gaining traction, driven by rising sustainability concerns and government support. The integration of renewable feedstocks, and the development of high purity grades for specific applications are crucial areas of focus.
Report Segmentation & Scope
This report segments the acetic acid market based on various factors, including:
- By Product Type: Glacial acetic acid, dilute acetic acid, other types (provide further details if available)
- By Application: VAM (Vinyl Acetate Monomer), PTA (Purified Terephthalic Acid), other applications (provide further details if available)
- By Region: North America, Europe, Asia-Pacific, Middle East & Africa, South America.
Each segment's analysis includes growth projections, market size estimates, competitive landscapes, and key trends.
Key Drivers of Acetic Acid Industry Growth
Several factors are driving the growth of the acetic acid industry:
- Rising demand from downstream industries: The growth of VAM and PTA sectors are major contributors.
- Capacity expansions by major players: Significant investments are boosting global production capacity.
- Technological advancements: Improved production processes and the adoption of renewable feedstocks enhance efficiency and sustainability.
- Favorable government policies: In certain regions, supportive policies stimulate industry growth.
Challenges in the Acetic Acid Industry Sector
The acetic acid industry faces various challenges:
- Price volatility: Fluctuations in raw material prices and energy costs impact profitability.
- Stringent environmental regulations: Compliance with emission standards necessitates investments in cleaner technologies.
- Intense competition: A competitive landscape with numerous established players creates pricing pressures.
- Supply chain disruptions: Geopolitical events and unforeseen circumstances can disrupt supply chains and increase production costs.
Leading Players in the Acetic Acid Industry Market
- Celanese Corporation
- Chang Chun Group
- Daicel Corporation
- Eastman Chemical Company
- GNFC Limited
- INEOS
- Jiangsu SOPO (Group) Co Ltd
- Kingboard Holdings Limited
- LyondellBasell Industries Holdings BV
- Mitsubishi Chemical Corporation
- PetroChina Company Limited
- Sabic
- Shandong Hualu-Hengsheng Chemical Co Ltd
- Shanghai Huayi Holding Group Co Ltd
- Sipchem Company
- Svensk Etanolkemi AB (SEKAB)
- Tanfac Industries Ltd
- Yankuang Group
*List Not Exhaustive
Key Developments in Acetic Acid Industry Sector
- June 2022: Hebei Kingboard Energy Development Co., Ltd. commenced construction of a 29,80 Million tons per year acetic acid facility, a USD 3.6 Billion project incorporating a 35.20 Million tons/year carbon capture and recycling project. This signifies a major investment towards carbon neutrality in the sector.
- January 2023: Kingboard Holdings Limited submitted the "Environmental Impact Report of Hebei Kingboard Energy Development Co., Ltd. Acetic Acid Expansion and Transformation Project" for approval, highlighting a focus on environmental sustainability within industry expansion plans.
Strategic Acetic Acid Industry Market Outlook
The acetic acid market presents significant growth potential, driven by ongoing industrialization, expanding downstream applications, and a focus on sustainability. Strategic opportunities exist for companies investing in advanced technologies, optimizing supply chains, and catering to the rising demand for bio-based and high-purity acetic acid. The long-term outlook is positive, particularly in emerging economies where industrial growth is strong. Further consolidation and strategic alliances are anticipated within the industry.
Acetic Acid Industry Segmentation
-
1. Derivative
- 1.1. Vinyl Acetate Monomer (VAM)
- 1.2. Purified Terephthalic Acid (PTA)
- 1.3. Ethyl Acetate
- 1.4. Acetic Anhydride
- 1.5. Other Derivatives
-
2. Application
- 2.1. Plastics and Polymers
- 2.2. Food and Beverage
- 2.3. Adhesives, Paints, and Coatings
- 2.4. Textile
- 2.5. Medical
- 2.6. Other Applications
Acetic Acid Industry Segmentation By Geography
-
1. Asia Pacific
- 1.1. China
- 1.2. India
- 1.3. Japan
- 1.4. South Korea
- 1.5. Rest of Asia Pacific
-
2. North America
- 2.1. United States
- 2.2. Canada
- 2.3. Mexico
-
3. Europe
- 3.1. Germany
- 3.2. United Kingdom
- 3.3. Italy
- 3.4. France
- 3.5. Rest of Europe
-
4. South America
- 4.1. Brazil
- 4.2. Argentina
- 4.3. Rest of South America
-
5. Middle East and Africa
- 5.1. Saudi Arabia
- 5.2. South Africa
- 5.3. Rest of Middle East and Africa
Acetic Acid Industry REPORT HIGHLIGHTS
| Aspects | Details |
|---|---|
| Study Period | 2019-2033 |
| Base Year | 2024 |
| Estimated Year | 2025 |
| Forecast Period | 2025-2033 |
| Historical Period | 2019-2024 |
| Growth Rate | CAGR of 4.65% from 2019-2033 |
| Segmentation |
|
Table of Contents
- 1. Introduction
- 1.1. Research Scope
- 1.2. Market Segmentation
- 1.3. Research Methodology
- 1.4. Definitions and Assumptions
- 2. Executive Summary
- 2.1. Introduction
- 3. Market Dynamics
- 3.1. Introduction
- 3.2. Market Drivers
- 3.2.1. Increasing Demand for Vinyl Acetate Monomer (VAM); Increasing Demand from the Textile and Packaging Industry; Increasing Use of Ester Solvents in the Paints and Coating Industry
- 3.3. Market Restrains
- 3.3.1. Increasing Demand for Vinyl Acetate Monomer (VAM); Increasing Demand from the Textile and Packaging Industry; Increasing Use of Ester Solvents in the Paints and Coating Industry
- 3.4. Market Trends
- 3.4.1 Increasing Applications in the Adhesives
- 3.4.2 Paints
- 3.4.3 and Coatings Industry
- 4. Market Factor Analysis
- 4.1. Porters Five Forces
- 4.2. Supply/Value Chain
- 4.3. PESTEL analysis
- 4.4. Market Entropy
- 4.5. Patent/Trademark Analysis
- 5. Global Acetic Acid Industry Analysis, Insights and Forecast, 2019-2031
- 5.1. Market Analysis, Insights and Forecast - by Derivative
- 5.1.1. Vinyl Acetate Monomer (VAM)
- 5.1.2. Purified Terephthalic Acid (PTA)
- 5.1.3. Ethyl Acetate
- 5.1.4. Acetic Anhydride
- 5.1.5. Other Derivatives
- 5.2. Market Analysis, Insights and Forecast - by Application
- 5.2.1. Plastics and Polymers
- 5.2.2. Food and Beverage
- 5.2.3. Adhesives, Paints, and Coatings
- 5.2.4. Textile
- 5.2.5. Medical
- 5.2.6. Other Applications
- 5.3. Market Analysis, Insights and Forecast - by Region
- 5.3.1. Asia Pacific
- 5.3.2. North America
- 5.3.3. Europe
- 5.3.4. South America
- 5.3.5. Middle East and Africa
- 5.1. Market Analysis, Insights and Forecast - by Derivative
- 6. Asia Pacific Acetic Acid Industry Analysis, Insights and Forecast, 2019-2031
- 6.1. Market Analysis, Insights and Forecast - by Derivative
- 6.1.1. Vinyl Acetate Monomer (VAM)
- 6.1.2. Purified Terephthalic Acid (PTA)
- 6.1.3. Ethyl Acetate
- 6.1.4. Acetic Anhydride
- 6.1.5. Other Derivatives
- 6.2. Market Analysis, Insights and Forecast - by Application
- 6.2.1. Plastics and Polymers
- 6.2.2. Food and Beverage
- 6.2.3. Adhesives, Paints, and Coatings
- 6.2.4. Textile
- 6.2.5. Medical
- 6.2.6. Other Applications
- 6.1. Market Analysis, Insights and Forecast - by Derivative
- 7. North America Acetic Acid Industry Analysis, Insights and Forecast, 2019-2031
- 7.1. Market Analysis, Insights and Forecast - by Derivative
- 7.1.1. Vinyl Acetate Monomer (VAM)
- 7.1.2. Purified Terephthalic Acid (PTA)
- 7.1.3. Ethyl Acetate
- 7.1.4. Acetic Anhydride
- 7.1.5. Other Derivatives
- 7.2. Market Analysis, Insights and Forecast - by Application
- 7.2.1. Plastics and Polymers
- 7.2.2. Food and Beverage
- 7.2.3. Adhesives, Paints, and Coatings
- 7.2.4. Textile
- 7.2.5. Medical
- 7.2.6. Other Applications
- 7.1. Market Analysis, Insights and Forecast - by Derivative
- 8. Europe Acetic Acid Industry Analysis, Insights and Forecast, 2019-2031
- 8.1. Market Analysis, Insights and Forecast - by Derivative
- 8.1.1. Vinyl Acetate Monomer (VAM)
- 8.1.2. Purified Terephthalic Acid (PTA)
- 8.1.3. Ethyl Acetate
- 8.1.4. Acetic Anhydride
- 8.1.5. Other Derivatives
- 8.2. Market Analysis, Insights and Forecast - by Application
- 8.2.1. Plastics and Polymers
- 8.2.2. Food and Beverage
- 8.2.3. Adhesives, Paints, and Coatings
- 8.2.4. Textile
- 8.2.5. Medical
- 8.2.6. Other Applications
- 8.1. Market Analysis, Insights and Forecast - by Derivative
- 9. South America Acetic Acid Industry Analysis, Insights and Forecast, 2019-2031
- 9.1. Market Analysis, Insights and Forecast - by Derivative
- 9.1.1. Vinyl Acetate Monomer (VAM)
- 9.1.2. Purified Terephthalic Acid (PTA)
- 9.1.3. Ethyl Acetate
- 9.1.4. Acetic Anhydride
- 9.1.5. Other Derivatives
- 9.2. Market Analysis, Insights and Forecast - by Application
- 9.2.1. Plastics and Polymers
- 9.2.2. Food and Beverage
- 9.2.3. Adhesives, Paints, and Coatings
- 9.2.4. Textile
- 9.2.5. Medical
- 9.2.6. Other Applications
- 9.1. Market Analysis, Insights and Forecast - by Derivative
- 10. Middle East and Africa Acetic Acid Industry Analysis, Insights and Forecast, 2019-2031
- 10.1. Market Analysis, Insights and Forecast - by Derivative
- 10.1.1. Vinyl Acetate Monomer (VAM)
- 10.1.2. Purified Terephthalic Acid (PTA)
- 10.1.3. Ethyl Acetate
- 10.1.4. Acetic Anhydride
- 10.1.5. Other Derivatives
- 10.2. Market Analysis, Insights and Forecast - by Application
- 10.2.1. Plastics and Polymers
- 10.2.2. Food and Beverage
- 10.2.3. Adhesives, Paints, and Coatings
- 10.2.4. Textile
- 10.2.5. Medical
- 10.2.6. Other Applications
- 10.1. Market Analysis, Insights and Forecast - by Derivative
- 11. Competitive Analysis
- 11.1. Global Market Share Analysis 2024
- 11.2. Company Profiles
- 11.2.1 Celanese Corporation
- 11.2.1.1. Overview
- 11.2.1.2. Products
- 11.2.1.3. SWOT Analysis
- 11.2.1.4. Recent Developments
- 11.2.1.5. Financials (Based on Availability)
- 11.2.2 Chang Chun Group
- 11.2.2.1. Overview
- 11.2.2.2. Products
- 11.2.2.3. SWOT Analysis
- 11.2.2.4. Recent Developments
- 11.2.2.5. Financials (Based on Availability)
- 11.2.3 Daicel Corporation
- 11.2.3.1. Overview
- 11.2.3.2. Products
- 11.2.3.3. SWOT Analysis
- 11.2.3.4. Recent Developments
- 11.2.3.5. Financials (Based on Availability)
- 11.2.4 Eastman Chemical Company
- 11.2.4.1. Overview
- 11.2.4.2. Products
- 11.2.4.3. SWOT Analysis
- 11.2.4.4. Recent Developments
- 11.2.4.5. Financials (Based on Availability)
- 11.2.5 GNFC Limited
- 11.2.5.1. Overview
- 11.2.5.2. Products
- 11.2.5.3. SWOT Analysis
- 11.2.5.4. Recent Developments
- 11.2.5.5. Financials (Based on Availability)
- 11.2.6 INEOS
- 11.2.6.1. Overview
- 11.2.6.2. Products
- 11.2.6.3. SWOT Analysis
- 11.2.6.4. Recent Developments
- 11.2.6.5. Financials (Based on Availability)
- 11.2.7 Jiangsu SOPO (Group) Co Ltd
- 11.2.7.1. Overview
- 11.2.7.2. Products
- 11.2.7.3. SWOT Analysis
- 11.2.7.4. Recent Developments
- 11.2.7.5. Financials (Based on Availability)
- 11.2.8 Kingboard Holdings Limited
- 11.2.8.1. Overview
- 11.2.8.2. Products
- 11.2.8.3. SWOT Analysis
- 11.2.8.4. Recent Developments
- 11.2.8.5. Financials (Based on Availability)
- 11.2.9 LyondellBasell Industries Holdings BV
- 11.2.9.1. Overview
- 11.2.9.2. Products
- 11.2.9.3. SWOT Analysis
- 11.2.9.4. Recent Developments
- 11.2.9.5. Financials (Based on Availability)
- 11.2.10 Mitsubishi Chemical Corporation
- 11.2.10.1. Overview
- 11.2.10.2. Products
- 11.2.10.3. SWOT Analysis
- 11.2.10.4. Recent Developments
- 11.2.10.5. Financials (Based on Availability)
- 11.2.11 PetroChina Company Limited
- 11.2.11.1. Overview
- 11.2.11.2. Products
- 11.2.11.3. SWOT Analysis
- 11.2.11.4. Recent Developments
- 11.2.11.5. Financials (Based on Availability)
- 11.2.12 Sabic
- 11.2.12.1. Overview
- 11.2.12.2. Products
- 11.2.12.3. SWOT Analysis
- 11.2.12.4. Recent Developments
- 11.2.12.5. Financials (Based on Availability)
- 11.2.13 Shandong Hualu-Hengsheng Chemical Co Ltd
- 11.2.13.1. Overview
- 11.2.13.2. Products
- 11.2.13.3. SWOT Analysis
- 11.2.13.4. Recent Developments
- 11.2.13.5. Financials (Based on Availability)
- 11.2.14 Shanghai Huayi Holding Group Co Ltd
- 11.2.14.1. Overview
- 11.2.14.2. Products
- 11.2.14.3. SWOT Analysis
- 11.2.14.4. Recent Developments
- 11.2.14.5. Financials (Based on Availability)
- 11.2.15 Sipchem Company
- 11.2.15.1. Overview
- 11.2.15.2. Products
- 11.2.15.3. SWOT Analysis
- 11.2.15.4. Recent Developments
- 11.2.15.5. Financials (Based on Availability)
- 11.2.16 Svensk Etanolkemi AB (SEKAB)
- 11.2.16.1. Overview
- 11.2.16.2. Products
- 11.2.16.3. SWOT Analysis
- 11.2.16.4. Recent Developments
- 11.2.16.5. Financials (Based on Availability)
- 11.2.17 Tanfac Industries Ltd
- 11.2.17.1. Overview
- 11.2.17.2. Products
- 11.2.17.3. SWOT Analysis
- 11.2.17.4. Recent Developments
- 11.2.17.5. Financials (Based on Availability)
- 11.2.18 Yankuang Group*List Not Exhaustive
- 11.2.18.1. Overview
- 11.2.18.2. Products
- 11.2.18.3. SWOT Analysis
- 11.2.18.4. Recent Developments
- 11.2.18.5. Financials (Based on Availability)
- 11.2.1 Celanese Corporation
List of Figures
- Figure 1: Global Acetic Acid Industry Revenue Breakdown (Million, %) by Region 2024 & 2032
- Figure 2: Asia Pacific Acetic Acid Industry Revenue (Million), by Derivative 2024 & 2032
- Figure 3: Asia Pacific Acetic Acid Industry Revenue Share (%), by Derivative 2024 & 2032
- Figure 4: Asia Pacific Acetic Acid Industry Revenue (Million), by Application 2024 & 2032
- Figure 5: Asia Pacific Acetic Acid Industry Revenue Share (%), by Application 2024 & 2032
- Figure 6: Asia Pacific Acetic Acid Industry Revenue (Million), by Country 2024 & 2032
- Figure 7: Asia Pacific Acetic Acid Industry Revenue Share (%), by Country 2024 & 2032
- Figure 8: North America Acetic Acid Industry Revenue (Million), by Derivative 2024 & 2032
- Figure 9: North America Acetic Acid Industry Revenue Share (%), by Derivative 2024 & 2032
- Figure 10: North America Acetic Acid Industry Revenue (Million), by Application 2024 & 2032
- Figure 11: North America Acetic Acid Industry Revenue Share (%), by Application 2024 & 2032
- Figure 12: North America Acetic Acid Industry Revenue (Million), by Country 2024 & 2032
- Figure 13: North America Acetic Acid Industry Revenue Share (%), by Country 2024 & 2032
- Figure 14: Europe Acetic Acid Industry Revenue (Million), by Derivative 2024 & 2032
- Figure 15: Europe Acetic Acid Industry Revenue Share (%), by Derivative 2024 & 2032
- Figure 16: Europe Acetic Acid Industry Revenue (Million), by Application 2024 & 2032
- Figure 17: Europe Acetic Acid Industry Revenue Share (%), by Application 2024 & 2032
- Figure 18: Europe Acetic Acid Industry Revenue (Million), by Country 2024 & 2032
- Figure 19: Europe Acetic Acid Industry Revenue Share (%), by Country 2024 & 2032
- Figure 20: South America Acetic Acid Industry Revenue (Million), by Derivative 2024 & 2032
- Figure 21: South America Acetic Acid Industry Revenue Share (%), by Derivative 2024 & 2032
- Figure 22: South America Acetic Acid Industry Revenue (Million), by Application 2024 & 2032
- Figure 23: South America Acetic Acid Industry Revenue Share (%), by Application 2024 & 2032
- Figure 24: South America Acetic Acid Industry Revenue (Million), by Country 2024 & 2032
- Figure 25: South America Acetic Acid Industry Revenue Share (%), by Country 2024 & 2032
- Figure 26: Middle East and Africa Acetic Acid Industry Revenue (Million), by Derivative 2024 & 2032
- Figure 27: Middle East and Africa Acetic Acid Industry Revenue Share (%), by Derivative 2024 & 2032
- Figure 28: Middle East and Africa Acetic Acid Industry Revenue (Million), by Application 2024 & 2032
- Figure 29: Middle East and Africa Acetic Acid Industry Revenue Share (%), by Application 2024 & 2032
- Figure 30: Middle East and Africa Acetic Acid Industry Revenue (Million), by Country 2024 & 2032
- Figure 31: Middle East and Africa Acetic Acid Industry Revenue Share (%), by Country 2024 & 2032
List of Tables
- Table 1: Global Acetic Acid Industry Revenue Million Forecast, by Region 2019 & 2032
- Table 2: Global Acetic Acid Industry Revenue Million Forecast, by Derivative 2019 & 2032
- Table 3: Global Acetic Acid Industry Revenue Million Forecast, by Application 2019 & 2032
- Table 4: Global Acetic Acid Industry Revenue Million Forecast, by Region 2019 & 2032
- Table 5: Global Acetic Acid Industry Revenue Million Forecast, by Derivative 2019 & 2032
- Table 6: Global Acetic Acid Industry Revenue Million Forecast, by Application 2019 & 2032
- Table 7: Global Acetic Acid Industry Revenue Million Forecast, by Country 2019 & 2032
- Table 8: China Acetic Acid Industry Revenue (Million) Forecast, by Application 2019 & 2032
- Table 9: India Acetic Acid Industry Revenue (Million) Forecast, by Application 2019 & 2032
- Table 10: Japan Acetic Acid Industry Revenue (Million) Forecast, by Application 2019 & 2032
- Table 11: South Korea Acetic Acid Industry Revenue (Million) Forecast, by Application 2019 & 2032
- Table 12: Rest of Asia Pacific Acetic Acid Industry Revenue (Million) Forecast, by Application 2019 & 2032
- Table 13: Global Acetic Acid Industry Revenue Million Forecast, by Derivative 2019 & 2032
- Table 14: Global Acetic Acid Industry Revenue Million Forecast, by Application 2019 & 2032
- Table 15: Global Acetic Acid Industry Revenue Million Forecast, by Country 2019 & 2032
- Table 16: United States Acetic Acid Industry Revenue (Million) Forecast, by Application 2019 & 2032
- Table 17: Canada Acetic Acid Industry Revenue (Million) Forecast, by Application 2019 & 2032
- Table 18: Mexico Acetic Acid Industry Revenue (Million) Forecast, by Application 2019 & 2032
- Table 19: Global Acetic Acid Industry Revenue Million Forecast, by Derivative 2019 & 2032
- Table 20: Global Acetic Acid Industry Revenue Million Forecast, by Application 2019 & 2032
- Table 21: Global Acetic Acid Industry Revenue Million Forecast, by Country 2019 & 2032
- Table 22: Germany Acetic Acid Industry Revenue (Million) Forecast, by Application 2019 & 2032
- Table 23: United Kingdom Acetic Acid Industry Revenue (Million) Forecast, by Application 2019 & 2032
- Table 24: Italy Acetic Acid Industry Revenue (Million) Forecast, by Application 2019 & 2032
- Table 25: France Acetic Acid Industry Revenue (Million) Forecast, by Application 2019 & 2032
- Table 26: Rest of Europe Acetic Acid Industry Revenue (Million) Forecast, by Application 2019 & 2032
- Table 27: Global Acetic Acid Industry Revenue Million Forecast, by Derivative 2019 & 2032
- Table 28: Global Acetic Acid Industry Revenue Million Forecast, by Application 2019 & 2032
- Table 29: Global Acetic Acid Industry Revenue Million Forecast, by Country 2019 & 2032
- Table 30: Brazil Acetic Acid Industry Revenue (Million) Forecast, by Application 2019 & 2032
- Table 31: Argentina Acetic Acid Industry Revenue (Million) Forecast, by Application 2019 & 2032
- Table 32: Rest of South America Acetic Acid Industry Revenue (Million) Forecast, by Application 2019 & 2032
- Table 33: Global Acetic Acid Industry Revenue Million Forecast, by Derivative 2019 & 2032
- Table 34: Global Acetic Acid Industry Revenue Million Forecast, by Application 2019 & 2032
- Table 35: Global Acetic Acid Industry Revenue Million Forecast, by Country 2019 & 2032
- Table 36: Saudi Arabia Acetic Acid Industry Revenue (Million) Forecast, by Application 2019 & 2032
- Table 37: South Africa Acetic Acid Industry Revenue (Million) Forecast, by Application 2019 & 2032
- Table 38: Rest of Middle East and Africa Acetic Acid Industry Revenue (Million) Forecast, by Application 2019 & 2032
Frequently Asked Questions
1. What is the projected Compound Annual Growth Rate (CAGR) of the Acetic Acid Industry?
The projected CAGR is approximately 4.65%.
2. Which companies are prominent players in the Acetic Acid Industry?
Key companies in the market include Celanese Corporation, Chang Chun Group, Daicel Corporation, Eastman Chemical Company, GNFC Limited, INEOS, Jiangsu SOPO (Group) Co Ltd, Kingboard Holdings Limited, LyondellBasell Industries Holdings BV, Mitsubishi Chemical Corporation, PetroChina Company Limited, Sabic, Shandong Hualu-Hengsheng Chemical Co Ltd, Shanghai Huayi Holding Group Co Ltd, Sipchem Company, Svensk Etanolkemi AB (SEKAB), Tanfac Industries Ltd, Yankuang Group*List Not Exhaustive.
3. What are the main segments of the Acetic Acid Industry?
The market segments include Derivative, Application.
4. Can you provide details about the market size?
The market size is estimated to be USD XX Million as of 2022.
5. What are some drivers contributing to market growth?
Increasing Demand for Vinyl Acetate Monomer (VAM); Increasing Demand from the Textile and Packaging Industry; Increasing Use of Ester Solvents in the Paints and Coating Industry.
6. What are the notable trends driving market growth?
Increasing Applications in the Adhesives. Paints. and Coatings Industry.
7. Are there any restraints impacting market growth?
Increasing Demand for Vinyl Acetate Monomer (VAM); Increasing Demand from the Textile and Packaging Industry; Increasing Use of Ester Solvents in the Paints and Coating Industry.
8. Can you provide examples of recent developments in the market?
January 2023: Kingboard Holdings Limited announced that the company's unit, Hebei Kingboard Energy Development Co., Ltd., plans to submit the "Environmental Impact Report of Hebei Kingboard Energy Development Co., Ltd. Acetic Acid Expansion and Transformation Project" for approval, and the entire content of the environmental impact study is accessible.
9. What pricing options are available for accessing the report?
Pricing options include single-user, multi-user, and enterprise licenses priced at USD 4750, USD 5250, and USD 8750 respectively.
10. Is the market size provided in terms of value or volume?
The market size is provided in terms of value, measured in Million.
11. Are there any specific market keywords associated with the report?
Yes, the market keyword associated with the report is "Acetic Acid Industry," which aids in identifying and referencing the specific market segment covered.
12. How do I determine which pricing option suits my needs best?
The pricing options vary based on user requirements and access needs. Individual users may opt for single-user licenses, while businesses requiring broader access may choose multi-user or enterprise licenses for cost-effective access to the report.
13. Are there any additional resources or data provided in the Acetic Acid Industry report?
While the report offers comprehensive insights, it's advisable to review the specific contents or supplementary materials provided to ascertain if additional resources or data are available.
14. How can I stay updated on further developments or reports in the Acetic Acid Industry?
To stay informed about further developments, trends, and reports in the Acetic Acid Industry, consider subscribing to industry newsletters, following relevant companies and organizations, or regularly checking reputable industry news sources and publications.
Methodology
Step 1 - Identification of Relevant Samples Size from Population Database


Step 2 - Approaches for Defining Global Market Size (Value, Volume* & Price*)

Note*: In applicable scenarios
Step 3 - Data Sources
Primary Research
- Web Analytics
- Survey Reports
- Research Institute
- Latest Research Reports
- Opinion Leaders
Secondary Research
- Annual Reports
- White Paper
- Latest Press Release
- Industry Association
- Paid Database
- Investor Presentations

Step 4 - Data Triangulation
Involves using different sources of information in order to increase the validity of a study
These sources are likely to be stakeholders in a program - participants, other researchers, program staff, other community members, and so on.
Then we put all data in single framework & apply various statistical tools to find out the dynamic on the market.
During the analysis stage, feedback from the stakeholder groups would be compared to determine areas of agreement as well as areas of divergence


